






















Kick-start your app creation
Whether you’re a beginner or a pro, Dynatrace Developer has the tools and support you need to create incredible apps with minimal effort.
Go to Dynatrace Developer
 Zoom Workplace
Observe the Zoom Workplace: zoom rooms, devices, meetings and participants.
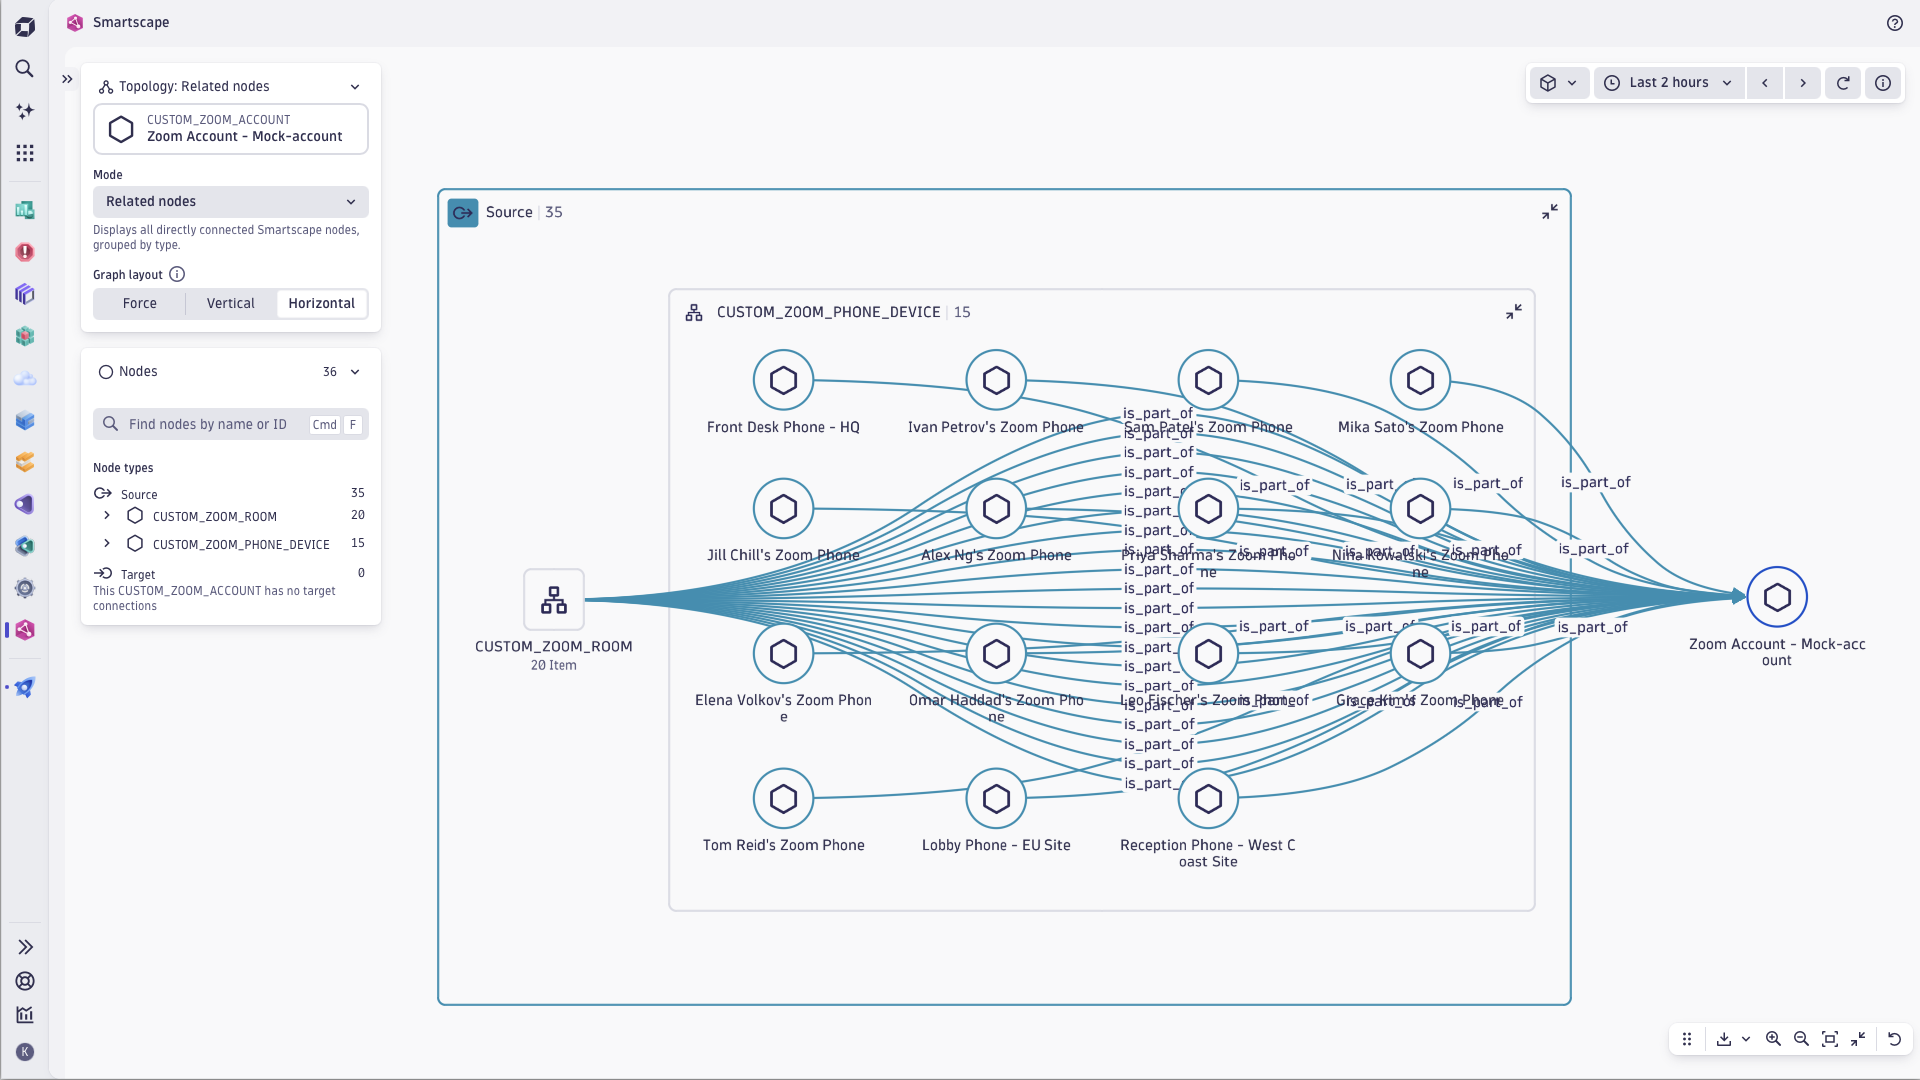
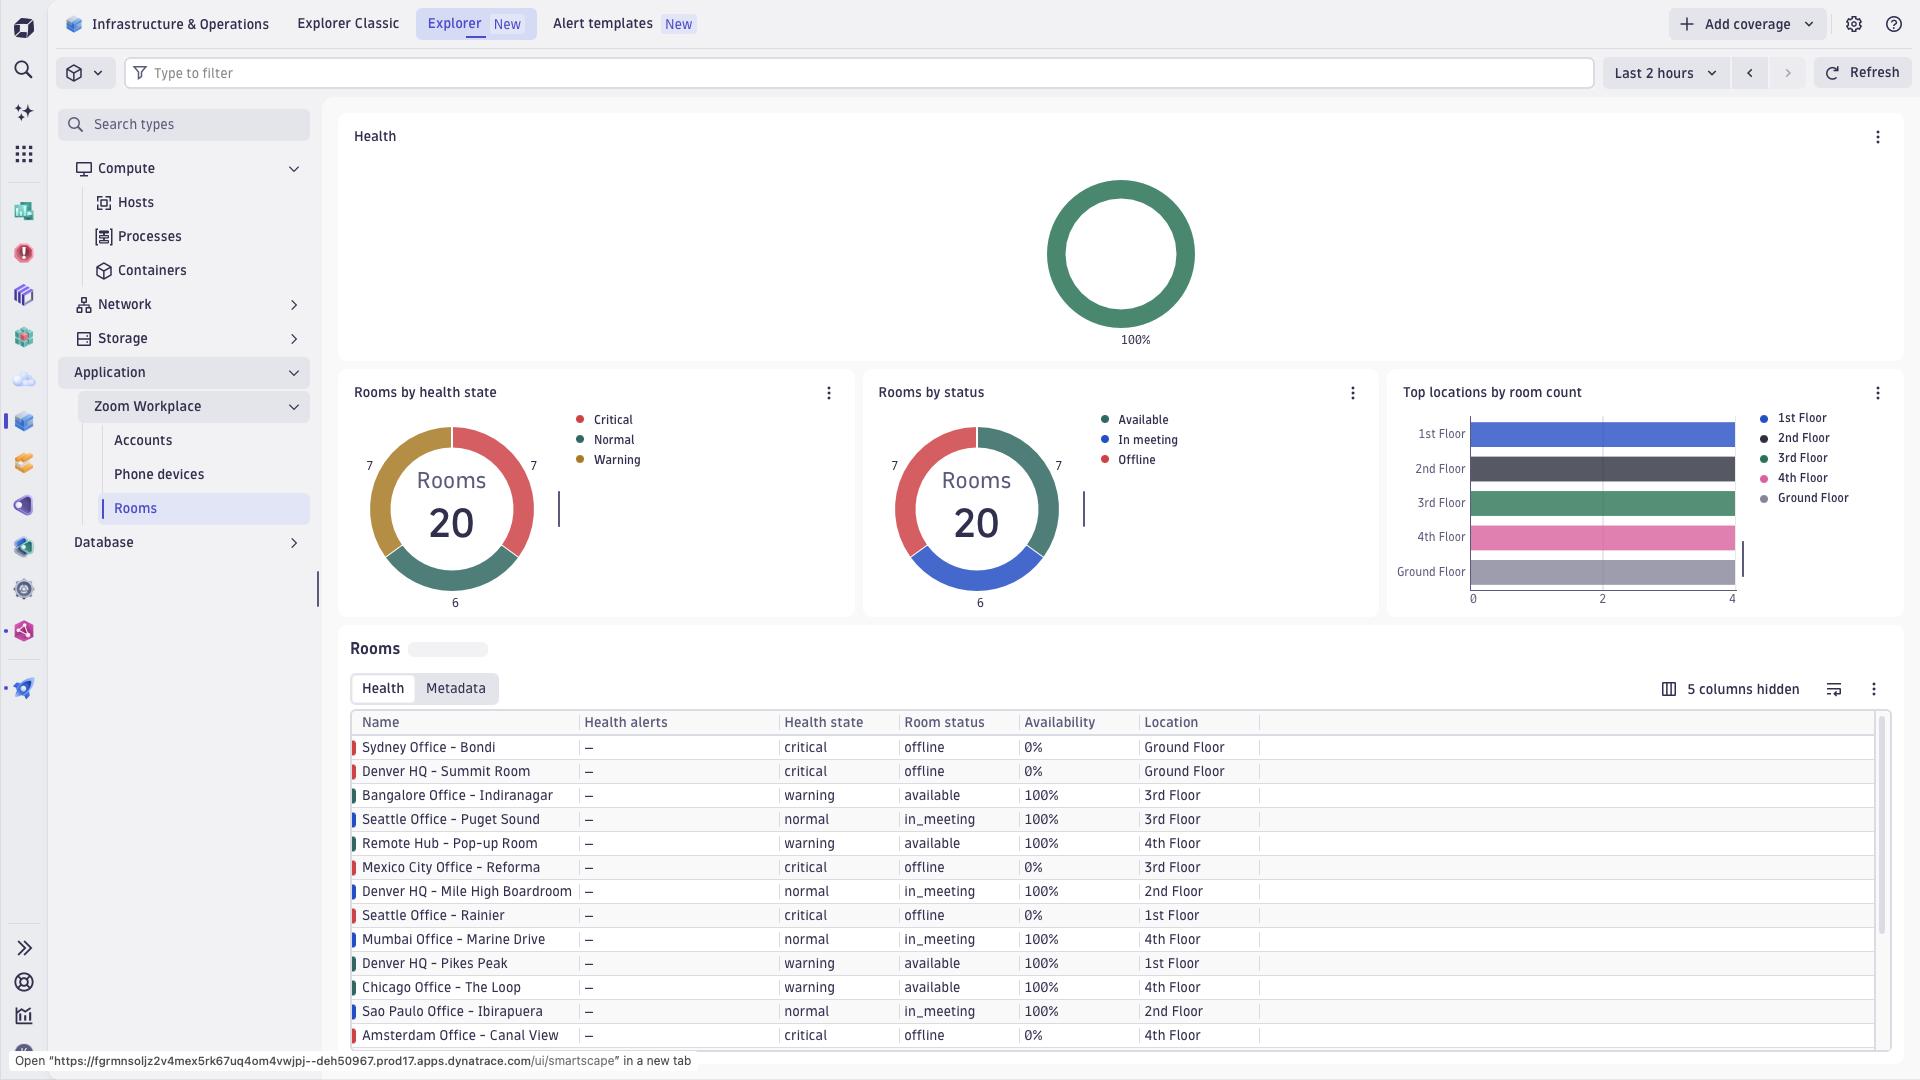
ExtensionThe Zoom Workplace extension ingests the Zoom Workplace account observability signals, populates a Grail dataset in Dynatrace, builds a topological representation of the Zoom Accounts, Zoom Rooms, Zoom Phone Devices and also offers per-meeting and per-room details as structured logs. Ready-to-use dashboards, analysis screens and alert templates enable comprehensive analysis of the Zoom Workplace activities and performance.
You need a Zoom Pro, Business, or Enterprise account, with Business+ recommended. You also need admin-level access to the Zoom App Marketplace to create an OAuth app on Zoom side that will let Dynatrace connect and collect observability signals.
For step-by-step instructions on the installation and configuration on both Zoom and Dynatrace sides, please see Zoom Workplace extension in the Dynatrace Documentation.
The Zoom Workplace extension collects observability signals for:
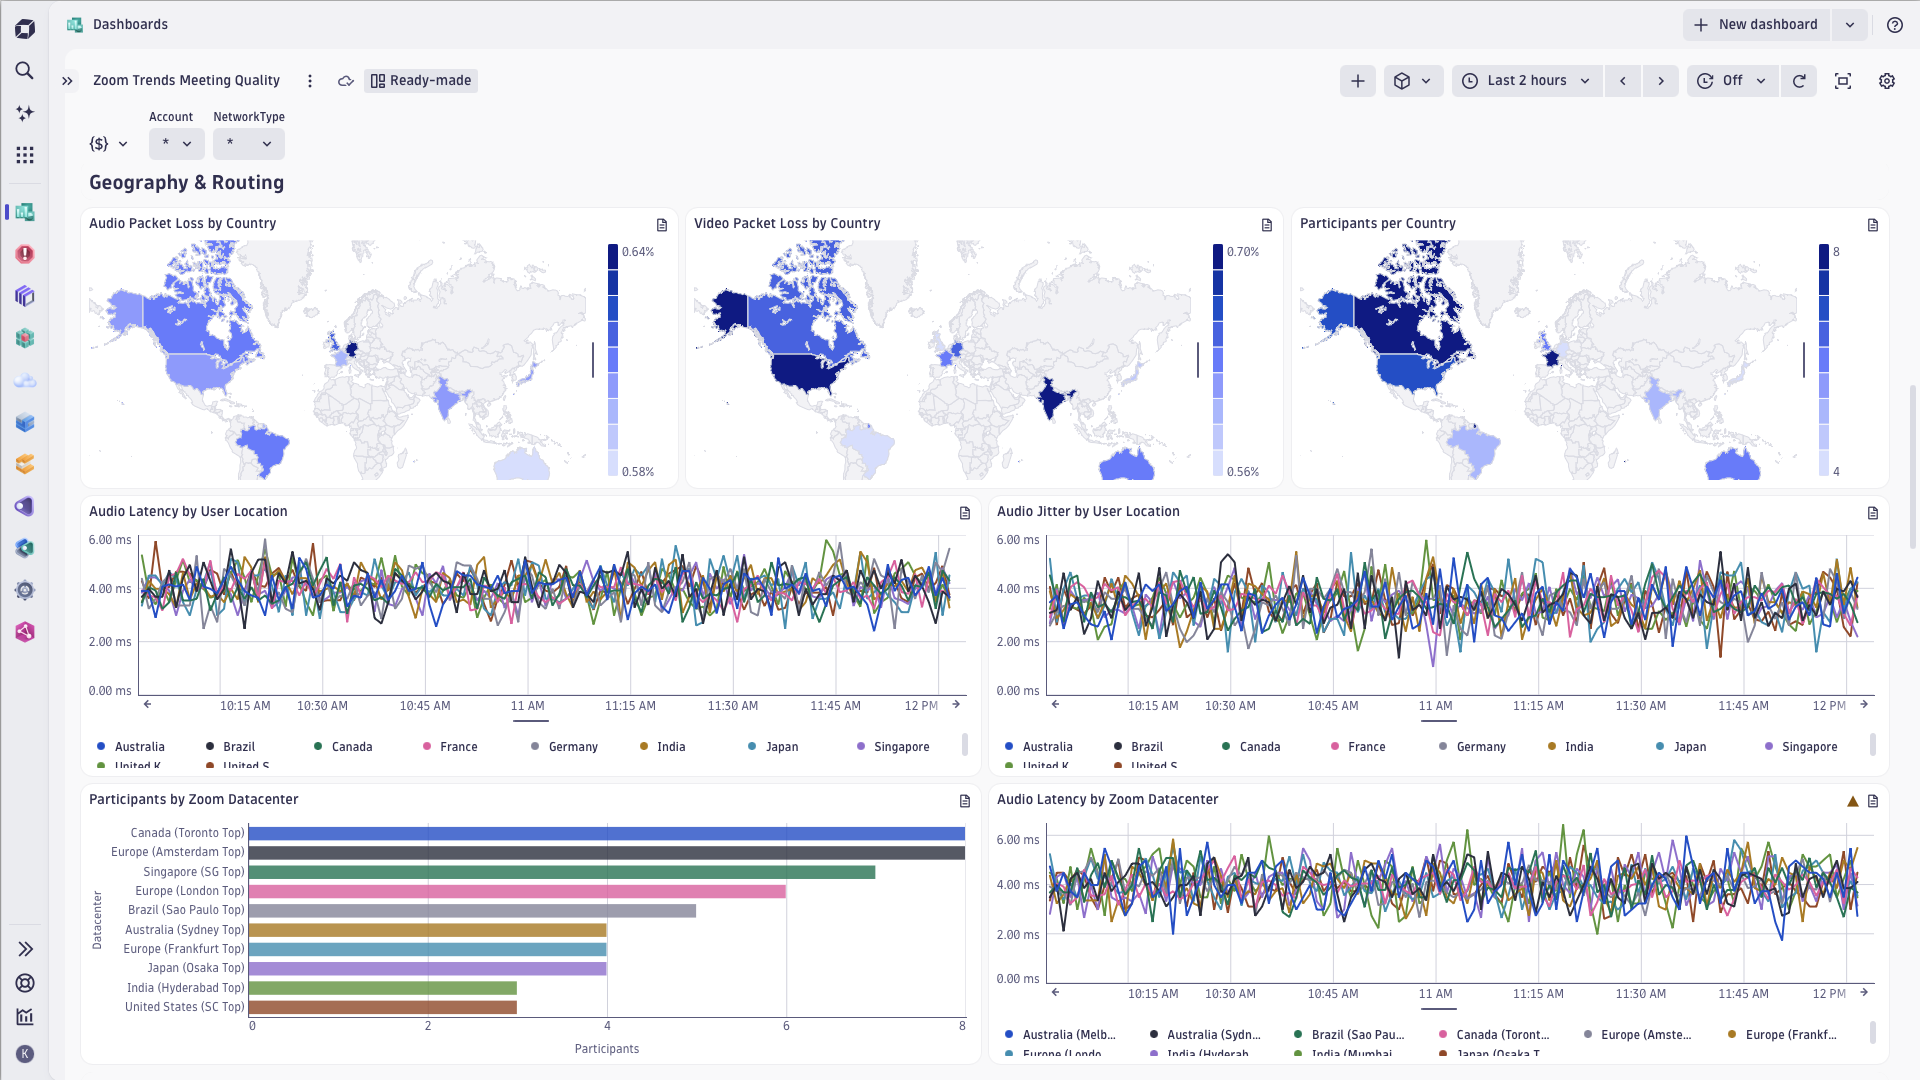
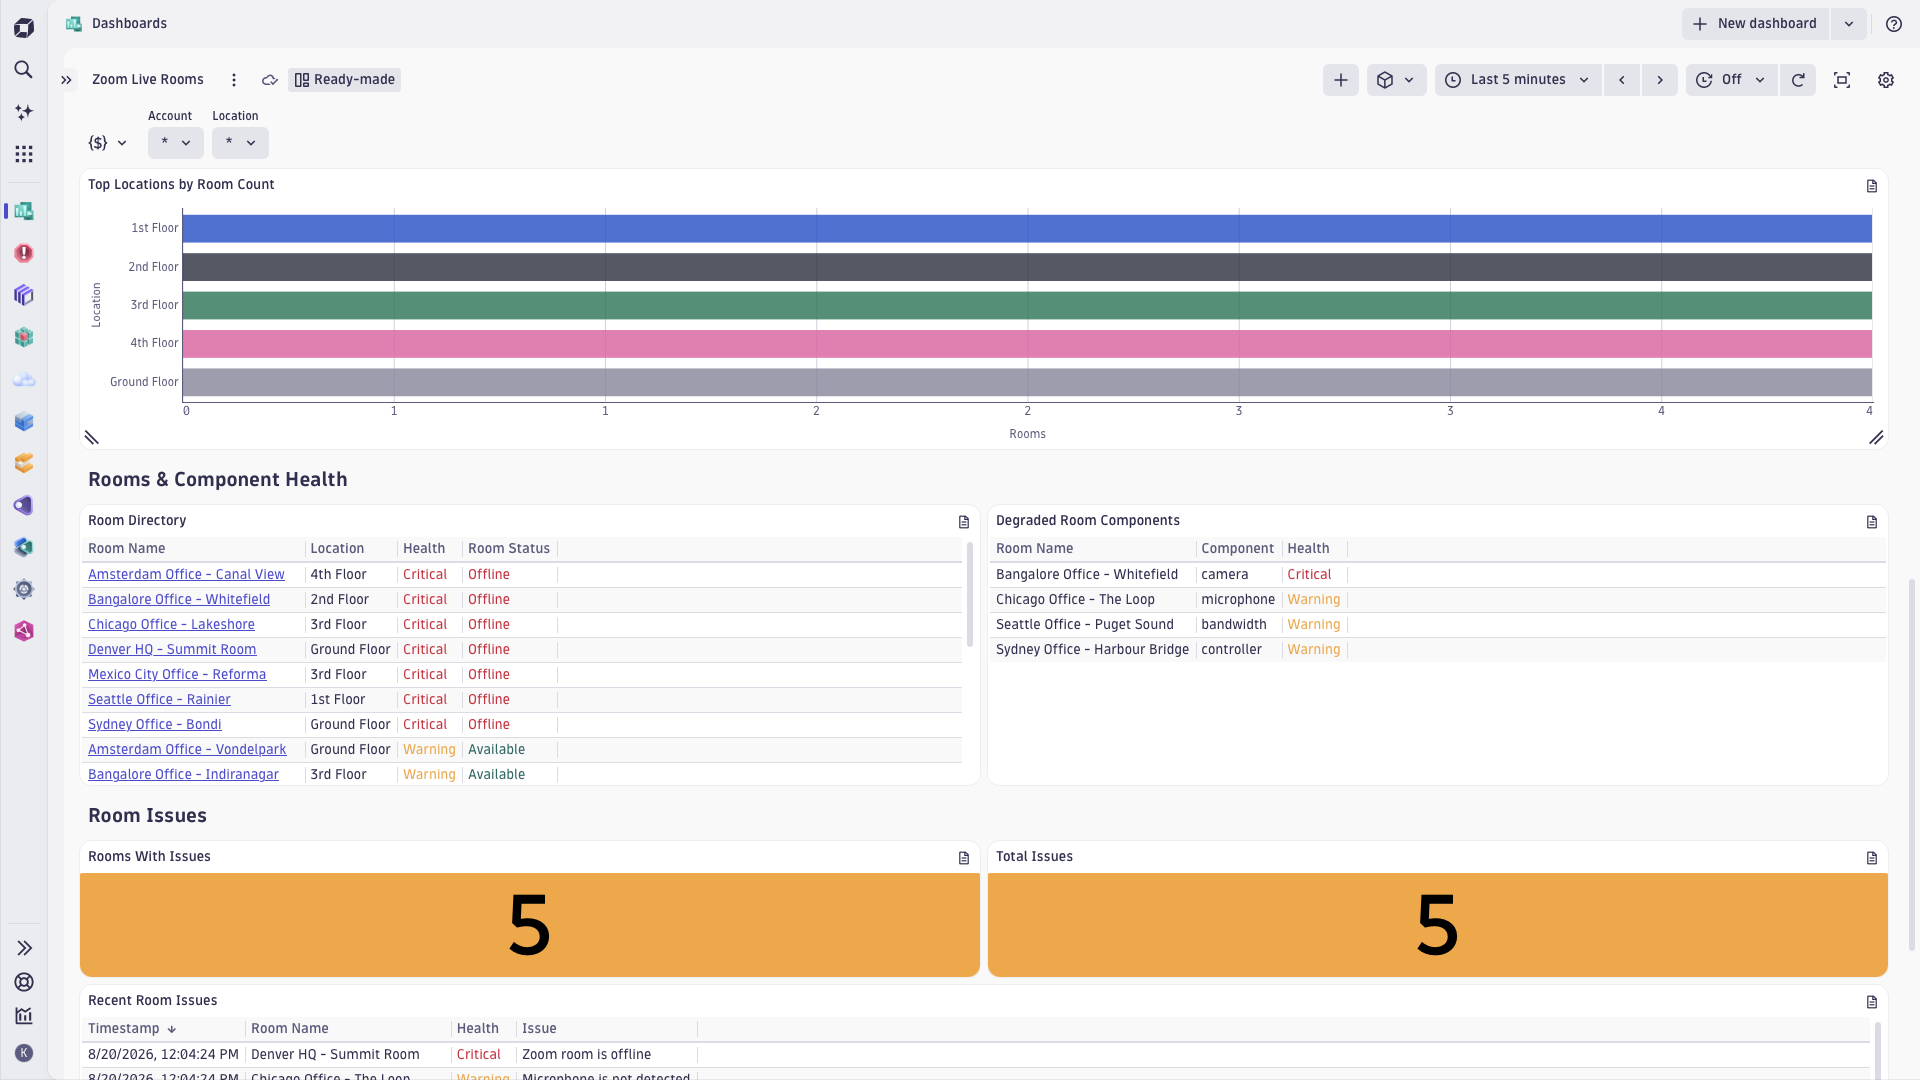
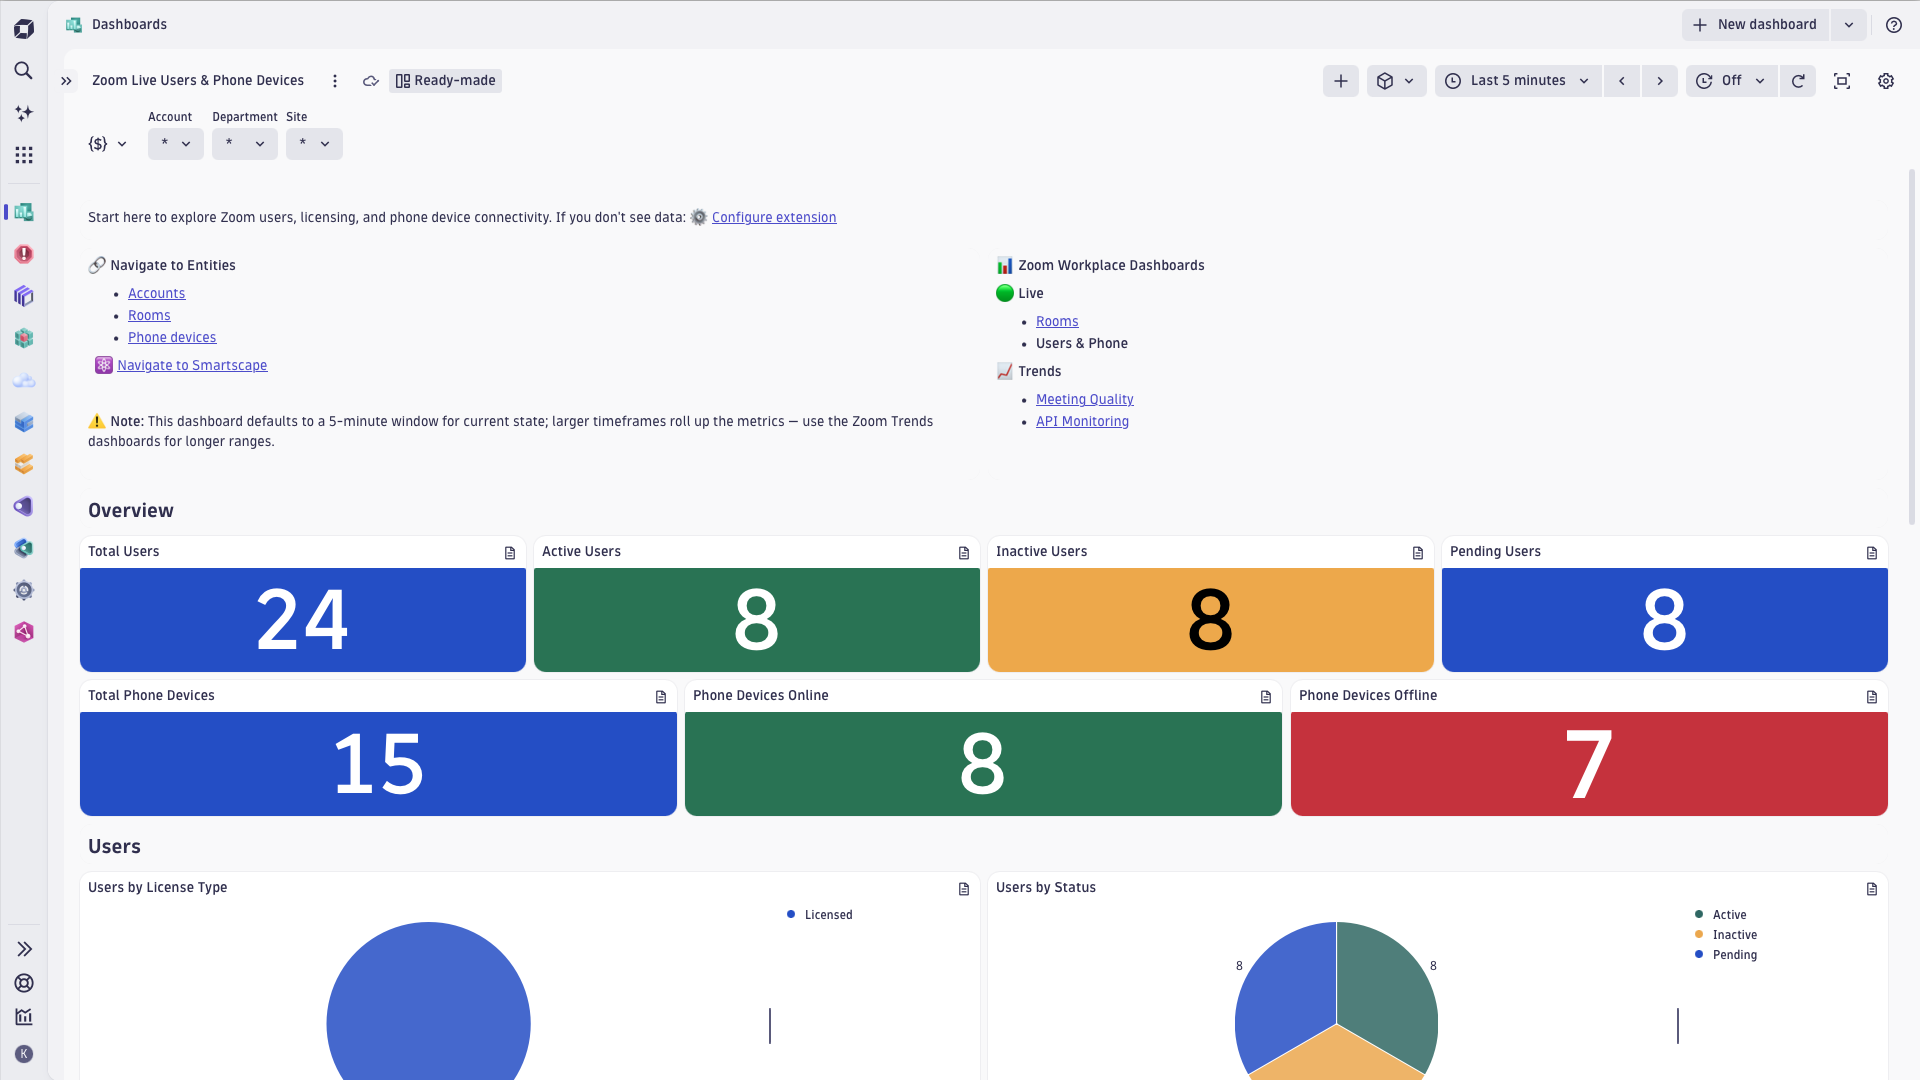
The extension brings four dashboards — two Live pages (Rooms, and Users & Phone Devices) and two Trends pages (Meeting Quality, and API Monitoring) — and seven alert templates.
Below is a complete list of the feature sets provided in this version. To ensure a good fit for your needs, individual feature sets can be activated and deactivated by your administrator during configuration.
| Metric name | Metric key | Description | Unit |
|---|---|---|---|
| Phone Devices | zoom.phone.devices | One data point per device per poll (value always 1); group/filter by the `device_status` dimension for online/offline/other breakdowns. | Count |
| Metric name | Metric key | Description | Unit |
|---|---|---|---|
| Zoom API successful calls | sfm.zoom.api.successful_calls | Number of successful Zoom API calls in the last self_monitoring window, split by endpoint. One count per logical request (each fetched page counts as a call). | Count |
| Zoom API failed calls | sfm.zoom.api.failed_calls | Number of failed Zoom API calls in the last self_monitoring window, split by endpoint and error type (e.g. ZoomAuthenticationError, ZoomConnectionError, ZoomDailyLimitError). | Count |
| Zoom API rate-limit hits | sfm.zoom.api.rate_limit.hit | One data point per Zoom API rate-limit (429) response encountered, split by limit type (QPS / Daily-limit) and API class. | Count |
| Metric name | Metric key | Description | Unit |
|---|---|---|---|
| Zoom Users | zoom.users | One data point per user per collection cycle, aggregated by license type, department and status at query time. | Count |
| Metric name | Metric key | Description | Unit |
|---|---|---|---|
| Video bitrate | zoom.meeting.participant.video.bitrate | Per-participant video throughput in live meetings, split by direction. | KiloBitPerSecond |
| Video latency | zoom.meeting.participant.video.latency | Per-participant video network delay in live meetings, split by direction. | MilliSecond |
| Video jitter | zoom.meeting.participant.video.jitter | Per-participant video jitter in live meetings, split by direction. | MilliSecond |
| Average video packet loss | zoom.meeting.participant.video.avg_loss | Per-participant average video packet loss in live meetings, split by direction. | Percent |
| Peak video packet loss | zoom.meeting.participant.video.max_loss | Per-participant peak video packet loss in live meetings, split by direction. | Percent |
| Metric name | Metric key | Description | Unit |
|---|---|---|---|
| Zoom-client CPU usage (min) | zoom.participant.zoom_client_cpu.min | Minimum per-participant Zoom-client CPU usage in live meetings. | Percent |
| Zoom-client CPU usage (avg) | zoom.participant.zoom_client_cpu.avg | Average per-participant Zoom-client CPU usage in live meetings. | Percent |
| Zoom-client CPU usage (max) | zoom.participant.zoom_client_cpu.max | Peak per-participant Zoom-client CPU usage in live meetings. | Percent |
| Metric name | Metric key | Description | Unit |
|---|---|---|---|
| Active meetings | zoom.meetings.active | Number of currently active (live) meetings, grouped by host license type and department. | Count |
| Meeting participants | zoom.meetings.participants | Number of participants currently in each live meeting, tagged by host license type and department. | Count |
| Average meeting duration | zoom.meetings.duration.avg | Average duration of live meetings, grouped by host license type and department. | Minute |
| Metric name | Metric key | Description | Unit |
|---|---|---|---|
| Zoom Rooms | zoom.rooms | One data point per Zoom Room per collection cycle, aggregated by health and status at query time. | Count |
| Room component health | zoom.room.component.status | Per-room component health code (1 healthy / 2 warning / 3 critical) derived from the room's issues[] array, split by component (microphone, speaker, camera, controller, bandwidth, cpu). | State |
| Room issue count | zoom.room.issues | Count of entries in the room's issues[] array for this collection cycle, polled from GET /metrics/zoomrooms. | Count |
| Metric name | Metric key | Description | Unit |
|---|---|---|---|
| Audio bitrate | zoom.meeting.participant.audio.bitrate | Per-participant audio throughput in live meetings, split by direction. Detailed troubleshooting context lives in activity logs. | KiloBitPerSecond |
| Audio latency | zoom.meeting.participant.audio.latency | Per-participant audio network delay in live meetings, split by direction. | MilliSecond |
| Audio jitter | zoom.meeting.participant.audio.jitter | Per-participant audio jitter in live meetings, split by direction. | MilliSecond |
| Average audio packet loss | zoom.meeting.participant.audio.avg_loss | Per-participant average audio packet loss in live meetings, split by direction. | Percent |
| Peak audio packet loss | zoom.meeting.participant.audio.max_loss | Per-participant peak audio packet loss in live meetings, split by direction. | Percent |
Update the certifi dependency to address CVE-2026-111943
Initial release. Looking forward for your feedback via the Dynatrace Community!