






















Skip to technology filters Skip to main content
Dynatrace Hub

Extend the platform,
empower your team.

Popular searches:
Home hero bg
Connection Pools: WebsphereConnection Pools: Websphere
Connection Pools: Websphere

Connection Pools: Websphere

Monitor IBM WebSphere Application Server connection pool performance.

Extension
Free trialDocumentation
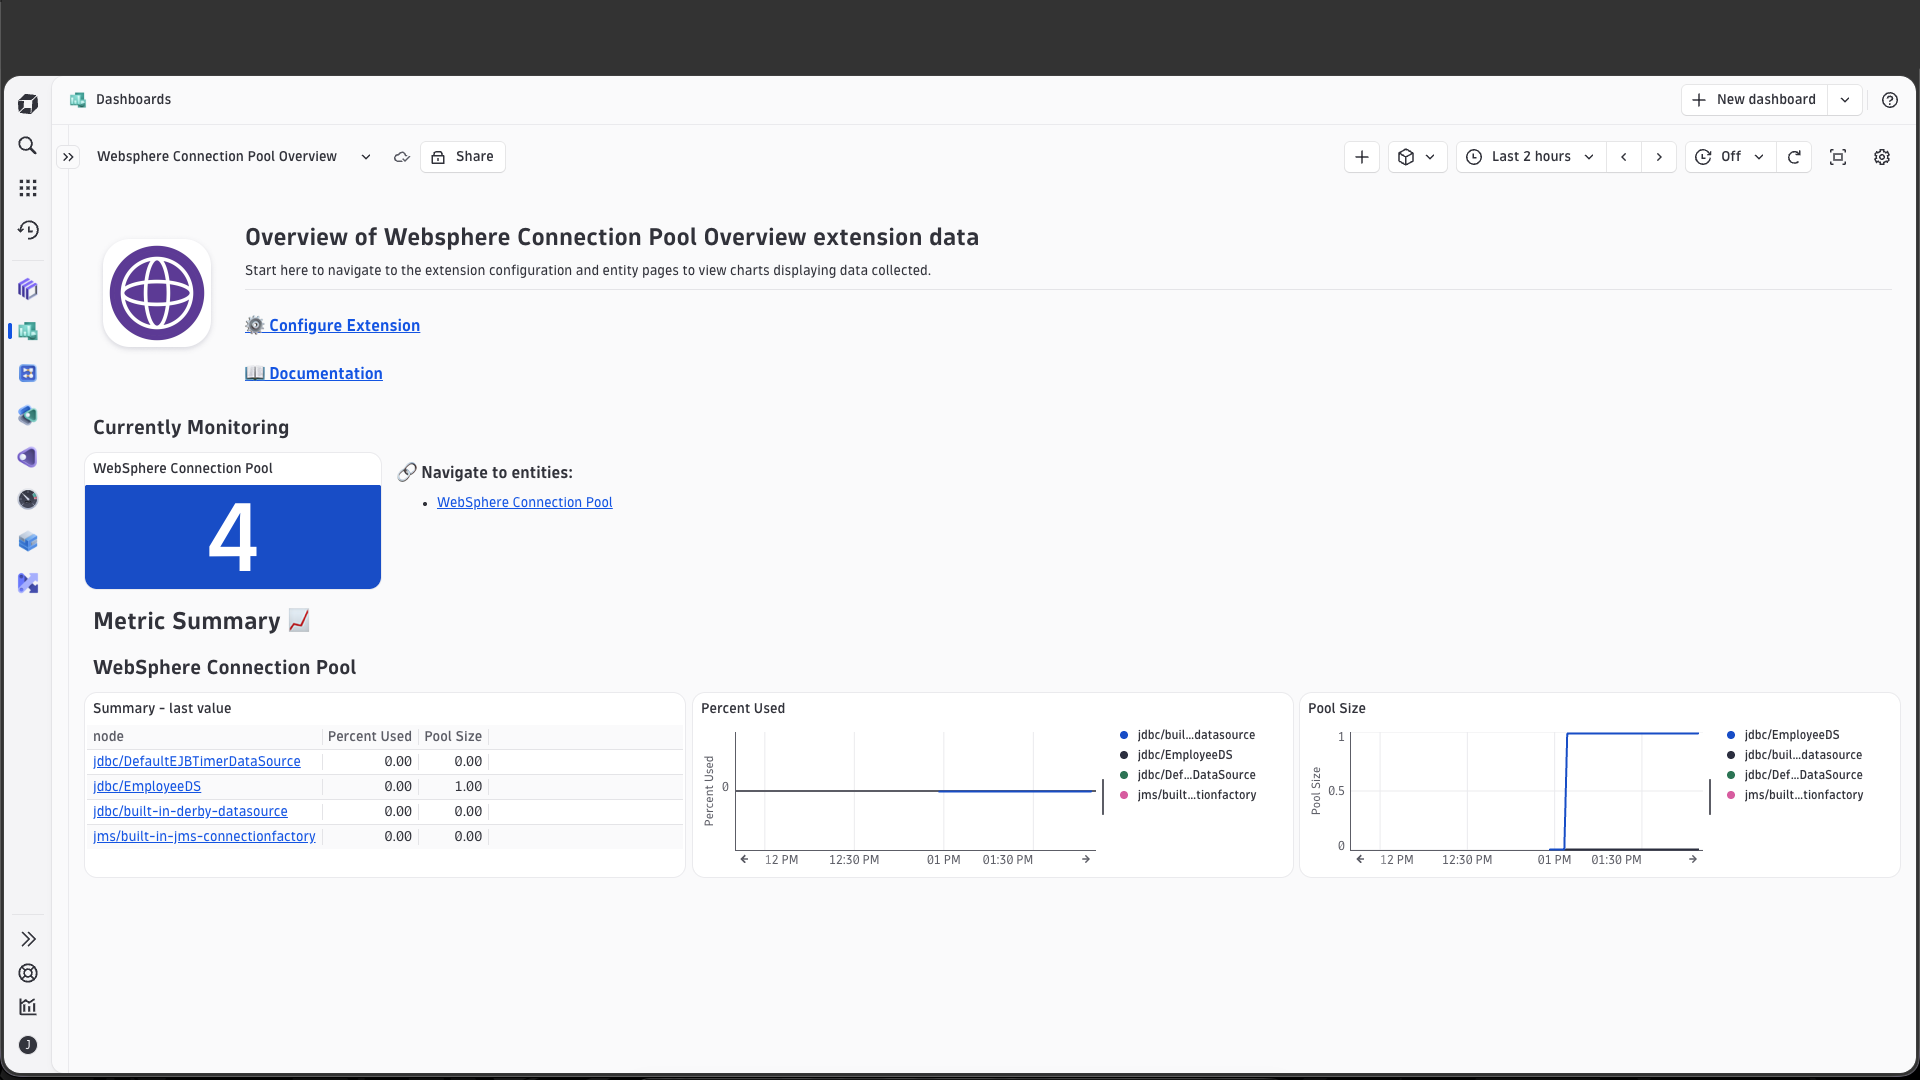
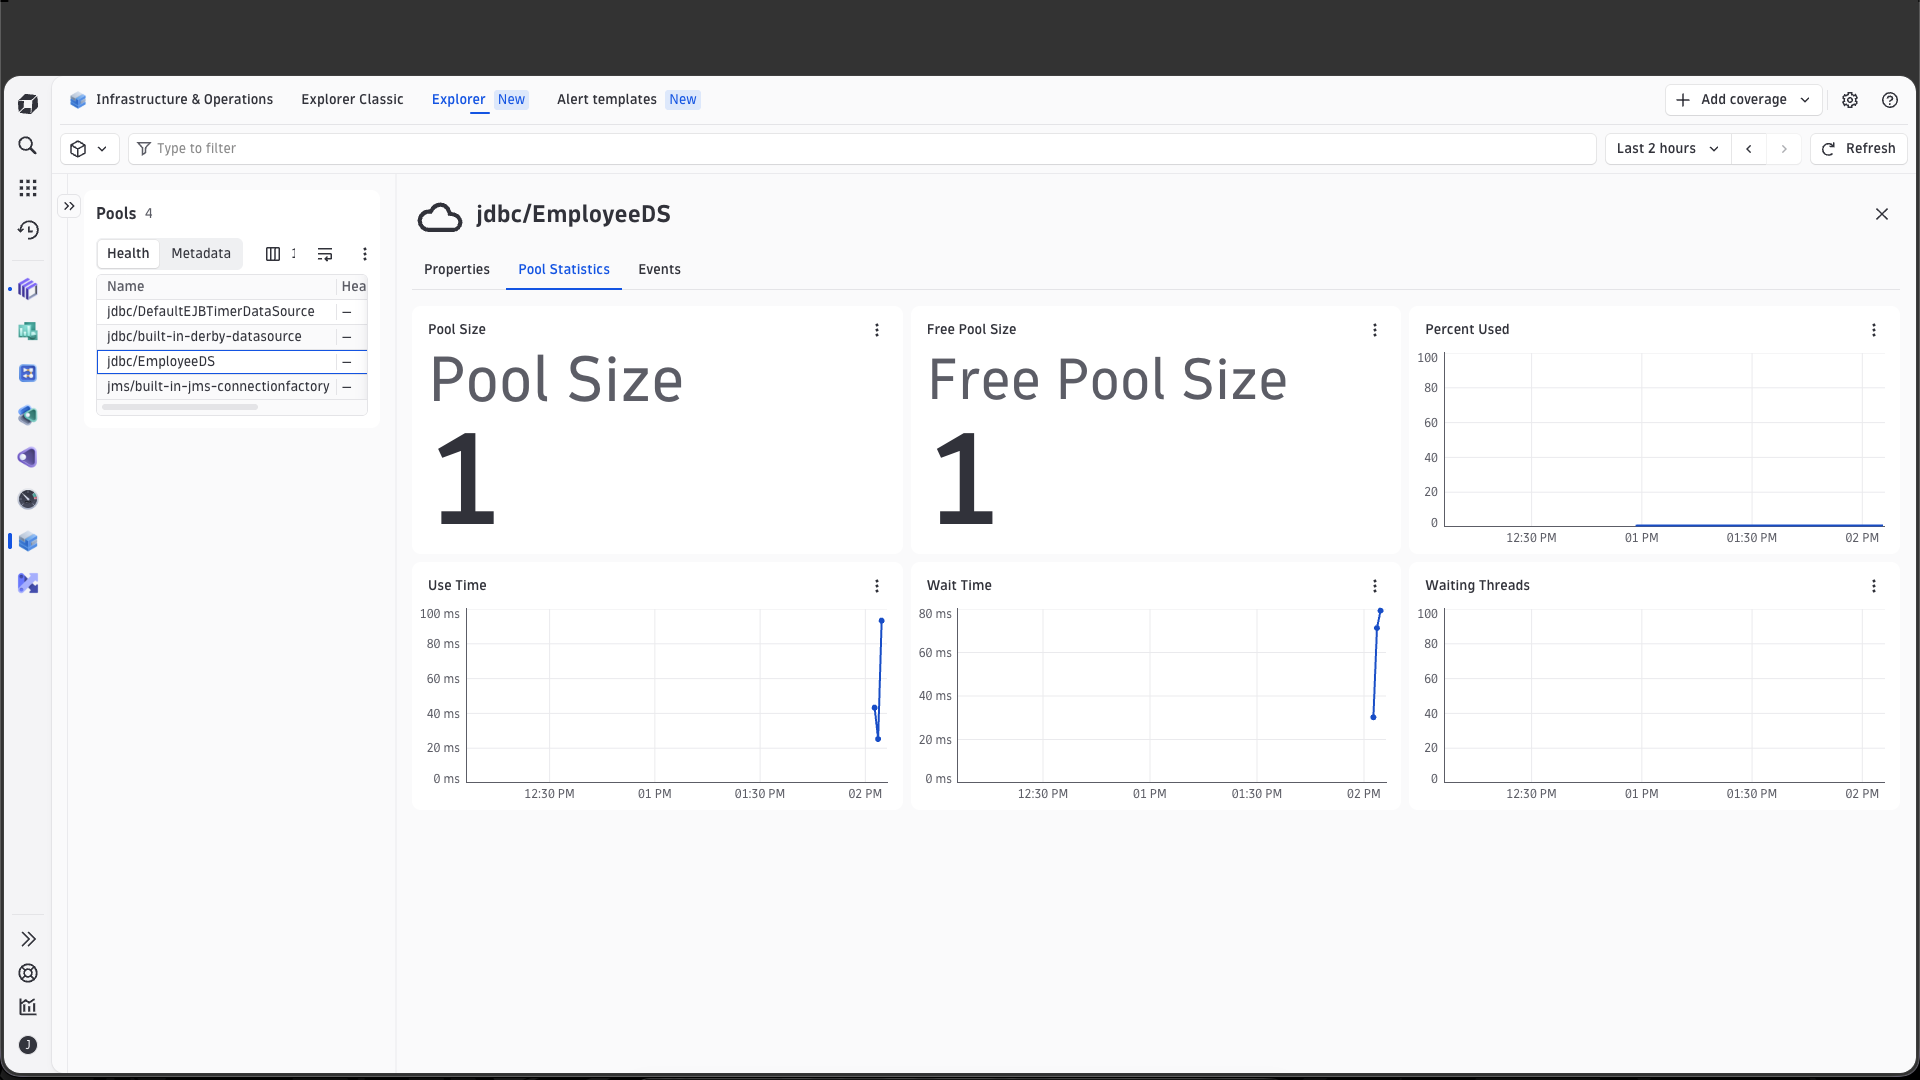
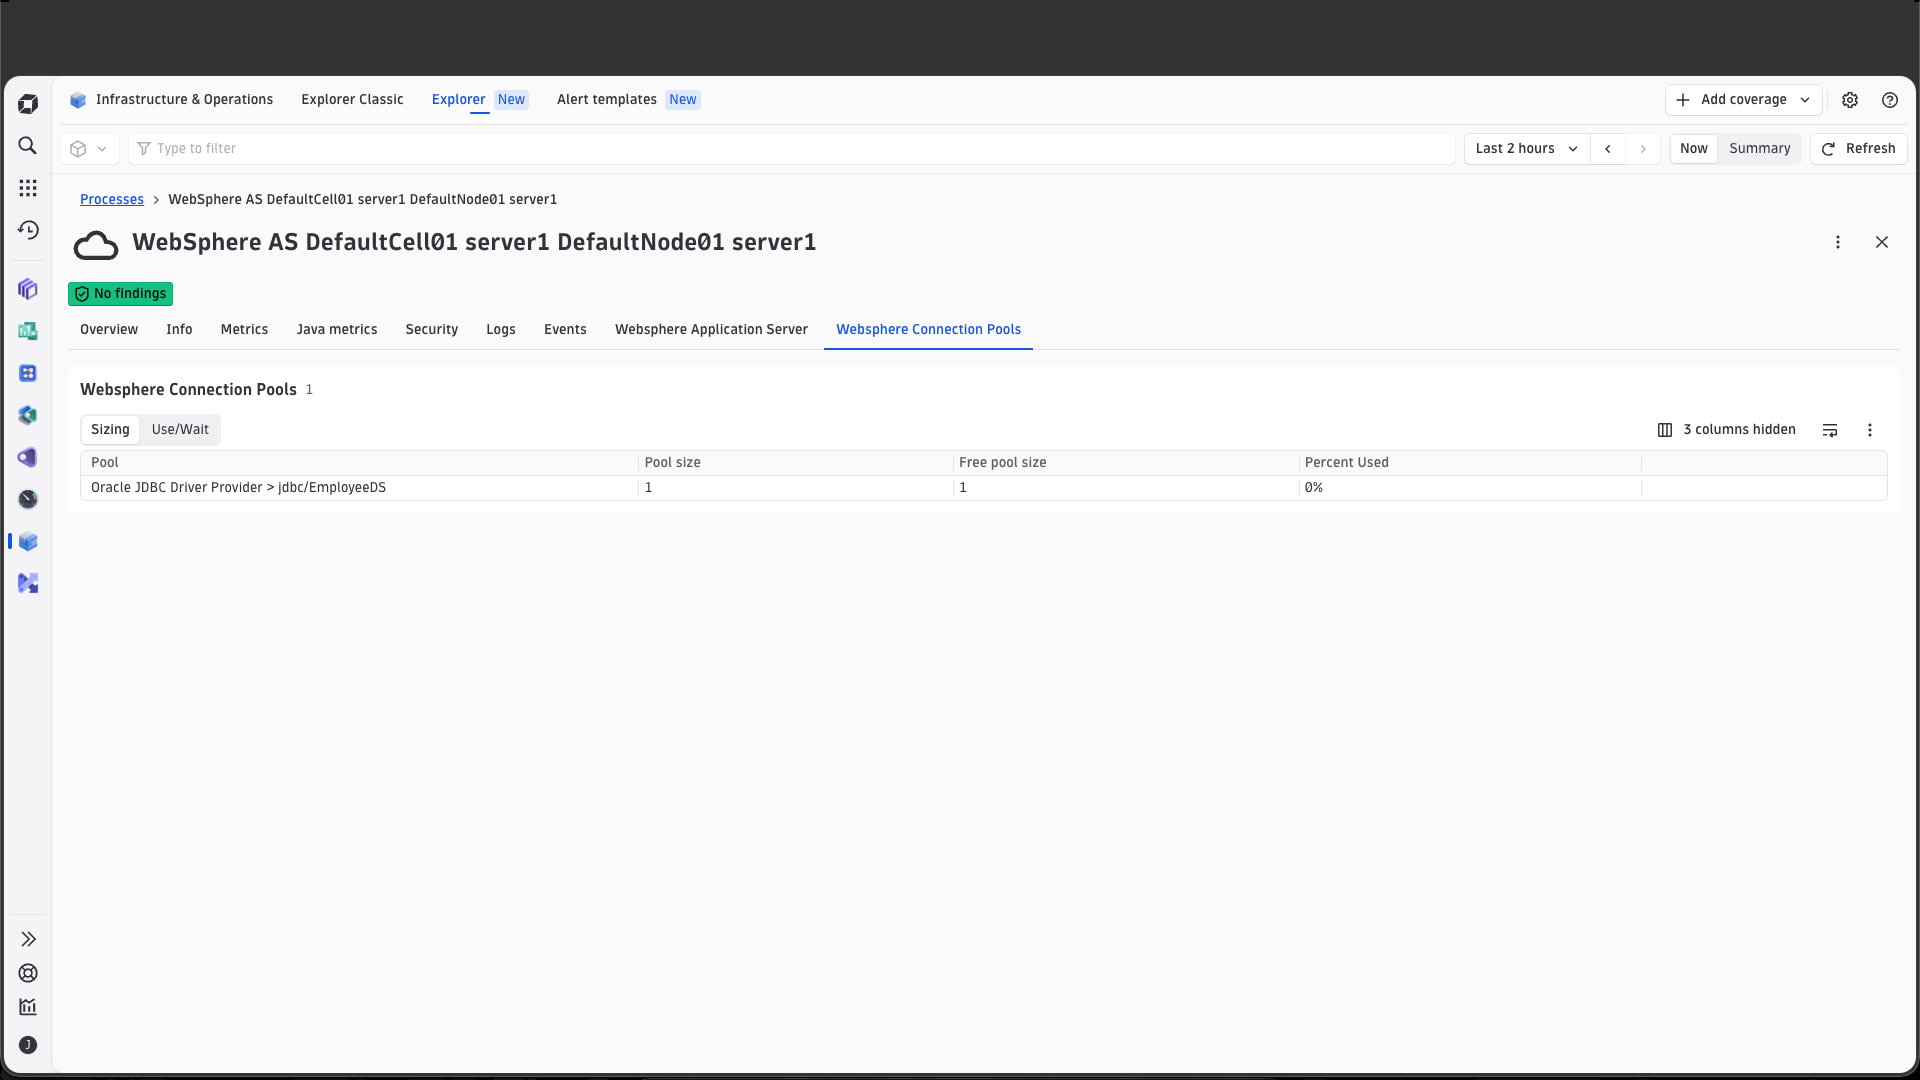
Get an overview of your Websphere connection pool monitoring, using the pre-packaged dashboard.See an overview of each connection pool's health.Get a quick view of the connection pools associated with the Websphere Application Server.
  • Product information
  • Release notes

Overview

The IBM WebSphere Connection Pool extension monitors connection pool health and performance metrics from IBM WebSphere Application Servers using the Performance Monitoring Infrastructure (PMI). It collects data from both the legacy WebSphere connection pool module and the J2C (Java EE Connector Architecture) connection pool module, giving you a unified view of connection pool behavior across all your WebSphere instances monitored by OneAgent.

Connection pools are critical to application performance—when a pool is exhausted or heavily contended, applications experience increased latency and potential failures as threads queue up waiting for an available connection. This extension surfaces the key indicators of pool health so you can proactively manage capacity and quickly diagnose contention issues before they impact end users.

Use cases

  • Monitor connection pool utilization to identify pools approaching capacity before applications are impacted.
  • Track free pool size and total pool size to ensure sufficient connection capacity for application demand.
  • Detect thread contention by monitoring the number of threads waiting for connections from the pool.
  • Measure connection wait time and in-use time to pinpoint performance bottlenecks in database connection management.
  • Monitor both legacy WebSphere connection pool modules and J2C connection pool modules from a single extension.
  • Correlate connection pool metrics with the processes and hosts running WebSphere to quickly isolate the source of pool issues.

Get started

For more information on the installation and configuration, please see IBM WebSphere Connection Pool extension in the Dynatrace Documentation.

Details

Compatibility information

  • Supports the legacy WebSphere connection pool module (connectionPoolModule) and the J2C connection pool module (j2cModule).
  • Requires OneAgent installed on the IBM WebSphere Application Server host.
Dynatrace
Documentation
By Dynatrace
Dynatrace support center
Subscribe to new releases
Copy to clipboard

Feature sets

Below is a complete list of the feature sets provided in this version. To ensure a good fit for your needs, individual feature sets can be activated and deactivated by your administrator during configuration.

Feature setsNumber of metrics included
Metric nameMetric keyDescriptionUnit
Percent Usedwebsphere.connection_pool.percent_usedPercentage of the connection pool that is currently in usePercent
Pool Sizewebsphere.connection_pool.pool_sizeTotal size of the connection poolUnspecified
Free Pool Sizewebsphere.connection_pool.free_pool_sizeNumber of free connections available in the connection poolUnspecified
Wait Timewebsphere.connection_pool.wait_timeAverage time in milliseconds spent waiting for a connection from the poolMilliSecond
In Use Timewebsphere.connection_pool.use_timeAverage time in milliseconds a connection is held in use before being returned to the poolMilliSecond
Waiting Threadswebsphere.connection_pool.waiting_threadsNumber of threads waiting for a connection from the poolCount
Metric nameMetric keyDescriptionUnit
Percent Usedwebsphere.connection_pool.percent_usedPercentage of the connection pool that is currently in usePercent
Pool Sizewebsphere.connection_pool.pool_sizeTotal size of the connection poolUnspecified
Free Pool Sizewebsphere.connection_pool.free_pool_sizeNumber of free connections available in the connection poolUnspecified
Wait Timewebsphere.connection_pool.wait_timeAverage time in milliseconds spent waiting for a connection from the poolMilliSecond
In Use Timewebsphere.connection_pool.use_timeAverage time in milliseconds a connection is held in use before being returned to the poolMilliSecond
Waiting Threadswebsphere.connection_pool.waiting_threadsNumber of threads waiting for a connection from the poolCount

Full version history

To have more information on how to install the downloaded package, please follow the instructions on this page.
ReleaseDate

Full version history

Initial release

Dynatrace Hub
Get data into DynatraceBuild your own app
Dynatrace Intelligence - Agentic Operations SystemThe Dynatrace Agentic AI ecosystem
All (925)Log Management and AnalyticsKubernetesAI and LLM ObservabilityInfrastructure ObservabilitySoftware DeliveryApplication ObservabilityApplication SecurityBusiness ObservabilityDigital Experience
Filter
Type
Built and maintained by
Partner FinderBecome a partnerDynatrace Developer

Discover recent additions to Dynatrace

Dynatrace Assist logo

Dynatrace Assist

Dynatrace Assist: Ask, analyze, and act with Dynatrace Intelligence.

Smartscape logo

Smartscape

Interactively explore and analyze topology and relationships in digital systems.

Compliance Assistant logo

Compliance Assistant

Track, manage, and automate compliance across your IT and business landscape.

Experience Vitals logo

Experience Vitals

Optimize UX with core vitals, frontend error tracking, and end-to-end visibility.

Error Inspector logo

Error Inspector

Discover, triage, and manage errors across all your frontends.

Users & Sessions logo

Users & Sessions

Replay how users experience your frontend. Analyze behavior and outcomes.

Analyze your data

Understand your data better with deep insights and clear visualizations.

Notebooks logo

Notebooks

Create powerful, data-driven documents for custom analytics and collaboration.

Dashboards logo

Dashboards

Transform complex data into clear visualizations with custom dashboards.

Investigations logo

Investigations

Fast and precise incident response on Grail data with DQL queries.

Smartscape logo

Smartscape

Interactively explore and analyze topology and relationships in digital systems.

Logs logo

Logs

Explore all your logs without writing a single query.

Problems logo

Problems

Detect, explain and triage problems automatically using Dynatrace Intelligence.

Automate your processes

Turn data and answers into actions, securely, and at scale.

Workflows logo

Workflows

Automate tasks in your IT landscape and move towards autonomous operations.

Jira logo

Jira

Open, update, and close Jira tickets automatically from Dynatrace Workflows.

Slack logo

Slack

Automate Slack messaging for security incidents, attacks, remediation, and more.

Secure your cloud application

See vulnerabilities and attacks in your environment.

Security Posture Management logo

Security Posture Management

Detect, prioritize, and remediate security and compliance findings with SPM.

Threats & Exploits logo

Threats & Exploits

Understand, triage, and investigate detection findings and alerts.

More resources

Cursor (Live-Debugger) logo

Cursor (Live-Debugger)

Get Real time Code-Level data directly to your Cursor IDE.

Documents logo

Documents

Manage Dashboards, Notebooks and other documents in your Dynatrace environment.

GitHub Copilot Coding Agent logo

GitHub Copilot Coding Agent

Automate vulnerability remediation and boost developer productivity.

GitHub Copilot Custom Agent logo

GitHub Copilot Custom Agent

Automate your development workflows with specialized agent definitions.

Dynatrace Live Debugger on JetBrains logo

Dynatrace Live Debugger on JetBrains

Get real-time code-level data directly to your Jetbrains IDE.

Metrics logo

Metrics

Browse, search, and manage all your metrics in one central catalog.

Pagerduty for Dynatrace Workflows logo

Pagerduty for Dynatrace Workflows

Streamline incident management with automated Pageruty workflows.

Dynatrace Live Debugger on Windsurf logo

Dynatrace Live Debugger on Windsurf

Get real-time code-level data directly to your Windsurf IDE.

Are you looking for something different?

We have hundreds of apps, extensions, and other technologies to customize your environment

Leverage our newest innovations of Dynatrace Saas

Kick-start your app creation

Kick-start your app creation

Whether you’re a beginner or a pro, Dynatrace Developer has the tools and support you need to create incredible apps with minimal effort.
Go to Dynatrace Developer

Upgrading from Dynatrace Managed to SaaS

Upgrading from Dynatrace Managed to SaaS

Drive innovation, speed, and agility in your organization by seamlessly and securely upgrading.
Learn More
Log Management and Analytics

Log Management and Analytics

Innovate faster and more efficiently with unified log management and log analytics for actionable insights and automation.
Learn more