












Skip to technology filters Skip to main content
Dynatrace Hub

Extend the platform,
empower your team.

Popular searches:
Home hero bg
WeaviateWeaviate
Weaviate

Weaviate

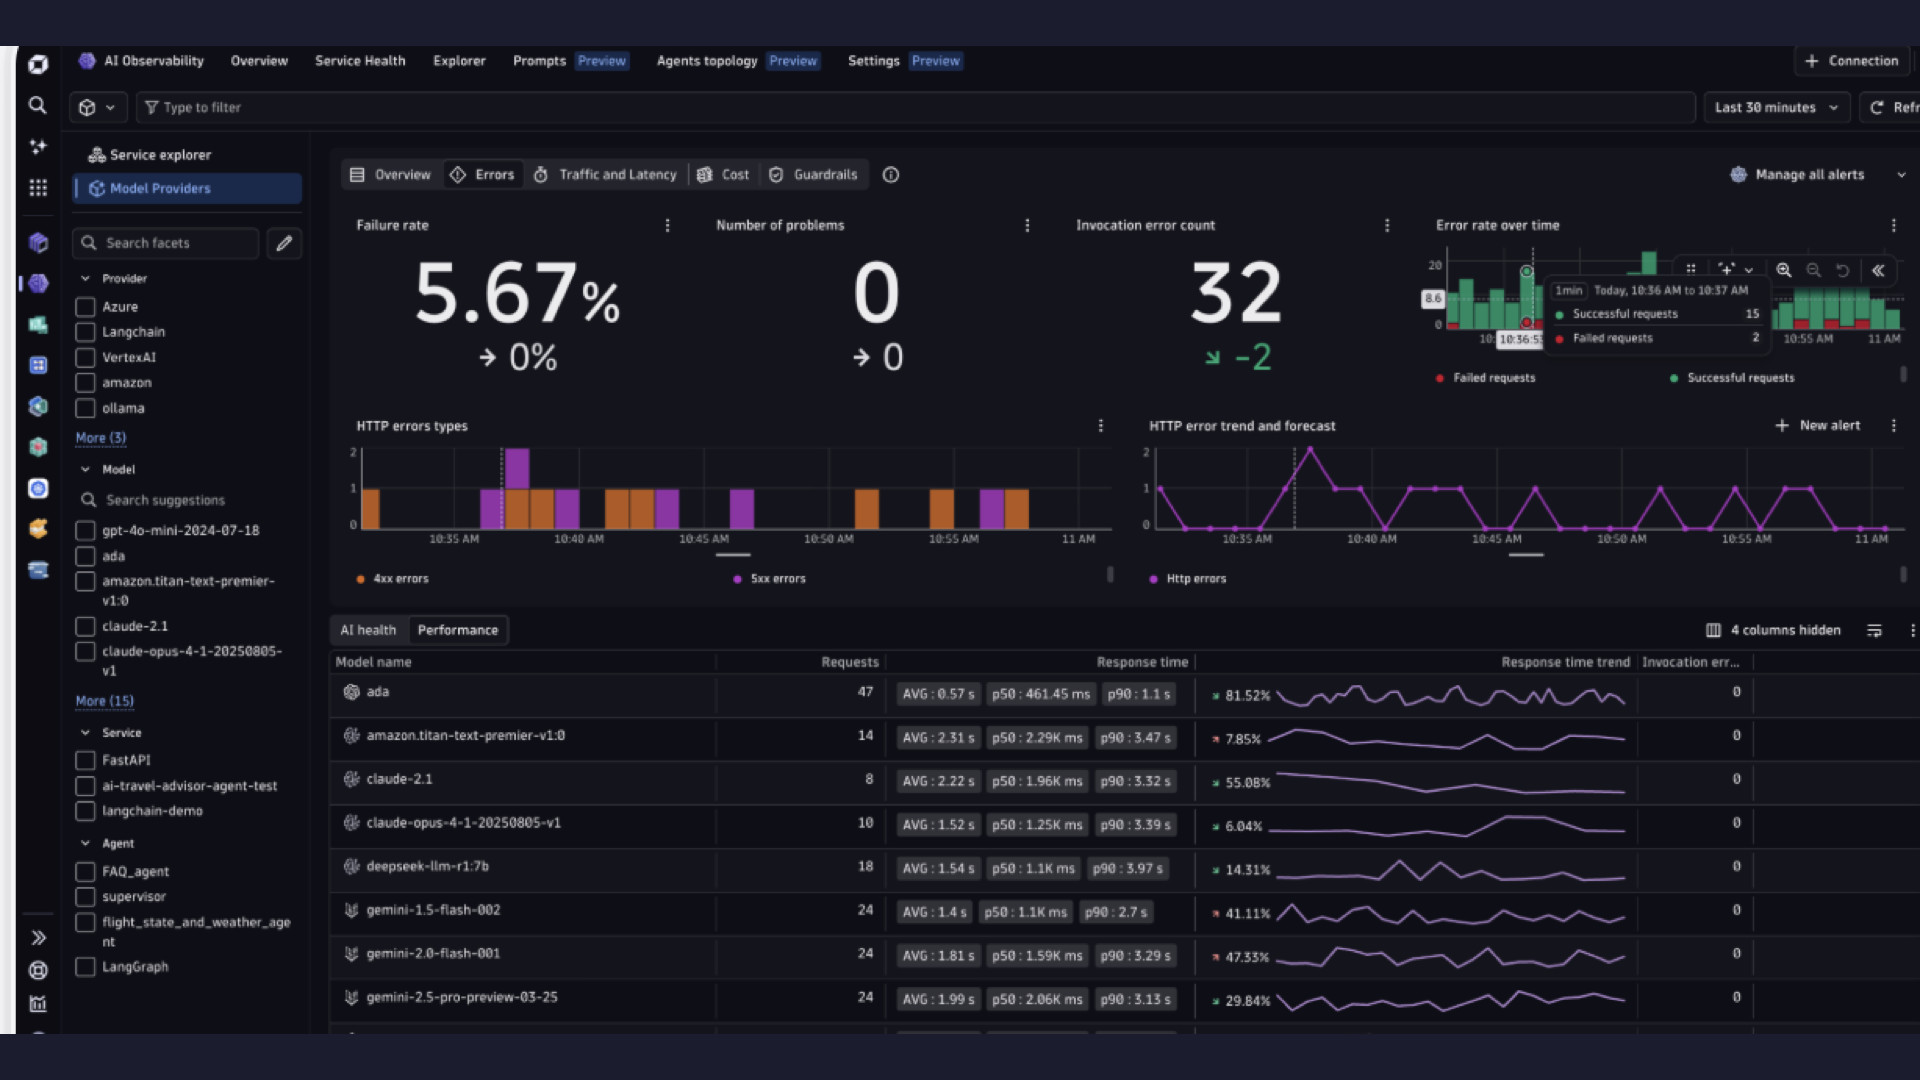
Observe your semantic cache efficiency to reduce cost and latency for LLM apps.

Technology
Free trialDocumentation
KubernetesDashboard
  • Product information

Overview

Vector databases, such as Weaviate play an important role as semantic caches within state-of-the-art Large Language Model (LLM) service stacks.

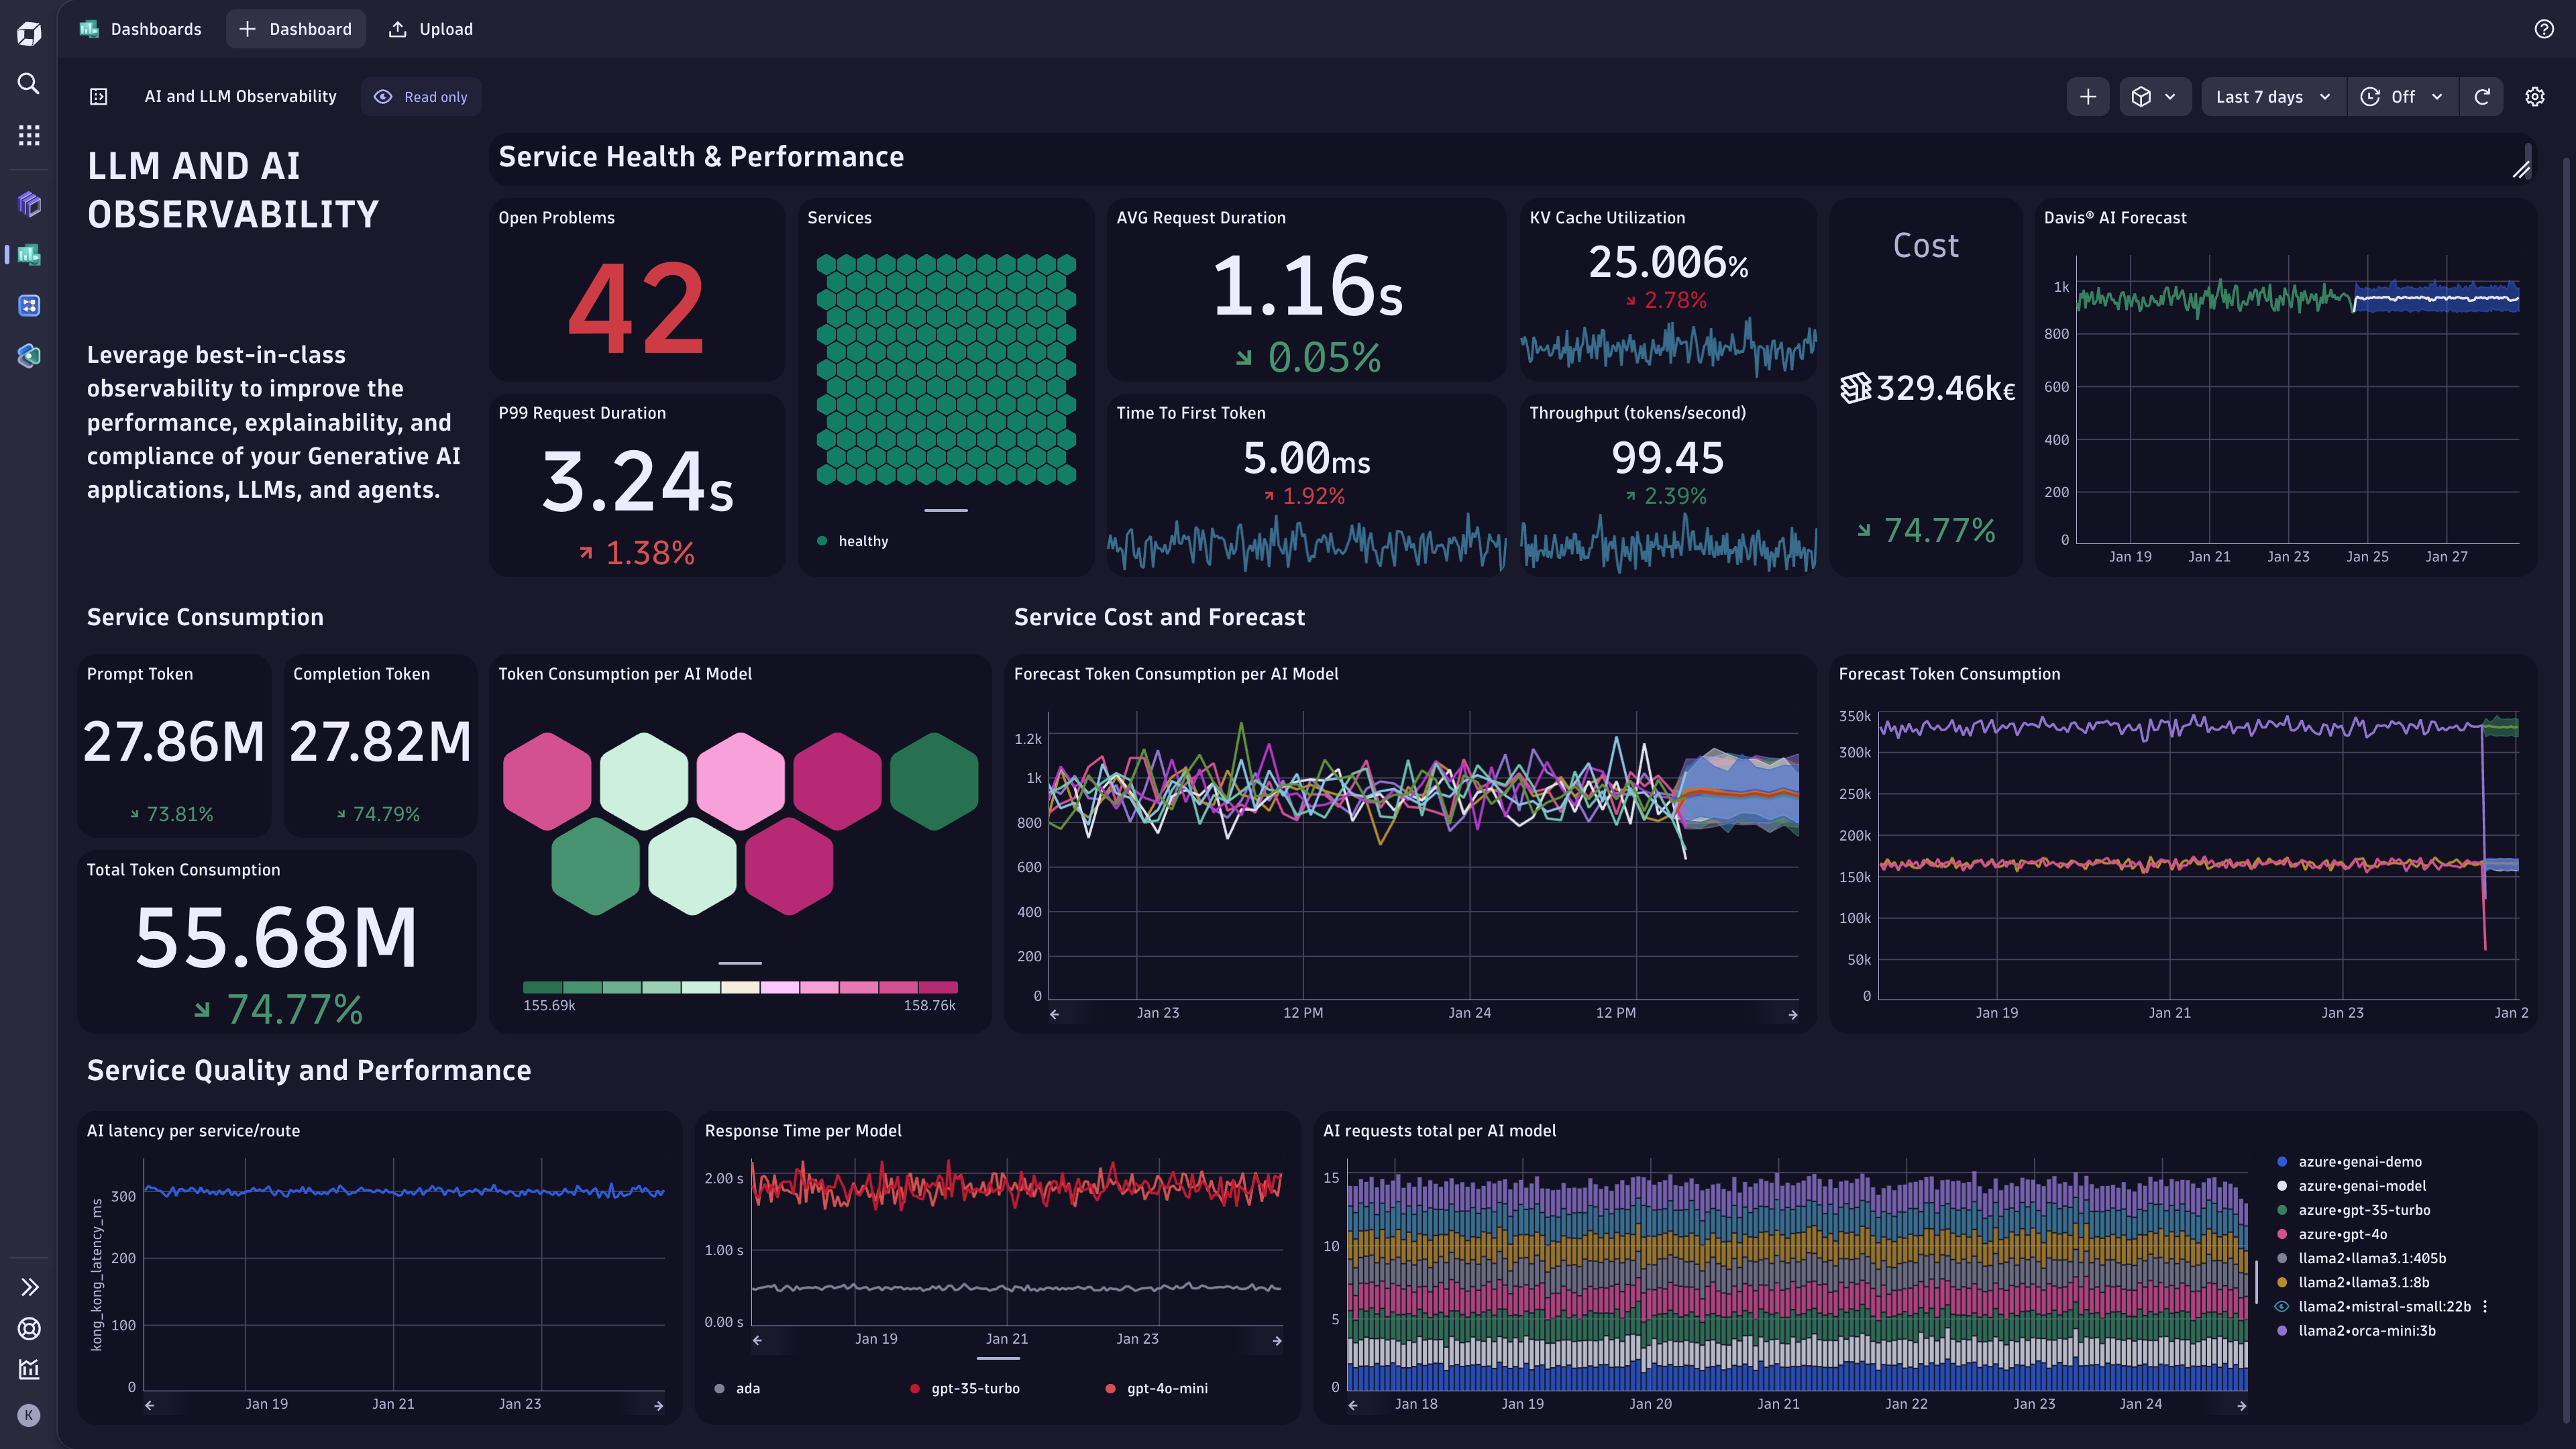
Semantic caches reduce the latency for well-known and frequent user prompts while at the same time help to reduce the overall cost of pre-trained model cloud service costs. Monitoring cache efficiency and memory utilization ensures optimal resource allocation, while adaptability to dynamic contexts measures the cache's ability to respond accurately to evolving conversation dynamics. Additionally, cache warm-up times contribute to faster availability of cached information. For vector databases, query performance and indexing speed are critical indicators, directly impacting the system's ability to handle similarity searches efficiently. Scalability, accuracy of vector representations, and storage efficiency are essential for managing growing datasets effectively. Factors such as update, and deletion performance and query throughput further contribute to the overall effectiveness of these systems in providing real-time and accurate responses in natural language processing and similarity search applications. Striking the right balance across these KPIs ensures that both semantic LLM caches and vector databases deliver optimal performance across diverse use cases. In summary, vector databases such as Weaviate aim to address performance-related challenges, enhance efficiency, and contribute to a more seamless and responsive experience in various natural language processing applications.

Get started

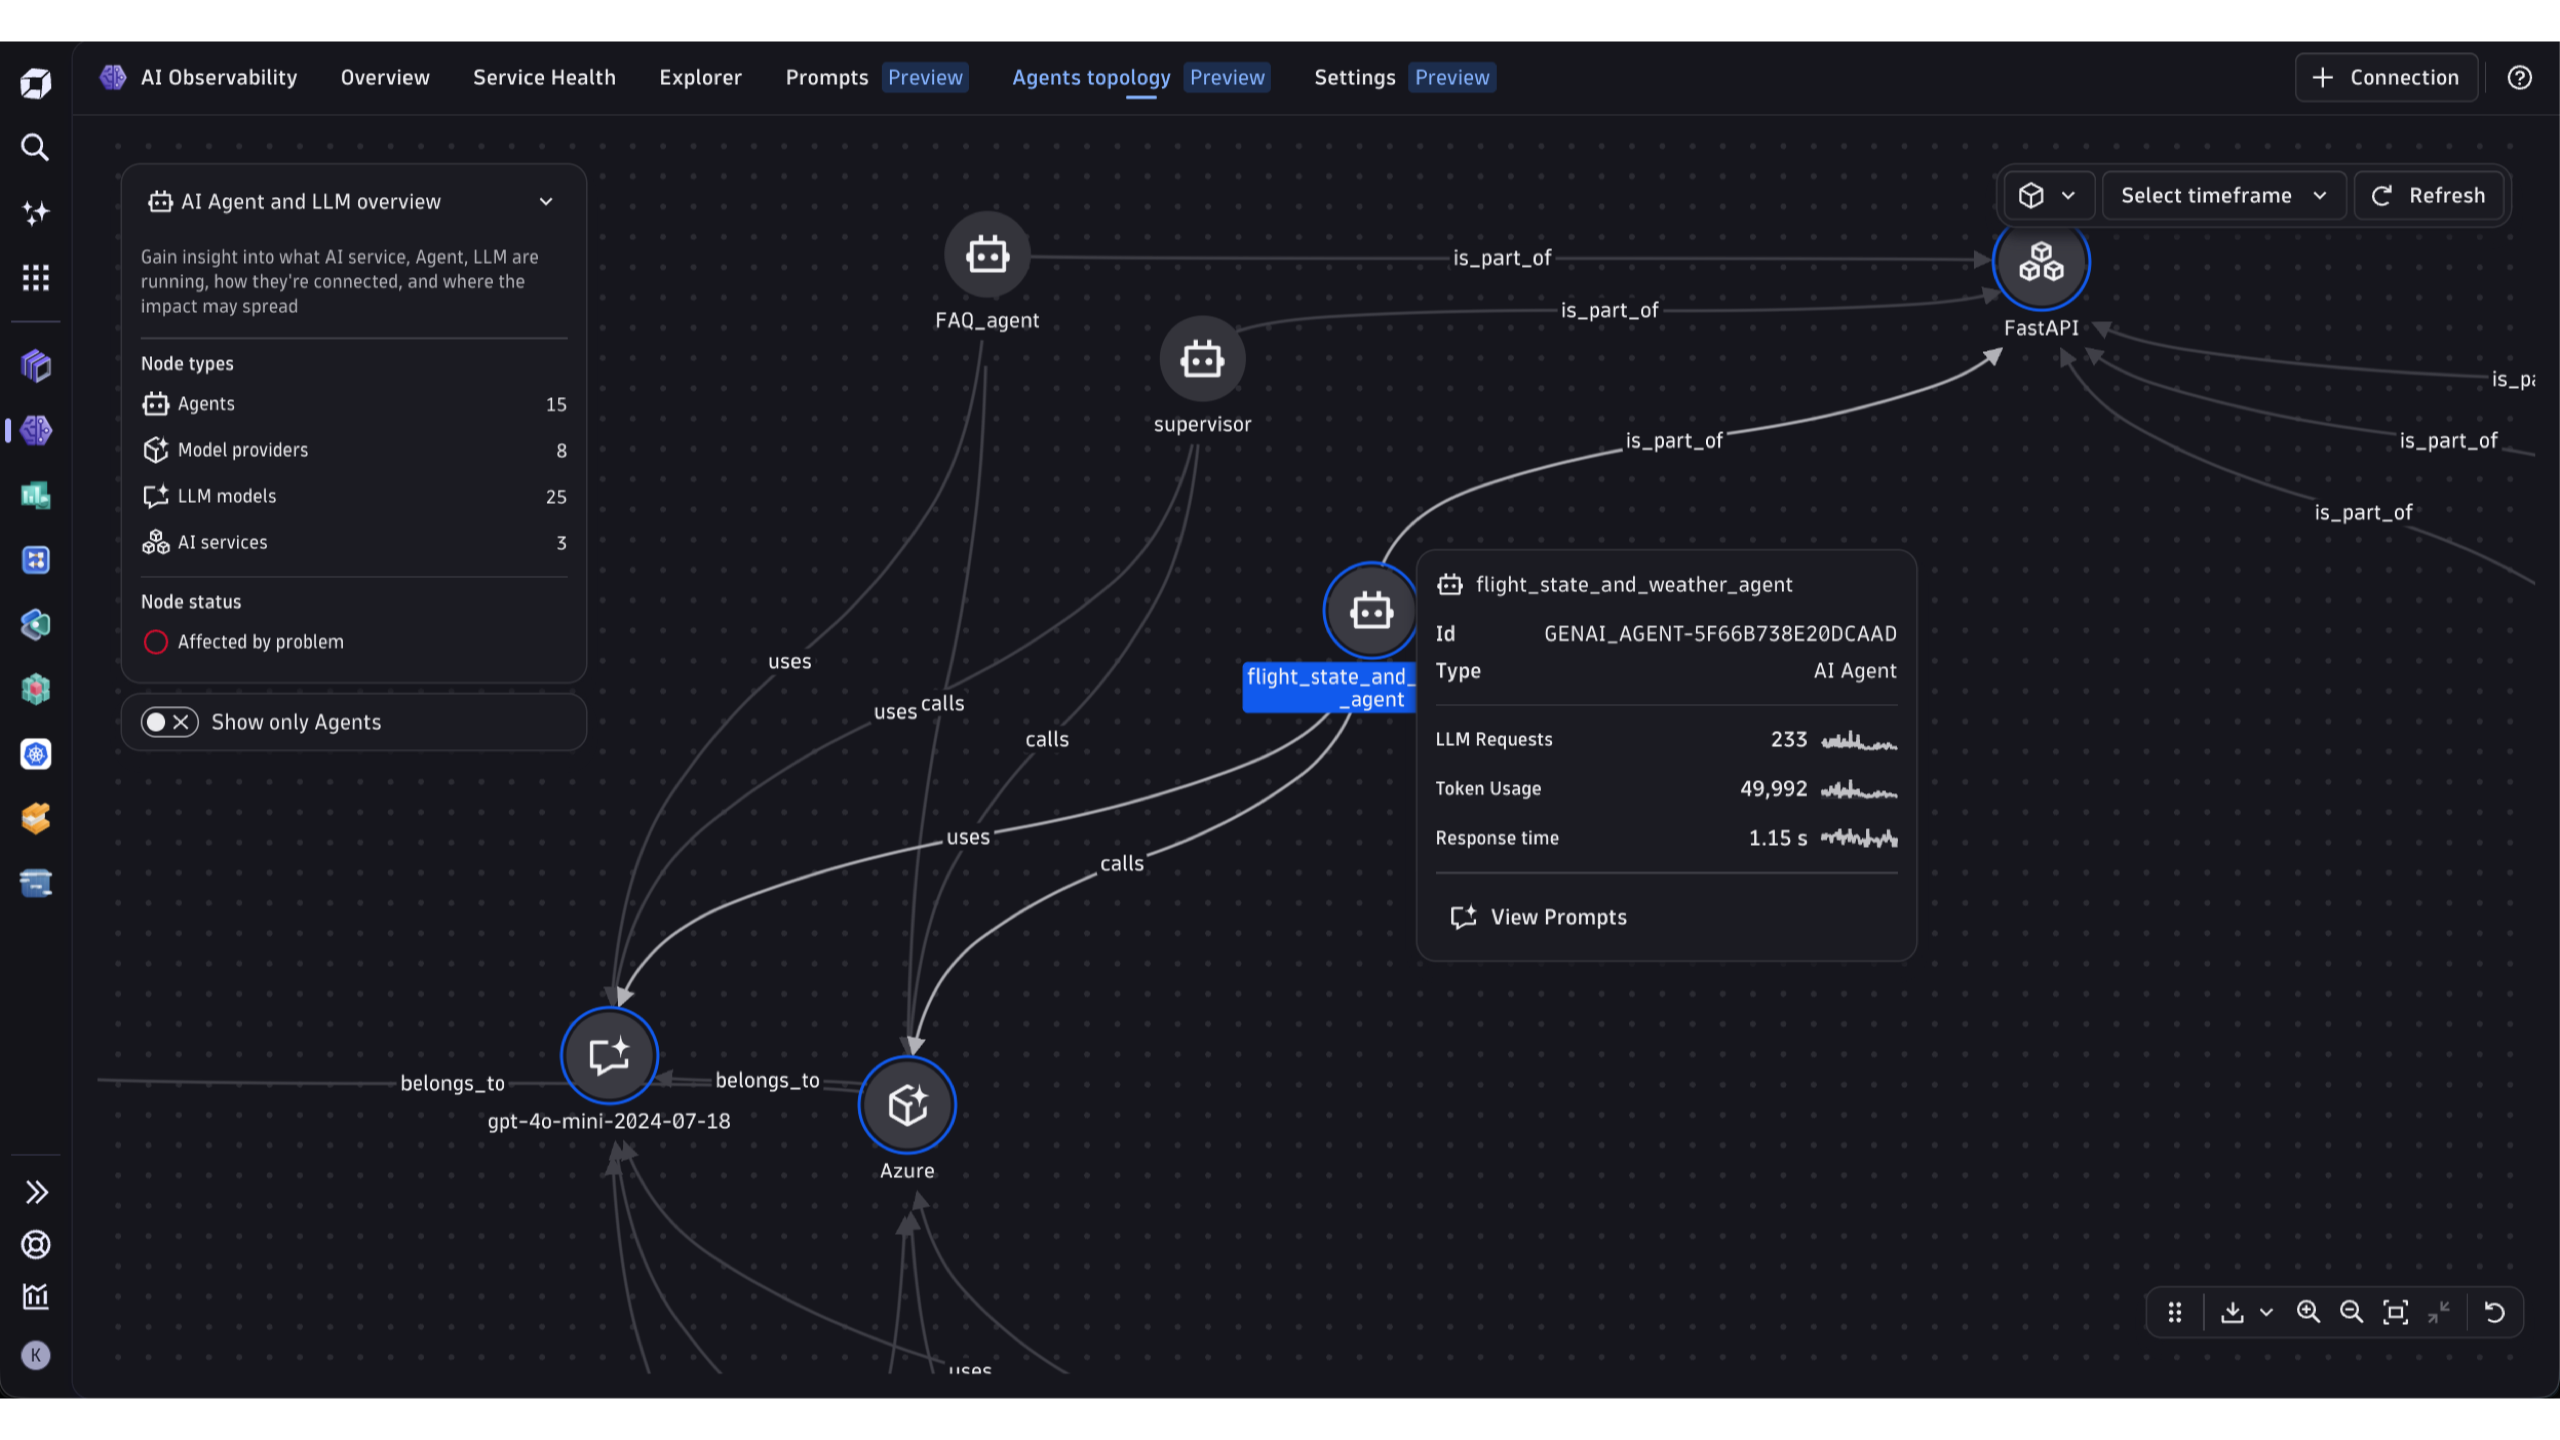
Setting up full stack observability for your GenAI applications is possible with Traceloop's OpenLLMetry, with OpenTelemetry under the hood, which can seamlessly provide comprehensive end-to-end insights into your production environments.

To set up OpenLLMetry with Dynatrace, see Dynatrace Documentation.

Details

1970 characters, under the 2000 limit. Here's the shortened version:

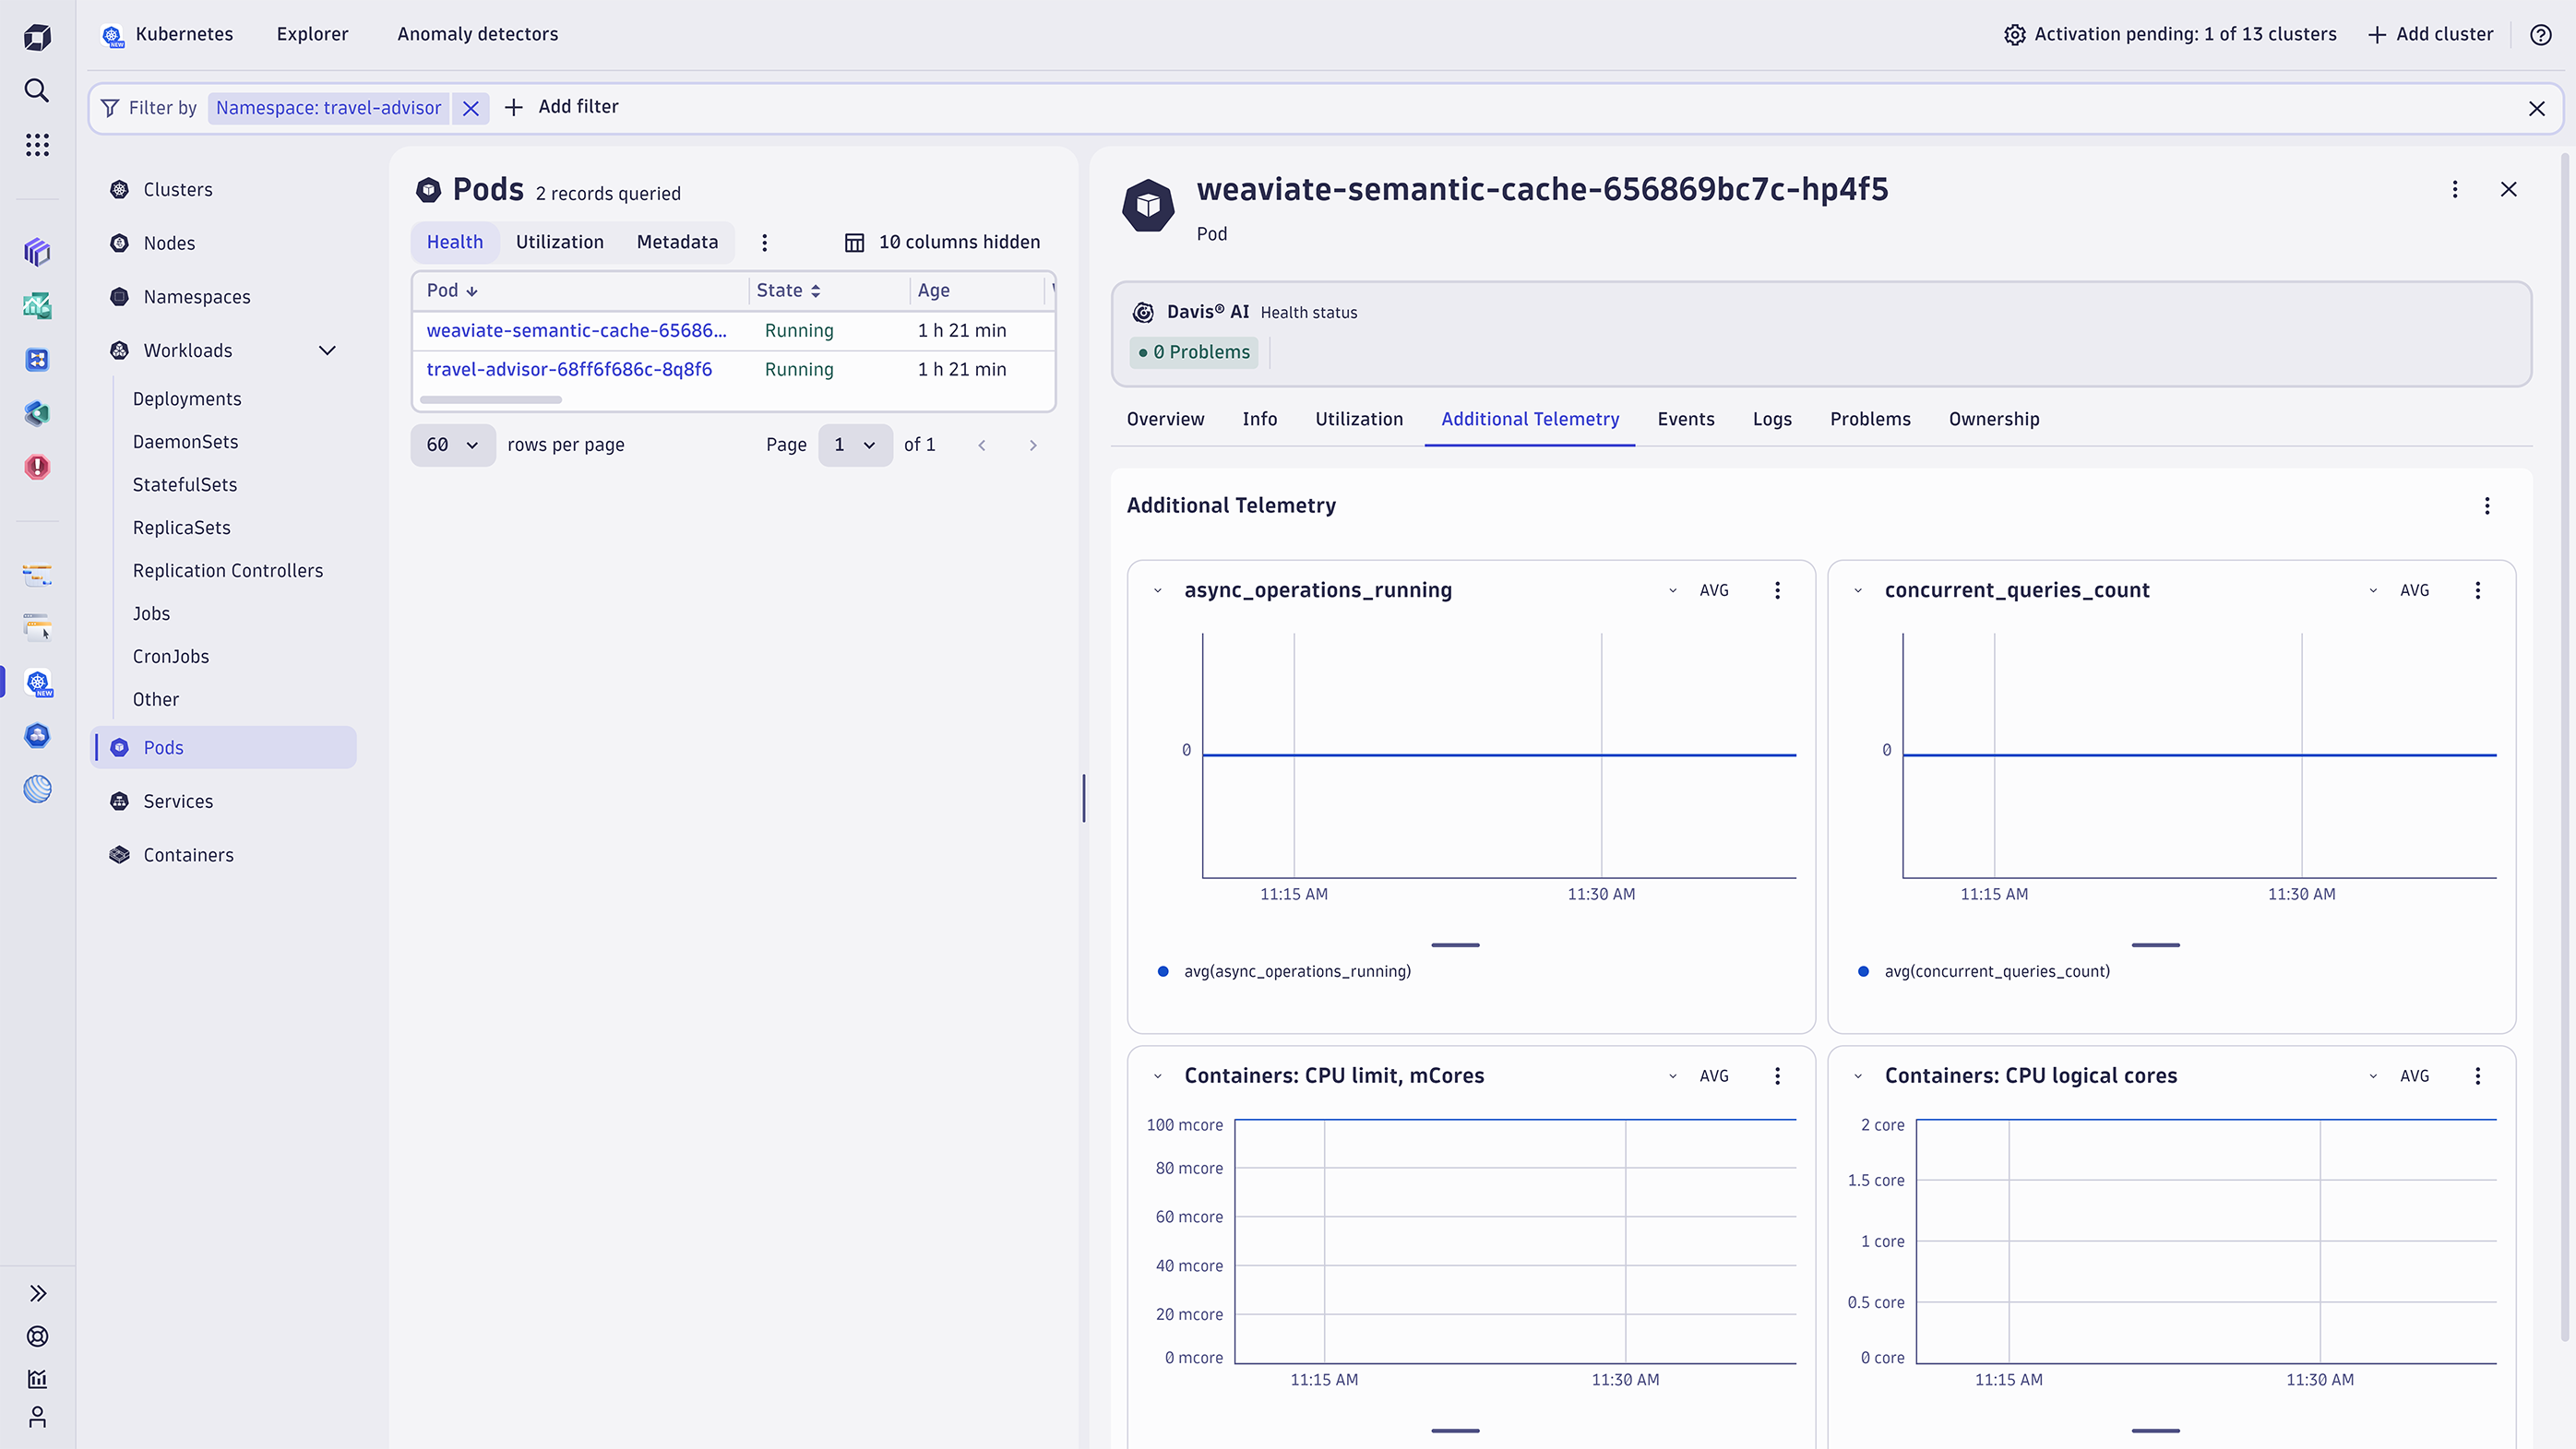
Weaviate can expose Prometheus-compatible metrics for monitoring. A standard Prometheus setup lets you visualize them on dashboards in your Dynatrace environment, covering request latencies, import speed, vector vs. object storage time, memory usage, and more.

Key metrics for observing index health and performance:

batch_durations_ms: duration of a batch operation (ms); dimensions 'operation' and 'class_name' identify the operation type and affected class. batch_delete_durations_ms: duration of batch deletions; 'operation' refines what was measured. objects_durations_ms: duration of individual operations. object_count: number of objects per object class. async_operations_running: number of running async operations, by 'operation'. lsm_active_segments: number of current segments per shard in the LSM tree. lsm_bloom_filter_duration_ms: duration of a bloom filter operation per shard (ms). lsm_segment_objects: entries per LSM segment, by level. lsm_segment_size: LSM segment size. lsm_segment_count: number of LSM segments. vector_index_tombstones: active tombstones in the vector index; rises on delete, falls after repair. vector_index_tombstone_cleanup_threads: active threads repairing/cleaning the vector index post-delete. vector_index_tombstone_cleaned: total vectors deleted and removed after repair. vector_index_operations: total mutating operations on the vector index, by 'operation'. vector_index_size: total capacity of the vector index. vector_index_maintenance_durations_ms: duration of sync/async index maintenance, by 'operation'. vector_index_durations_ms: duration of regular index operations (insert, delete), by 'operation' and 'step'. startup_durations_ms: duration of individual startup operations (ms). startup_diskio_throughput: disk I/O throughput (bytes/s) during startup, e.g. HNSW index read or LSM recovery. requests_total: tracks all user requests and whether they succeeded or failed.

Dynatrace
Documentation
By Dynatrace
Dynatrace support center
Copy to clipboard
Dynatrace Hub
Get data into DynatraceBuild your own app
Dynatrace Intelligence - Agentic Operations SystemThe Dynatrace Agentic AI ecosystem
All (931)Log Management and AnalyticsKubernetesAI and LLM ObservabilityInfrastructure ObservabilitySoftware DeliveryApplication ObservabilityApplication SecurityBusiness ObservabilityDigital Experience
Filter
Type
Built and maintained by
Partner FinderBecome a partnerDynatrace Developer

Discover recent additions to Dynatrace

Dynatrace Assist logo

Dynatrace Assist

Dynatrace Assist: Ask, analyze, and act with Dynatrace Intelligence.

Smartscape logo

Smartscape

Interactively explore and analyze topology and relationships in digital systems.

Compliance Assistant logo

Compliance Assistant

Track, manage, and automate compliance across your IT and business landscape.

Experience Vitals logo

Experience Vitals

Optimize UX with core vitals, frontend error tracking, and end-to-end visibility.

Error Inspector logo

Error Inspector

Discover, triage, and manage errors across all your frontends.

Users & Sessions logo

Users & Sessions

Replay how users experience your frontend. Analyze behavior and outcomes.

Analyze your data

Understand your data better with deep insights and clear visualizations.

Notebooks logo

Notebooks

Create powerful, data-driven documents for custom analytics and collaboration.

Dashboards logo

Dashboards

Transform complex data into clear visualizations with custom dashboards.

Investigations logo

Investigations

Fast and precise incident response on Grail data with DQL queries.

Smartscape logo

Smartscape

Interactively explore and analyze topology and relationships in digital systems.

Logs logo

Logs

Explore all your logs without writing a single query.

Problems logo

Problems

Detect, explain and triage problems automatically using Dynatrace Intelligence.

Automate your processes

Turn data and answers into actions, securely, and at scale.

Workflows logo

Workflows

Automate tasks in your IT landscape and move towards autonomous operations.

Jira logo

Jira

Open, update, and close Jira tickets automatically from Dynatrace Workflows.

Slack logo

Slack

Automate Slack messaging for security incidents, attacks, remediation, and more.

Secure your cloud application

See vulnerabilities and attacks in your environment.

Security Posture Management logo

Security Posture Management

Detect, prioritize, and remediate security and compliance findings with SPM.

Threats & Exploits logo

Threats & Exploits

Understand, triage, and investigate detection findings and alerts.

More resources

Cursor (Live-Debugger) logo

Cursor (Live-Debugger)

Get Real time Code-Level data directly to your Cursor IDE.

Documents logo

Documents

Manage Dashboards, Notebooks and other documents in your Dynatrace environment.

GitHub Copilot Coding Agent logo

GitHub Copilot Coding Agent

Automate vulnerability remediation and boost developer productivity.

GitHub Copilot Custom Agent logo

GitHub Copilot Custom Agent

Automate your development workflows with specialized agent definitions.

Dynatrace Live Debugger on JetBrains logo

Dynatrace Live Debugger on JetBrains

Get real-time code-level data directly to your Jetbrains IDE.

Metrics logo

Metrics

Browse, search, and manage all your metrics in one central catalog.

Dynatrace Live Debugger on Windsurf logo

Dynatrace Live Debugger on Windsurf

Get real-time code-level data directly to your Windsurf IDE.

Are you looking for something different?

We have hundreds of apps, extensions, and other technologies to customize your environment

Leverage our newest innovations of Dynatrace Saas

Kick-start your app creation

Kick-start your app creation

Whether you’re a beginner or a pro, Dynatrace Developer has the tools and support you need to create incredible apps with minimal effort.
Go to Dynatrace Developer
Upgrading from Dynatrace Managed to SaaS

Upgrading from Dynatrace Managed to SaaS

Drive innovation, speed, and agility in your organization by seamlessly and securely upgrading.
Learn More
Log Management and Analytics

Log Management and Analytics

Innovate faster and more efficiently with unified log management and log analytics for actionable insights and automation.
Learn more