


























Kick-start your app creation
Whether you’re a beginner or a pro, Dynatrace Developer has the tools and support you need to create incredible apps with minimal effort.
Go to Dynatrace Developer
 Varnish Cache
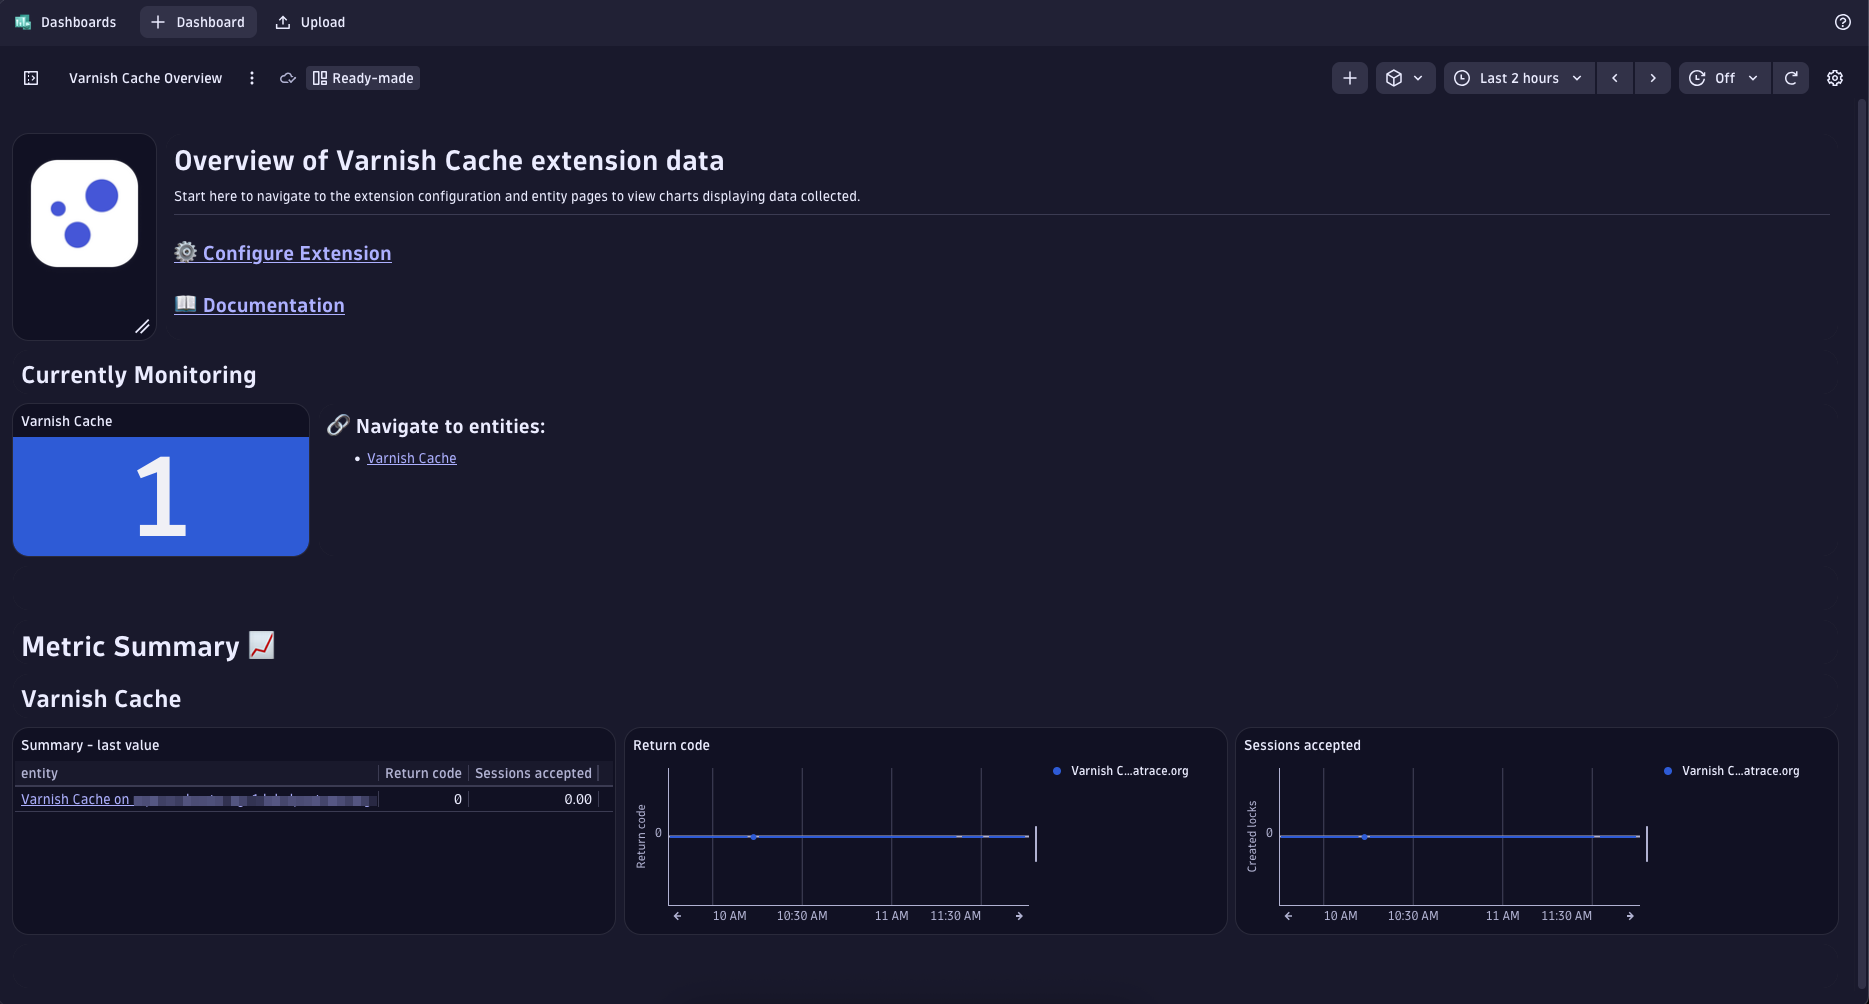
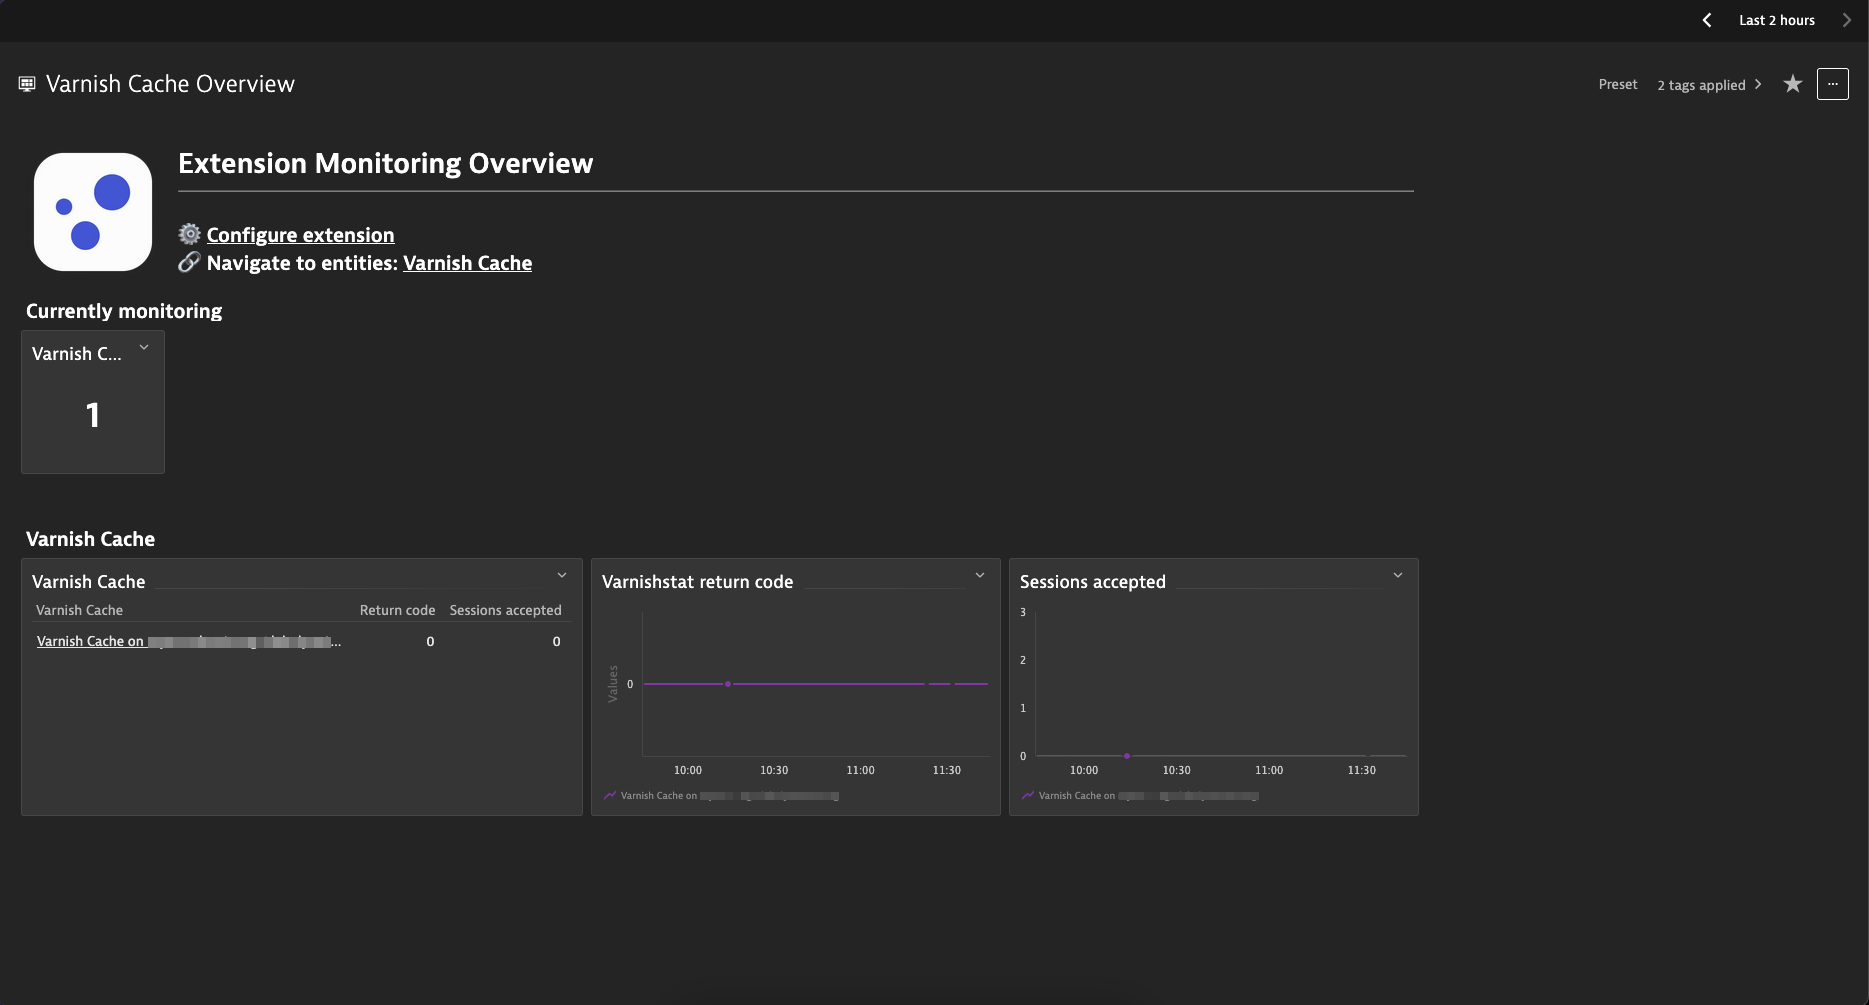
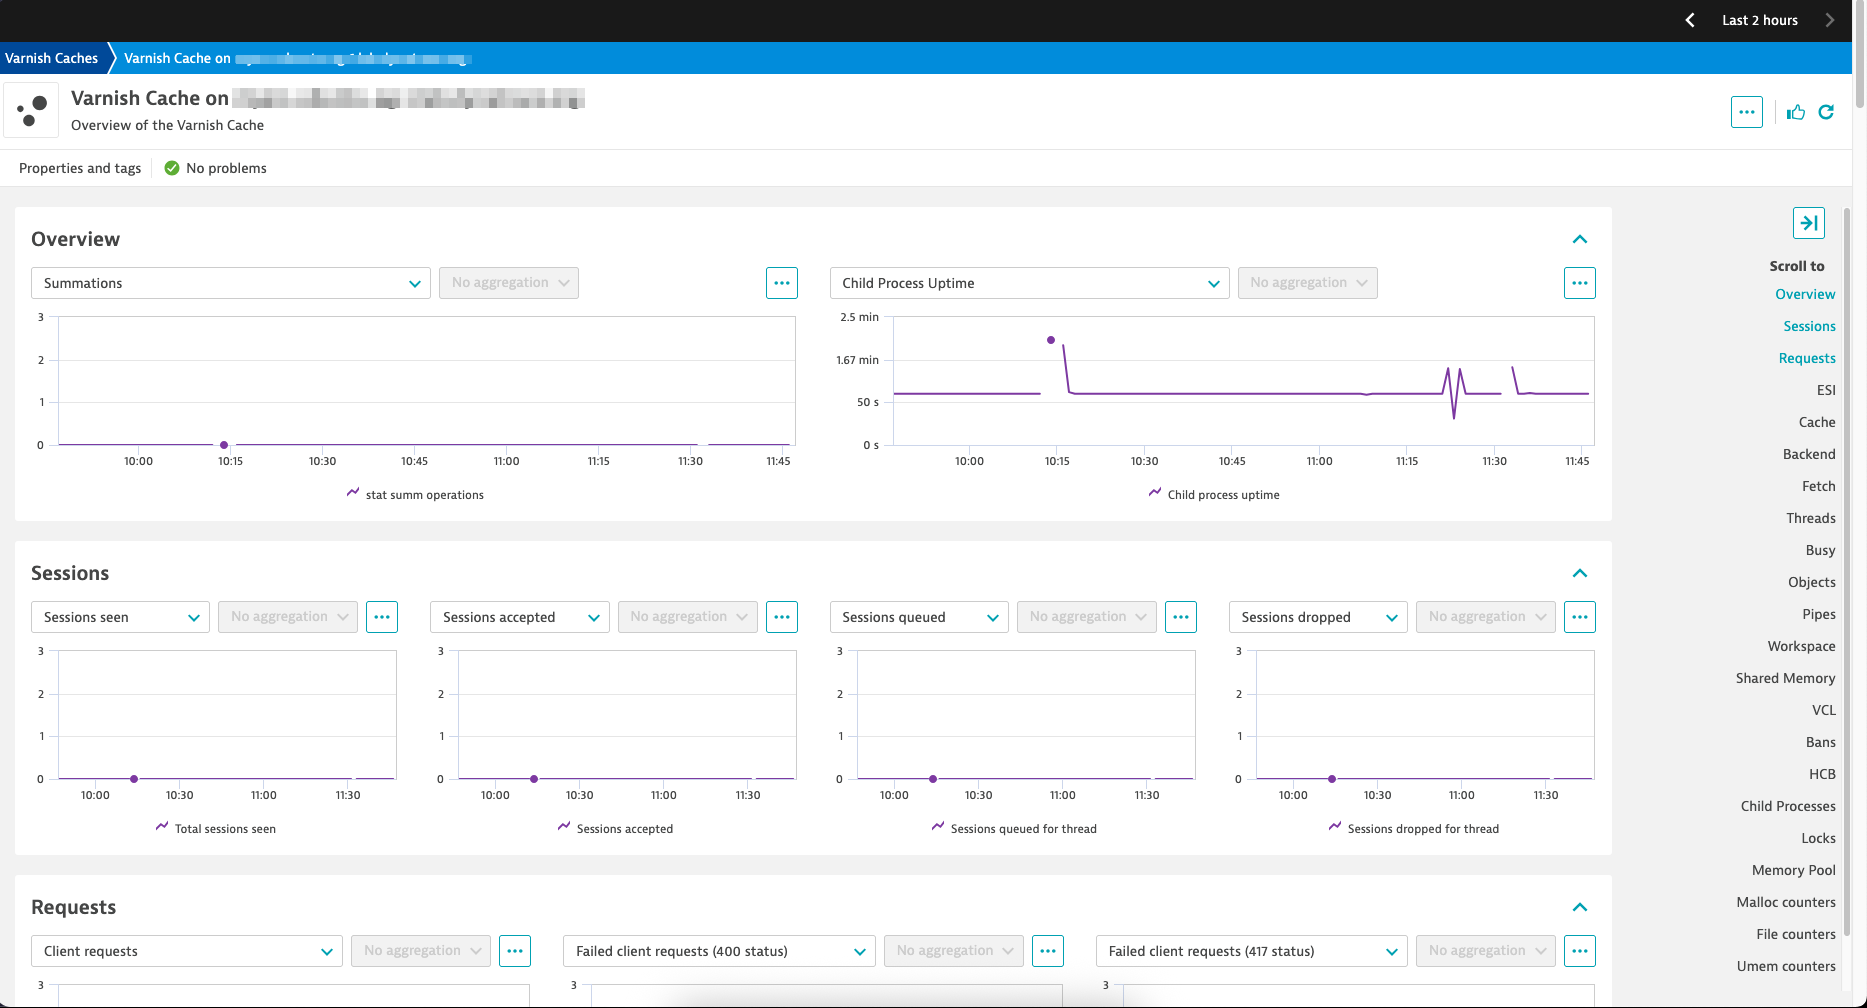
Monitor the statistics of your Varnish Cache instances.
ExtensionMonitor the statistics of Varnish Cache instances
For more information on the installation and configuration, please see Varnish Cache extension in the Dynatrace Documentation.
Varnish v. 6.2.1+
Below is a complete list of the feature sets provided in this version. To ensure a good fit for your needs, individual feature sets can be activated and deactivated by your administrator during configuration.
| Metric name | Metric key | Description | Unit |
|---|---|---|---|
| In use | varnish.cache.mempool.live | In use | Count |
| In Pool | varnish.cache.mempool.pool | In Pool | Count |
| Size requested | varnish.cache.mempool.sz_wanted | Size requested | Byte |
| Size allocated | varnish.cache.mempool.sz_actual | Size allocated | Byte |
| Allocations | varnish.cache.mempool.allocs.count | Allocations | Count |
| Frees | varnish.cache.mempool.frees.count | Frees | Count |
| Recycled from pool | varnish.cache.mempool.recycle.count | Recycled from pool | Count |
| Timed out from pool | varnish.cache.mempool.timeout.count | Timed out from pool | Count |
| Too small to recycle | varnish.cache.mempool.toosmall.count | Too small to recycle | Count |
| Too many for pool | varnish.cache.mempool.surplus.count | Too many for pool | Count |
| Pool ran dry | varnish.cache.mempool.randry.count | Pool ran dry | Count |
| Metric name | Metric key | Description | Unit |
|---|---|---|---|
| Created locks | varnish.cache.lck.creat.count | Created locks | Count |
| Destroyed locks | varnish.cache.lck.destroy.count | Destroyed locks | Count |
| Lock Operations | varnish.cache.lck.locks.count | Lock Operations | Count |
| Contended lock operations | varnish.cache.lck.dbg_busy.count | If the lck debug bit is set: Lock operations which returned EBUSY on the first locking attempt. If the lck debug bit is unset, this counter will never be incremented even if lock operations are contended. | Count |
| Contended trylock operations | varnish.cache.lck.dbg_try_fail.count | If the lck debug bit is set: Trylock operations which returned EBUSY. If the lck debug bit is unset, this counter will never be incremented even if lock operations are contended. | Count |
| Metric name | Metric key | Description | Unit |
|---|---|---|---|
| Happy health probes | varnish.cache.vbe.happy | Represents the last probe results as a bitmap. Happy probes are bits set to 1, and the unhappy ones are set to 0. The highest bits represent the oldest probes. | Unspecified |
| Request header bytes | varnish.cache.vbe.bereq_hdrbytes.count | Total backend request header bytes sent | Byte |
| Request body bytes | varnish.cache.vbe.bereq_bodybytes.count | Total backend request body bytes sent | Byte |
| Response header bytes | varnish.cache.vbe.beresp_hdrbytes.count | Total backend response header bytes received | Byte |
| Response body bytes | varnish.cache.vbe.beresp_bodybytes.count | Total backend response body bytes received | Byte |
| Pipe request header bytes | varnish.cache.vbe.pipe_hdrbytes.count | Total request bytes sent for piped sessions | Byte |
| Piped bytes to backend | varnish.cache.vbe.pipe_out.count | Total number of bytes forwarded to backend in pipe sessions | Byte |
| Piped bytes from backend | varnish.cache.vbe.pipe_in.count | Total number of bytes forwarded from backend in pipe sessions | Byte |
| Concurrent connections used | varnish.cache.vbe.conn | The number of currently used connections to the backend. This number is always less or equal to the number of connections to the backend (as, for example shown as ESTABLISHED for TCP connections in netstat) due to connection pooling. | Count |
| Backend requests sent | varnish.cache.vbe.req.count | Backend requests sent | Count |
| Fetches not attempted due to backend being unhealthy | varnish.cache.vbe.unhealthy.count | Fetches not attempted due to backend being unhealthy | Count |
| Fetches not attempted due to backend being busy | varnish.cache.vbe.busy.count | Number of times the max_connections limit was reached .. === Anything below is actually per VCP entry, but collected per === backend for simplicity | Count |
| Connections failed | varnish.cache.vbe.fail.count | Counter of failed opens. Detailed reasons are given in the fail_* counters (DIAG level) and in the log under the FetchError tag. This counter is the sum of all detailed fail_* counters. All fail_* counters may be slightly inaccurate for efficiency. | Count |
| Connections failed with EACCES or EPERM | varnish.cache.vbe.fail_eacces.count | Connections failed with EACCES or EPERM | Count |
| Connections failed with EADDRNOTAVAIL | varnish.cache.vbe.fail_eaddrnotavail.count | Connections failed with EADDRNOTAVAIL | Count |
| Connections failed with ECONNREFUSED | varnish.cache.vbe.fail_econnrefused.count | Connections failed with ECONNREFUSED | Count |
| Connections failed with ENETUNREACH | varnish.cache.vbe.fail_enetunreach.count | Connections failed with ENETUNREACH | Count |
| Connections failed ETIMEDOUT | varnish.cache.vbe.fail_etimedout.count | Connections failed ETIMEDOUT | Count |
| Connections failed for other reason | varnish.cache.vbe.fail_other.count | Connections failed for other reason | Count |
| Connection opens not attempted | varnish.cache.vbe.helddown.count | Connections not attempted during the backend_local_error_holddown or backend_remote_error_holddown interval after a fundamental connection issue. | Count |
| Metric name | Metric key | Description | Unit |
|---|---|---|---|
| Management process uptime | varnish.cache.mgt.uptime.count | Uptime in seconds of the management process | Second |
| Child process started | varnish.cache.mgt.child_start.count | Number of times the child process has been started | Count |
| Child process normal exit | varnish.cache.mgt.child_exit.count | Number of times the child process has been cleanly stopped | Count |
| Child process unexpected exit | varnish.cache.mgt.child_stop.count | Number of times the child process has exited with an unexpected return code | Count |
| Child process died (signal) | varnish.cache.mgt.child_died.count | Number of times the child process has died due to signals | Count |
| Child process core dumped | varnish.cache.mgt.child_dump.count | Number of times the child process has produced core dumps | Count |
| Child process panic | varnish.cache.mgt.child_panic.count | Number of times the management process has caught a child panic | Count |
| Metric name | Metric key | Description | Unit |
|---|---|---|---|
| Return code | varnish.cache.returncode | Return code of the varnishstat command | Unspecified |
| Metric name | Metric key | Description | Unit |
|---|---|---|---|
| Allocator requests | varnish.cache.smf.c_req.count | Number of times the storage has been asked to provide a storage segment. | Count |
| Allocator failures | varnish.cache.smf.c_fail.count | Number of times the storage has failed to provide a storage segment. | Count |
| Bytes allocated | varnish.cache.smf.c_bytes.count | Number of total bytes allocated by this storage. | Byte |
| Bytes freed | varnish.cache.smf.c_freed.count | Number of total bytes returned to this storage. | Byte |
| Allocations outstanding | varnish.cache.smf.g_alloc | Number of storage allocations outstanding. | Count |
| Bytes outstanding | varnish.cache.smf.g_bytes | Number of bytes allocated from the storage. | Byte |
| Bytes available | varnish.cache.smf.g_space | Number of bytes left in the storage. | Byte |
| N struct smf | varnish.cache.smf.g_smf | N struct smf | Count |
| N small free smf | varnish.cache.smf.g_smf_frag | N small free smf | Count |
| N large free smf | varnish.cache.smf.g_smf_large | N large free smf | Count |
| Metric name | Metric key | Description | Unit |
|---|---|---|---|
| Allocator requests | varnish.cache.smu.c_req.count | Number of times the storage has been asked to provide a storage segment. | Count |
| Allocator failures | varnish.cache.smu.c_fail.count | Number of times the storage has failed to provide a storage segment. | Count |
| Bytes allocated | varnish.cache.smu.c_bytes.count | Number of total bytes allocated by this storage. | Byte |
| Bytes freed | varnish.cache.smu.c_freed.count | Number of total bytes returned to this storage. | Byte |
| Allocations outstanding | varnish.cache.smu.g_alloc | Number of storage allocations outstanding. | Count |
| Bytes outstanding | varnish.cache.smu.g_bytes | Number of bytes allocated from the storage. | Byte |
| Bytes available | varnish.cache.smu.g_space | Number of bytes left in the storage. | Byte |
| Metric name | Metric key | Description | Unit |
|---|---|---|---|
| Allocator requests | varnish.cache.sma.c_req.count | Number of times the storage has been asked to provide a storage segment. | Count |
| Allocator failures | varnish.cache.sma.c_fail.count | Number of times the storage has failed to provide a storage segment. | Count |
| Bytes allocated | varnish.cache.sma.c_bytes.count | Number of total bytes allocated by this storage. | Byte |
| Bytes freed | varnish.cache.sma.c_freed.count | Number of total bytes returned to this storage. | Byte |
| Allocations outstanding | varnish.cache.sma.g_alloc | Number of storage allocations outstanding. | Count |
| Bytes outstanding | varnish.cache.sma.g_bytes | Number of bytes allocated from the storage. | Byte |
| Bytes available | varnish.cache.sma.g_space | Number of bytes left in the storage. | Byte |
| Metric name | Metric key | Description | Unit |
|---|---|---|---|
| stat summ operations | varnish.cache.main.summs.count | Number of times per-thread statistics were summed into the global counters. | Count |
| Child process uptime | varnish.cache.main.uptime.count | How long the child process has been running. | Second |
| Sessions accepted | varnish.cache.main.sess_conn.count | Count of sessions successfully accepted | Count |
| Session accept failures | varnish.cache.main.sess_fail.count | Count of failures to accept TCP connection. This counter is the sum of the sess_fail_* counters, which give more detailed information. | Count |
| Session accept failures: connection aborted | varnish.cache.main.sess_fail_econnaborted.count | Detailed reason for sess_fail: Connection aborted by the client, usually harmless. | Count |
| Session accept failures: interrupted system call | varnish.cache.main.sess_fail_eintr.count | Detailed reason for sess_fail: The accept() call was interrupted, usually harmless | Count |
| Session accept failures: too many open files | varnish.cache.main.sess_fail_emfile.count | Detailed reason for sess_fail: No file descriptor was available. Consider raising RLIMIT_NOFILE (see ulimit -n). | Count |
| Session accept failures: bad file descriptor | varnish.cache.main.sess_fail_ebadf.count | Detailed reason for sess_fail: The listen socket file descriptor was invalid. Should never happen. | Count |
| Session accept failures: not enough memory | varnish.cache.main.sess_fail_enomem.count | Detailed reason for sess_fail: Most likely insufficient socket buffer memory. Should never happen | Count |
| Session accept failures: other | varnish.cache.main.sess_fail_other.count | Detailed reason for sess_fail: neither of the above, see SessError log (varnishlog -g raw -i SessError). | Count |
| Client requests received, subject to 400 errors | varnish.cache.main.client_req_400.count | 400 means we couldn't make sense of the request, it was malformed in some drastic way. | Count |
| Client requests received, subject to 417 errors | varnish.cache.main.client_req_417.count | 417 means that something went wrong with an Expect: header. | Count |
| Good client requests received | varnish.cache.main.client_req.count | The count of parseable client requests seen. | Count |
| ESI subrequests | varnish.cache.main.esi_req.count | Number of ESI subrequests made. | Count |
| Cache hits | varnish.cache.main.cache_hit.count | Count of cache hits. A cache hit indicates that an object has been delivered to a client without fetching it from a backend server. | Count |
| Cache grace hits | varnish.cache.main.cache_hit_grace.count | Count of cache hits with grace. A cache hit with grace is a cache hit where the object is expired. Note that such hits are also included in the cache_hit counter. | Count |
| Cache hits for pass. | varnish.cache.main.cache_hitpass.count | Count of hits for pass. A cache hit for pass indicates that Varnish is going to pass the request to the backend and this decision has been cached in it self. This counts how many times the cached decision is being used. | Count |
| Cache hits for miss. | varnish.cache.main.cache_hitmiss.count | Count of hits for miss. A cache hit for miss indicates that Varnish is going to proceed as for a cache miss without request coalescing, and this decision has been cached. This counts how many times the cached decision is being used. | Count |
| Cache misses | varnish.cache.main.cache_miss.count | Count of misses. A cache miss indicates the object was fetched from the backend before delivering it to the client. | Count |
| Uncacheable backend responses | varnish.cache.main.beresp_uncacheable.count | Count of backend responses considered uncacheable. | Count |
| Shortlived objects | varnish.cache.main.beresp_shortlived.count | Count of objects created with ttl+grace+keep shorter than the 'shortlived' runtime parameter. | Count |
| Backend conn. success | varnish.cache.main.backend_conn.count | How many backend connections have successfully been established. | Count |
| Backend conn. not attempted | varnish.cache.main.backend_unhealthy.count | Backend conn. not attempted | Count |
| Backend conn. too many | varnish.cache.main.backend_busy.count | Backend conn. too many | Count |
| Backend conn. failures | varnish.cache.main.backend_fail.count | Backend conn. failures | Count |
| Backend conn. reuses | varnish.cache.main.backend_reuse.count | Count of backend connection reuses. This counter is increased whenever we reuse a recycled connection. | Count |
| Backend conn. recycles | varnish.cache.main.backend_recycle.count | Count of backend connection recycles. This counter is increased whenever we have a keep-alive connection that is put back into the pool of connections. It has not yet been used, but it might be, unless the backend closes it. | Count |
| Backend conn. retry | varnish.cache.main.backend_retry.count | Backend conn. retry | Count |
| Fetch no body (HEAD) | varnish.cache.main.fetch_head.count | beresp with no body because the request is HEAD. | Count |
| Fetch with Length | varnish.cache.main.fetch_length.count | beresp.body with Content-Length. | Count |
| Fetch chunked | varnish.cache.main.fetch_chunked.count | beresp.body with Chunked. | Count |
| Fetch EOF | varnish.cache.main.fetch_eof.count | beresp.body with EOF. | Count |
| Fetch bad T-E | varnish.cache.main.fetch_bad.count | beresp.body length/fetch could not be determined. | Count |
| Fetch no body | varnish.cache.main.fetch_none.count | beresp.body empty | Count |
| Fetch no body (1xx) | varnish.cache.main.fetch_1xx.count | beresp with no body because of 1XX response. | Count |
| Fetch no body (204) | varnish.cache.main.fetch_204.count | beresp with no body because of 204 response. | Count |
| Fetch no body (304) | varnish.cache.main.fetch_304.count | beresp with no body because of 304 response. | Count |
| Fetch failed (all causes) | varnish.cache.main.fetch_failed.count | beresp fetch failed. | Count |
| Background fetch failed (no thread) | varnish.cache.main.bgfetch_no_thread.count | A bgfetch triggered by a grace hit failed, no thread available. | Count |
| Number of thread pools | varnish.cache.main.pools | Number of thread pools. See also parameter thread_pools. NB: Presently pools cannot be removed once created. | Count |
| Total number of threads | varnish.cache.main.threads | Number of threads in all pools. See also parameters thread_pools, thread_pool_min and thread_pool_max. | Count |
| Threads hit max | varnish.cache.main.threads_limited.count | Number of times more threads were needed, but limit was reached in a thread pool. See also parameter thread_pool_max. | Count |
| Threads created | varnish.cache.main.threads_created.count | Total number of threads created in all pools. | Count |
| Threads destroyed | varnish.cache.main.threads_destroyed.count | Total number of threads destroyed in all pools. | Count |
| Thread creation failed | varnish.cache.main.threads_failed.count | Number of times creating a thread failed. See VSL::Debug for diagnostics. See also parameter thread_fail_delay. | Count |
| Length of session queue | varnish.cache.main.thread_queue_len | Length of session queue waiting for threads. NB: Only updates once per second. See also parameter thread_queue_limit. | Count |
| Number of requests sent to sleep on busy objhdr | varnish.cache.main.busy_sleep.count | Number of requests sent to sleep without a worker thread because they found a busy object. | Count |
| Number of requests woken after sleep on busy objhdr | varnish.cache.main.busy_wakeup.count | Number of requests taken off the busy object sleep list and rescheduled. | Count |
| Number of requests killed after sleep on busy objhdr | varnish.cache.main.busy_killed.count | Number of requests killed from the busy object sleep list due to lack of resources. | Count |
| Sessions queued for thread | varnish.cache.main.sess_queued.count | Number of times session was queued waiting for a thread. See also parameter thread_queue_limit. | Count |
| Sessions dropped for thread | varnish.cache.main.sess_dropped.count | Number of times an HTTP/1 session was dropped because the queue was too long already. See also parameter thread_queue_limit. | Count |
| Requests dropped | varnish.cache.main.req_dropped.count | Number of times an HTTP/2 stream was refused because the queue was too long already. See also parameter thread_queue_limit. | Count |
| object structs made | varnish.cache.main.n_object | Approximate number of HTTP objects (headers + body, if present) in the cache. | Count |
| unresurrected objects | varnish.cache.main.n_vampireobject | Number of unresurrected objects | Count |
| objectcore structs made | varnish.cache.main.n_objectcore | Approximate number of object metadata elements in the cache. Each object needs an objectcore, extra objectcores are for hit-for-miss, hit-for-pass and busy objects. | Count |
| objecthead structs made | varnish.cache.main.n_objecthead | Approximate number of different hash entries in the cache. | Count |
| Number of backends | varnish.cache.main.n_backend | Number of backends known to us. | Count |
| Number of expired objects | varnish.cache.main.n_expired.count | Number of objects that expired from cache because of old age. | Count |
| Number of LRU nuked objects | varnish.cache.main.n_lru_nuked.count | How many objects have been forcefully evicted from storage to make room for a new object. | Count |
| Number of LRU moved objects | varnish.cache.main.n_lru_moved.count | Number of move operations done on the LRU list. | Count |
| Reached nuke_limit | varnish.cache.main.n_lru_limited.count | Number of times more storage space were needed, but limit was reached in a nuke_limit. See also parameter nuke_limit. | Count |
| HTTP header overflows | varnish.cache.main.losthdr.count | HTTP header overflows | Count |
| Total sessions seen | varnish.cache.main.s_sess.count | Total sessions seen | Count |
| Number of ongoing pipe sessions | varnish.cache.main.n_pipe | Number of ongoing pipe sessions | Count |
| Pipes hit pipe_sess_max | varnish.cache.main.pipe_limited.count | Number of times more pipes were needed, but the limit was reached. See also parameter pipe_sess_max. | Count |
| Total pipe sessions seen | varnish.cache.main.s_pipe.count | Total pipe sessions seen | Count |
| Total pass-ed requests seen | varnish.cache.main.s_pass.count | Total pass-ed requests seen | Count |
| Total backend fetches initiated | varnish.cache.main.s_fetch.count | Total backend fetches initiated, including background fetches. | Count |
| Total backend background fetches initiated | varnish.cache.main.s_bgfetch.count | Total backend background fetches initiated | Count |
| Total synthetic responses made | varnish.cache.main.s_synth.count | Total synthetic responses made | Count |
| Request header bytes | varnish.cache.main.s_req_hdrbytes.count | Total request header bytes received | Byte |
| Request body bytes | varnish.cache.main.s_req_bodybytes.count | Total request body bytes received | Byte |
| Response header bytes | varnish.cache.main.s_resp_hdrbytes.count | Total response header bytes transmitted | Byte |
| Response body bytes | varnish.cache.main.s_resp_bodybytes.count | Total response body bytes transmitted | Byte |
| Pipe request header bytes | varnish.cache.main.s_pipe_hdrbytes.count | Total request bytes received for piped sessions | Byte |
| Piped bytes from client | varnish.cache.main.s_pipe_in.count | Total number of bytes forwarded from clients in pipe sessions | Byte |
| Piped bytes to client | varnish.cache.main.s_pipe_out.count | Total number of bytes forwarded to clients in pipe sessions | Byte |
| Session Closed | varnish.cache.main.sess_closed.count | Session Closed | Count |
| Session Closed with error | varnish.cache.main.sess_closed_err.count | Total number of sessions closed with errors. See sc_* diag counters for detailed breakdown | Count |
| Session Read Ahead | varnish.cache.main.sess_readahead.count | Session Read Ahead | Count |
| Session herd | varnish.cache.main.sess_herd.count | Number of times the timeout_linger triggered | Count |
| Session OK REM_CLOSE | varnish.cache.main.sc_rem_close.count | Number of session closes with REM_CLOSE (Client Closed) | Count |
| Session OK REQ_CLOSE | varnish.cache.main.sc_req_close.count | Number of session closes with REQ_CLOSE (Client requested close) | Count |
| Session Err REQ_HTTP10 | varnish.cache.main.sc_req_http10.count | Number of session closes with Error REQ_HTTP10 (Proto < HTTP/1.1) | Count |
| Session Err RX_BAD | varnish.cache.main.sc_rx_bad.count | Number of session closes with Error RX_BAD (Received bad req/resp) | Count |
| Session Err RX_BODY | varnish.cache.main.sc_rx_body.count | Number of session closes with Error RX_BODY (Failure receiving req.body) | Count |
| Session Err RX_JUNK | varnish.cache.main.sc_rx_junk.count | Number of session closes with Error RX_JUNK (Received junk data) | Count |
| Session Err RX_OVERFLOW | varnish.cache.main.sc_rx_overflow.count | Number of session closes with Error RX_OVERFLOW (Received buffer overflow) | Count |
| Session Err RX_TIMEOUT | varnish.cache.main.sc_rx_timeout.count | Number of session closes with Error RX_TIMEOUT (Receive timeout) | Count |
| Session Err RX_CLOSE_IDLE | varnish.cache.main.sc_rx_close_idle.count | Number of session closes with Error RX_CLOSE_IDLE: timeout_idle has been exceeded while waiting for a client request. | Count |
| Session OK TX_PIPE | varnish.cache.main.sc_tx_pipe.count | Number of session closes with TX_PIPE (Piped transaction) | Count |
| Session Err TX_ERROR | varnish.cache.main.sc_tx_error.count | Number of session closes with Error TX_ERROR (Error transaction) | Count |
| Session OK TX_EOF | varnish.cache.main.sc_tx_eof.count | Number of session closes with TX_EOF (EOF transmission) | Count |
| Session OK RESP_CLOSE | varnish.cache.main.sc_resp_close.count | Number of session closes with RESP_CLOSE (Backend/VCL requested close) | Count |
| Session Err OVERLOAD | varnish.cache.main.sc_overload.count | Number of session closes with Error OVERLOAD (Out of some resource) | Count |
| Session Err PIPE_OVERFLOW | varnish.cache.main.sc_pipe_overflow.count | Number of session closes with Error PIPE_OVERFLOW (Session pipe overflow) | Count |
| Session Err RANGE_SHORT | varnish.cache.main.sc_range_short.count | Number of session closes with Error RANGE_SHORT (Insufficient data for range) | Count |
| Session Err REQ_HTTP20 | varnish.cache.main.sc_req_http20.count | Number of session closes with Error REQ_HTTP20 (HTTP2 not accepted) | Count |
| Session Err VCL_FAILURE | varnish.cache.main.sc_vcl_failure.count | Number of session closes with Error VCL_FAILURE (VCL failure) | Count |
| Delivery failed due to insufficient workspace. | varnish.cache.main.client_resp_500.count | Number of times we failed a response due to running out of workspace memory during delivery. | Count |
| workspace_backend overflows | varnish.cache.main.ws_backend_overflow.count | Number of times we ran out of space in workspace_backend. | Count |
| workspace_client overflows | varnish.cache.main.ws_client_overflow.count | Number of times we ran out of space in workspace_client. | Count |
| workspace_thread overflows | varnish.cache.main.ws_thread_overflow.count | Number of times we ran out of space in workspace_thread. | Count |
| workspace_session overflows | varnish.cache.main.ws_session_overflow.count | Number of times we ran out of space in workspace_session. | Count |
| SHM records | varnish.cache.main.shm_records.count | Number of log records written to the shared memory log. | Count |
| SHM writes | varnish.cache.main.shm_writes.count | Number of individual writes to the shared memory log. A single write may batch multiple records for bufferred tasks. | Count |
| SHM flushes due to overflow | varnish.cache.main.shm_flushes.count | Number of writes performed before the end of a bufferred task because adding a record to a batch would exceed vsl_buffer. | Count |
| SHM lock contention | varnish.cache.main.shm_cont.count | Number of times a write had to wait for the lock. | Count |
| SHM cycles through VSL space | varnish.cache.main.shm_cycles.count | Number of times a write of log records would reach past the end of the shared memory log, cycling back to the beginning. | Count |
| SHM bytes | varnish.cache.main.shm_bytes.count | Number of bytes written to the shared memory log. | Byte |
| Backend requests made | varnish.cache.main.backend_req.count | Backend requests made | Count |
| Number of loaded VCLs in total | varnish.cache.main.n_vcl | Number of loaded VCLs in total | Count |
| Number of VCLs available | varnish.cache.main.n_vcl_avail | Number of VCLs available | Count |
| Number of discarded VCLs | varnish.cache.main.n_vcl_discard | Number of discarded VCLs | Count |
| VCL failures | varnish.cache.main.vcl_fail.count | Count of failures which prevented VCL from completing. | Count |
| Count of bans | varnish.cache.main.bans | Number of all bans in system, including bans superseded by newer bans and bans already checked by the ban-lurker. | Count |
| Number of bans marked 'completed' | varnish.cache.main.bans_completed | Number of bans which are no longer active, either because they got checked by the ban-lurker or superseded by newer identical bans. | Count |
| Number of bans using obj.* | varnish.cache.main.bans_obj | Number of bans which use obj.* variables. These bans can possibly be washed by the ban-lurker. | Count |
| Number of bans using req.* | varnish.cache.main.bans_req | Number of bans which use req.* variables. These bans can not be washed by the ban-lurker. | Count |
| Bans added | varnish.cache.main.bans_added.count | Counter of bans added to ban list. | Count |
| Bans deleted | varnish.cache.main.bans_deleted.count | Counter of bans deleted from ban list. | Count |
| Bans tested against objects (lookup) | varnish.cache.main.bans_tested.count | Count of how many bans and objects have been tested against each other during hash lookup. | Count |
| Objects killed by bans (lookup) | varnish.cache.main.bans_obj_killed.count | Number of objects killed by bans during object lookup. | Count |
| Bans tested against objects (lurker) | varnish.cache.main.bans_lurker_tested.count | Count of how many bans and objects have been tested against each other by the ban-lurker. | Count |
| Ban tests tested against objects (lookup) | varnish.cache.main.bans_tests_tested.count | Count of how many tests and objects have been tested against each other during lookup. 'ban req.url == foo && req.http.host == bar' counts as one in 'bans_tested' and as two in 'bans_tests_tested' | Count |
| Ban tests tested against objects (lurker) | varnish.cache.main.bans_lurker_tests_tested.count | Count of how many tests and objects have been tested against each other by the ban-lurker. 'ban req.url == foo && req.http.host == bar' counts as one in 'bans_tested' and as two in 'bans_tests_tested' | Count |
| Objects killed by bans (lurker) | varnish.cache.main.bans_lurker_obj_killed.count | Number of objects killed by the ban-lurker. | Count |
| Objects killed by bans for cutoff (lurker) | varnish.cache.main.bans_lurker_obj_killed_cutoff.count | Number of objects killed by the ban-lurker to keep the number of bans below ban_cutoff. | Count |
| Bans superseded by other bans | varnish.cache.main.bans_dups.count | Count of bans replaced by later identical bans. | Count |
| Lurker gave way for lookup | varnish.cache.main.bans_lurker_contention.count | Number of times the ban-lurker had to wait for lookups. | Count |
| Bytes used by the persisted ban lists | varnish.cache.main.bans_persisted_bytes | Number of bytes used by the persisted ban lists. | Byte |
| Extra bytes in persisted ban lists due to fragmentation | varnish.cache.main.bans_persisted_fragmentation | Number of extra bytes accumulated through dropped and completed bans in the persistent ban lists. | Byte |
| Number of purge operations executed | varnish.cache.main.n_purges.count | Number of purge operations executed | Count |
| Number of purged objects | varnish.cache.main.n_obj_purged.count | Number of purged objects | Count |
| Number of objects mailed to expiry thread | varnish.cache.main.exp_mailed.count | Number of objects mailed to expiry thread for handling. | Count |
| Number of objects received by expiry thread | varnish.cache.main.exp_received.count | Number of objects received by expiry thread for handling. | Count |
| HCB Lookups without lock | varnish.cache.main.hcb_nolock.count | HCB Lookups without lock | Count |
| HCB Lookups with lock | varnish.cache.main.hcb_lock.count | HCB Lookups with lock | Count |
| HCB Inserts | varnish.cache.main.hcb_insert.count | HCB Inserts | Count |
| ESI parse errors (unlock) | varnish.cache.main.esi_errors.count | ESI parse errors (unlock) | Count |
| ESI parse warnings (unlock) | varnish.cache.main.esi_warnings.count | ESI parse warnings (unlock) | Count |
| Loaded VMODs | varnish.cache.main.vmods | Loaded VMODs | Count |
| Gzip operations | varnish.cache.main.n_gzip.count | Gzip operations | Count |
| Gunzip operations | varnish.cache.main.n_gunzip.count | Gunzip operations | Count |
| Test gunzip operations | varnish.cache.main.n_test_gunzip.count | Those operations occur when Varnish receives a compressed object from a backend. They are done to verify the gzip stream while it's inserted in storage. | Count |
| Premature iovec flushes | varnish.cache.main.http1_iovs_flush.count | Number of additional writes performed on HTTP1 connections because the number of IO vectors was too small to submit all possible IO in one go. This number is configured through the http1_iovs parameter for client connections and implicitly defined by the amount of free workspace for backend connections. | Count |
varnishstat binaries.1.338.0 and a minimum OneAgent version of 1.318.0⚠️ WARNING: This version introduces a breaking change requiring the monitoring configuration to be updated
Path to varnishstat executable field must no longer contain the varnishstat binary in it, but only the path to the directory containing the executable with a trailing slash
/usr/bin/🐛 Bugs fixed: