

















Skip to technology filters Skip to main content
Dynatrace Hub

Extend the platform,
empower your team.

Popular searches:
Home hero bg
Oobeya Engineering Intelligence PlatformOobeya Engineering Intelligence Platform
Oobeya Engineering Intelligence Platform

Oobeya Engineering Intelligence Platform

AI impact and SDLC visibility in one platform.

Technology
Free trialDocumentation
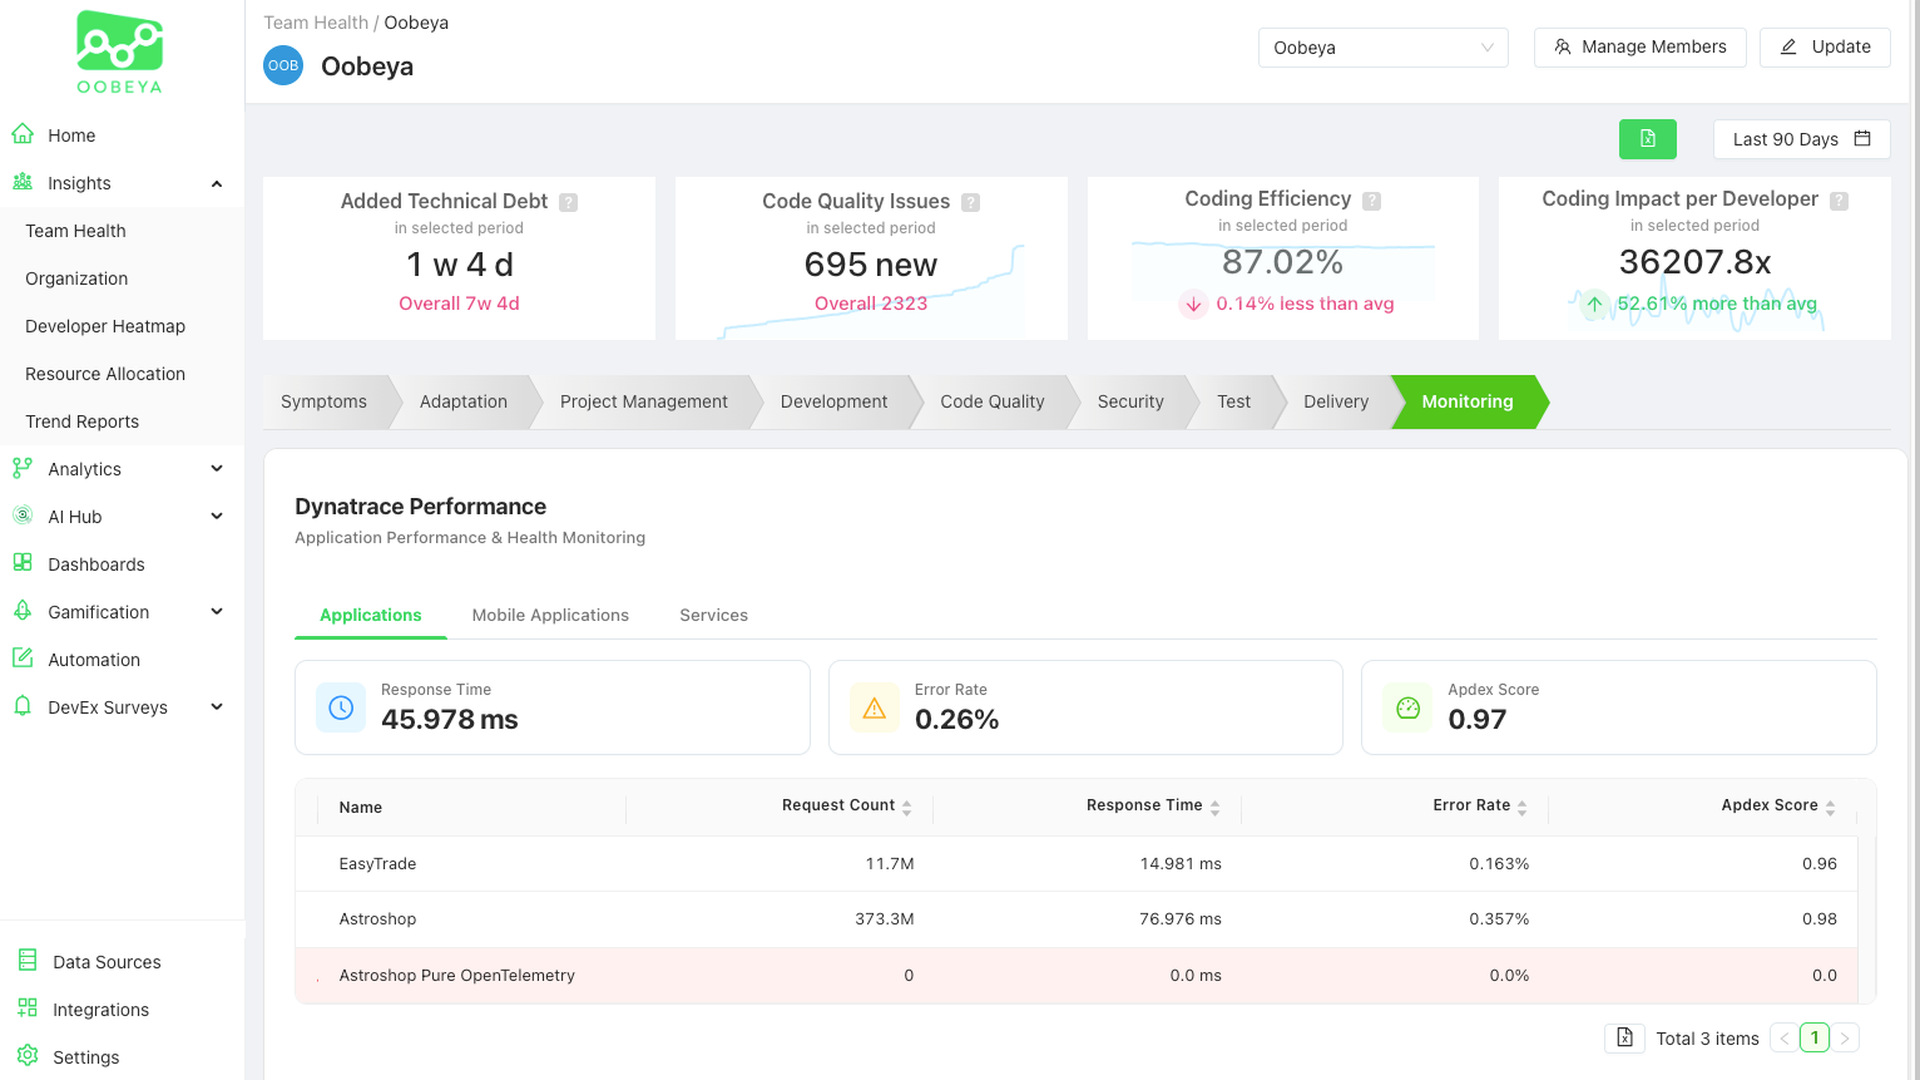
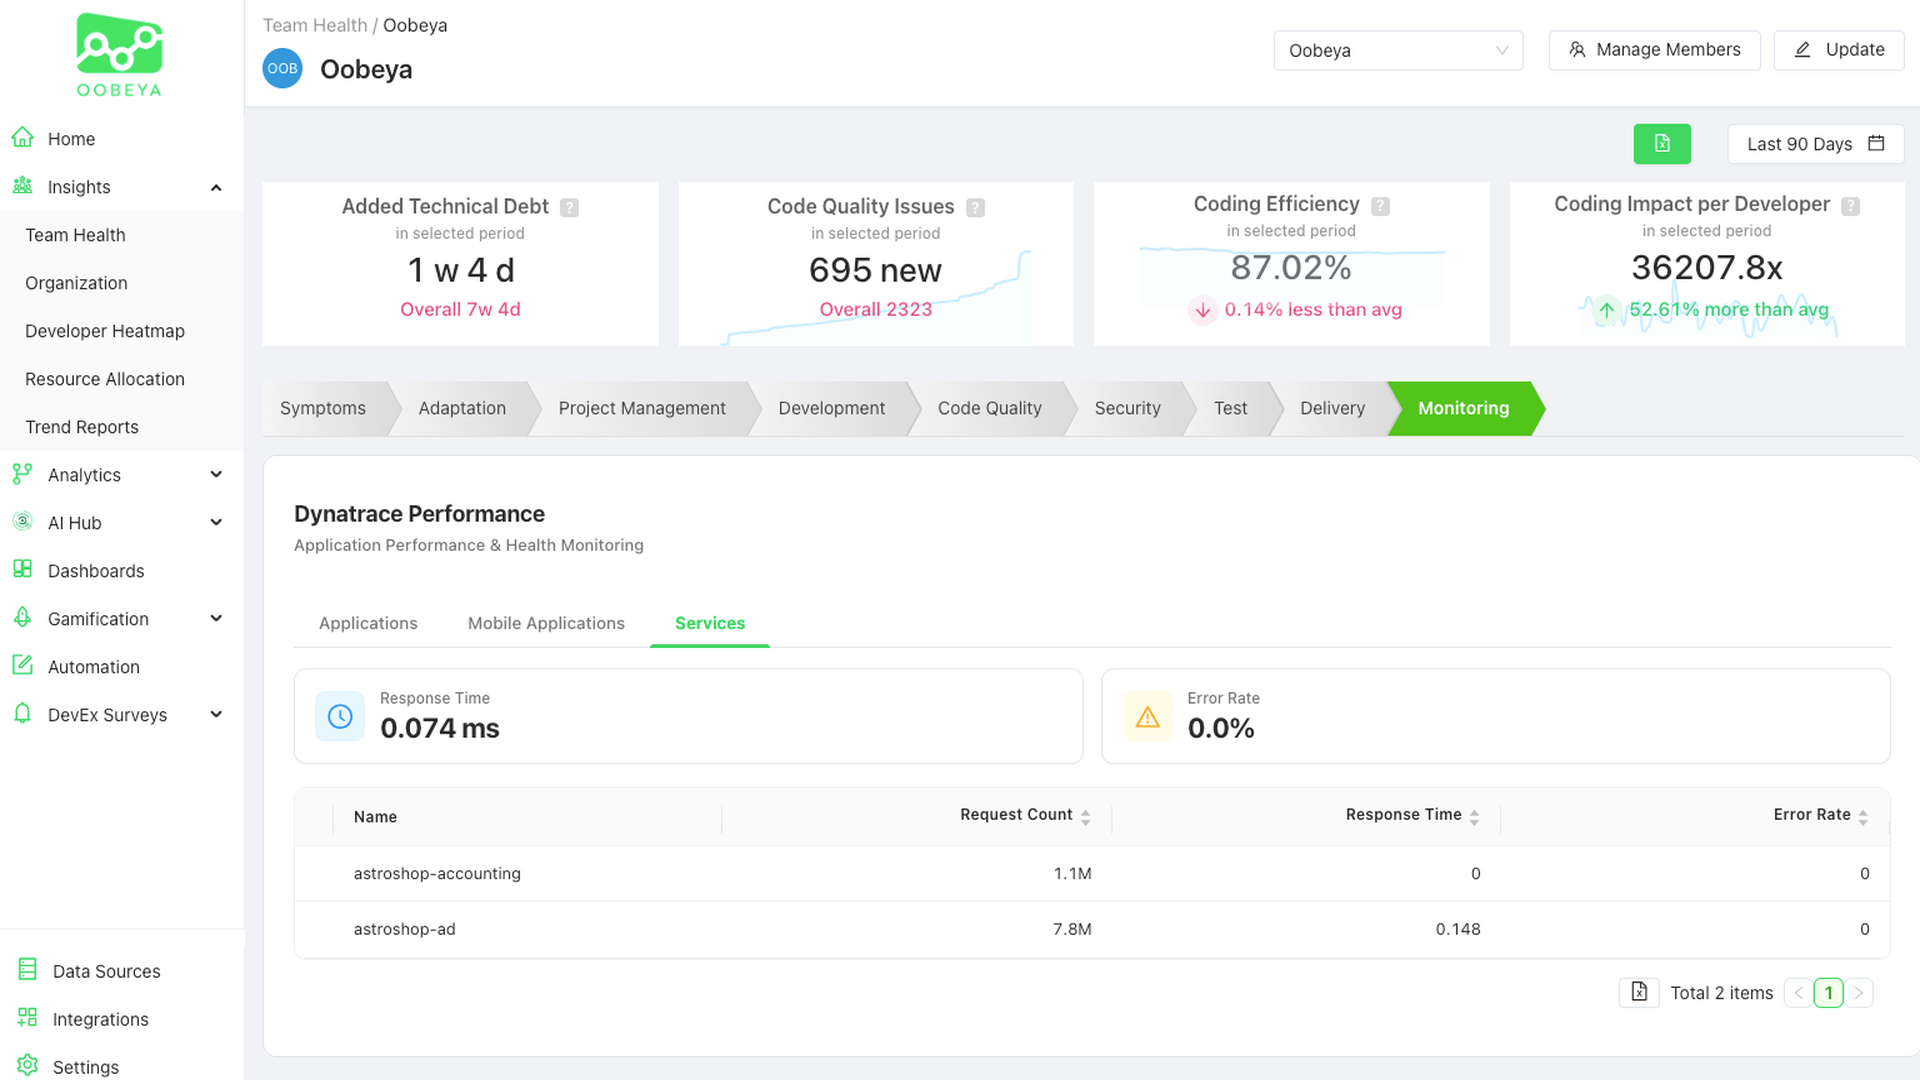
Oobeya Dashboard - Applications viewOobeya Dashboard - Services view
  • Product information

Overview

Oobeya is a Software Engineering Intelligence Platform that turns data from your SDLC, delivery, quality, and operational tools into trusted visibility and actionable insights. By connecting repositories, agile boards, CI/CD pipelines, code quality tools, and observability platforms, Oobeya shows delivery performance, team health, bottlenecks, reliability impact, and improvement opportunities in one place.

With the Dynatrace integration, Oobeya brings production health and incident signals into the engineering intelligence layer. Teams can correlate operational events with deployments, services, repositories, and teams, and with DORA metrics such as Change Failure Rate and Mean Time to Restore — connecting software delivery performance to real production outcomes.

Use cases

  • Correlate Dynatrace incidents and production health signals with deployments, services, repositories, and teams to see which changes drive instability.
  • Track DORA metrics — including Change Failure Rate and Mean Time to Restore — grounded in real Dynatrace operational data rather than self-reported inputs.
  • Give engineering, DevOps, and platform leaders one dashboard spanning delivery flow, team health, code quality, and reliability.
  • Measure the impact of AI coding tools on delivery throughput, quality, and developer experience.
  • Identify bottlenecks across the SDLC and prioritize improvements with evidence instead of anecdotes.

Get started

  1. Request access to Oobeya at partners@oobeya.io — a guided demo is available, and the platform is licensed BYOL.
  2. In Oobeya, add Dynatrace as a data source and provide your Dynatrace environment URL and an OAuth client / access token with read scopes for the data you want to ingest.
  3. Connect your remaining engineering tools — Git repositories, agile boards, CI/CD pipelines, and code quality scanners.
  4. Map services and repositories to teams so Oobeya can attribute delivery and reliability metrics correctly.
  5. Open the DORA and reliability dashboards to review correlated delivery and production data.

Full setup documentation: https://docs.oobeya.io

Details

Key capabilities

  • Unified visibility across SDLC, delivery, quality, and observability tools
  • DORA, flow, team health, quality, and reliability analytics
  • Dynatrace integration for production health, incident, and performance signals
  • Correlation of operational events with deployments, services, repositories, and teams
  • Leadership dashboards for engineering, DevOps, platform, and software delivery teams
  • Enterprise-ready setup with admin-controlled data sources and role-based access

Licensing

Bring Your Own License (BYOL). Contact partners@oobeya.io for pricing and a demo. No self-service free trial is currently offered.

Support

support@oobeya.io

Customer story

Engineering visibility at Sicredi

Dynatrace
DocumentationMore Information
By Dynatrace
Dynatrace support center
Copy to clipboard
Dynatrace Hub
Get data into DynatraceBuild your own app
Dynatrace Intelligence - The Agentic PlatformThe Dynatrace Agentic AI ecosystem
All (948)Log Management and AnalyticsKubernetesAI and LLM ObservabilityInfrastructure ObservabilitySoftware DeliveryApplication ObservabilityApplication SecurityBusiness ObservabilityDigital Experience
Filter
Type
Built and maintained by
Partner FinderBecome a partnerDynatrace Developer

Discover recent additions to Dynatrace

Arize AX logo

Arize AX

Analyze traces, latency, and evals of LLM apps through Arize OpenInference data.

AI Observability logo

AI Observability

End-to-end observability for your Agentic AI and LLM workloads.

Dynatrace Assist logo

Dynatrace Assist

Dynatrace Assist: Ask, analyze, and act with Dynatrace Intelligence.

SRE Agent logo

SRE Agent

Analyze and triage incidents.

Smartscape logo

Smartscape

Interactively explore and analyze topology and relationships in digital systems.

Clouds logo

Clouds

Gain full visibility and proactive monitoring across your cloud infrastructure.

Analyze your data

Understand your data better with deep insights and clear visualizations.

Notebooks logo

Notebooks

Create powerful, data-driven documents for custom analytics and collaboration.

Dashboards logo

Dashboards

Transform complex data into clear visualizations with custom dashboards.

Investigations logo

Investigations

Fast and precise incident response on Grail data with DQL queries.

Smartscape logo

Smartscape

Interactively explore and analyze topology and relationships in digital systems.

Logs logo

Logs

Explore all your logs without writing a single query.

Problems logo

Problems

Detect, explain and triage problems automatically using Dynatrace Intelligence.

Automate your processes

Turn data and answers into actions, securely, and at scale.

Workflows logo

Workflows

Automate tasks in your IT landscape and move towards autonomous operations.

Jira logo

Jira

Open, update, and close Jira tickets automatically from Dynatrace Workflows.

Slack logo

Slack

Automate Slack messaging for security incidents, attacks, remediation, and more.

Secure your cloud application

See vulnerabilities and attacks in your environment.

Security Posture Management logo

Security Posture Management

Detect, prioritize, and remediate security and compliance findings with SPM.

Threats & Exploits logo

Threats & Exploits

Understand, triage, and investigate detection findings and alerts.

More resources

Cursor (Live-Debugger) logo

Cursor (Live-Debugger)

Get Real time Code-Level data directly to your Cursor IDE.

Documents logo

Documents

Manage Dashboards, Notebooks and other documents in your Dynatrace environment.

GitHub Copilot Coding Agent logo

GitHub Copilot Coding Agent

Automate vulnerability remediation and boost developer productivity.

GitHub Copilot Custom Agent logo

GitHub Copilot Custom Agent

Automate your development workflows with specialized agent definitions.

Dynatrace Live Debugger on JetBrains logo

Dynatrace Live Debugger on JetBrains

Get real-time code-level data directly to your Jetbrains IDE.

Metrics logo

Metrics

Browse, search, and manage all your metrics in one central catalog.

Dynatrace Live Debugger on Windsurf logo

Dynatrace Live Debugger on Windsurf

Get real-time code-level data directly to your Windsurf IDE.

Are you looking for something different?

We have hundreds of apps, extensions, and other technologies to customize your environment

Leverage our newest innovations of Dynatrace Saas

Kick-start your app creation

Kick-start your app creation

Whether you’re a beginner or a pro, Dynatrace Developer has the tools and support you need to create incredible apps with minimal effort.
Go to Dynatrace Developer
Upgrading from Dynatrace Managed to SaaS

Upgrading from Dynatrace Managed to SaaS

Drive innovation, speed, and agility in your organization by seamlessly and securely upgrading.
Learn More
Log Management and Analytics

Log Management and Analytics

Innovate faster and more efficiently with unified log management and log analytics for actionable insights and automation.
Learn more