


























Kick-start your app creation
Whether you’re a beginner or a pro, Dynatrace Developer has the tools and support you need to create incredible apps with minimal effort.
Go to Dynatrace Developer
 Microsoft Windows Failover Cluster
Monitor the health and availability of Windows Server failover clusters.
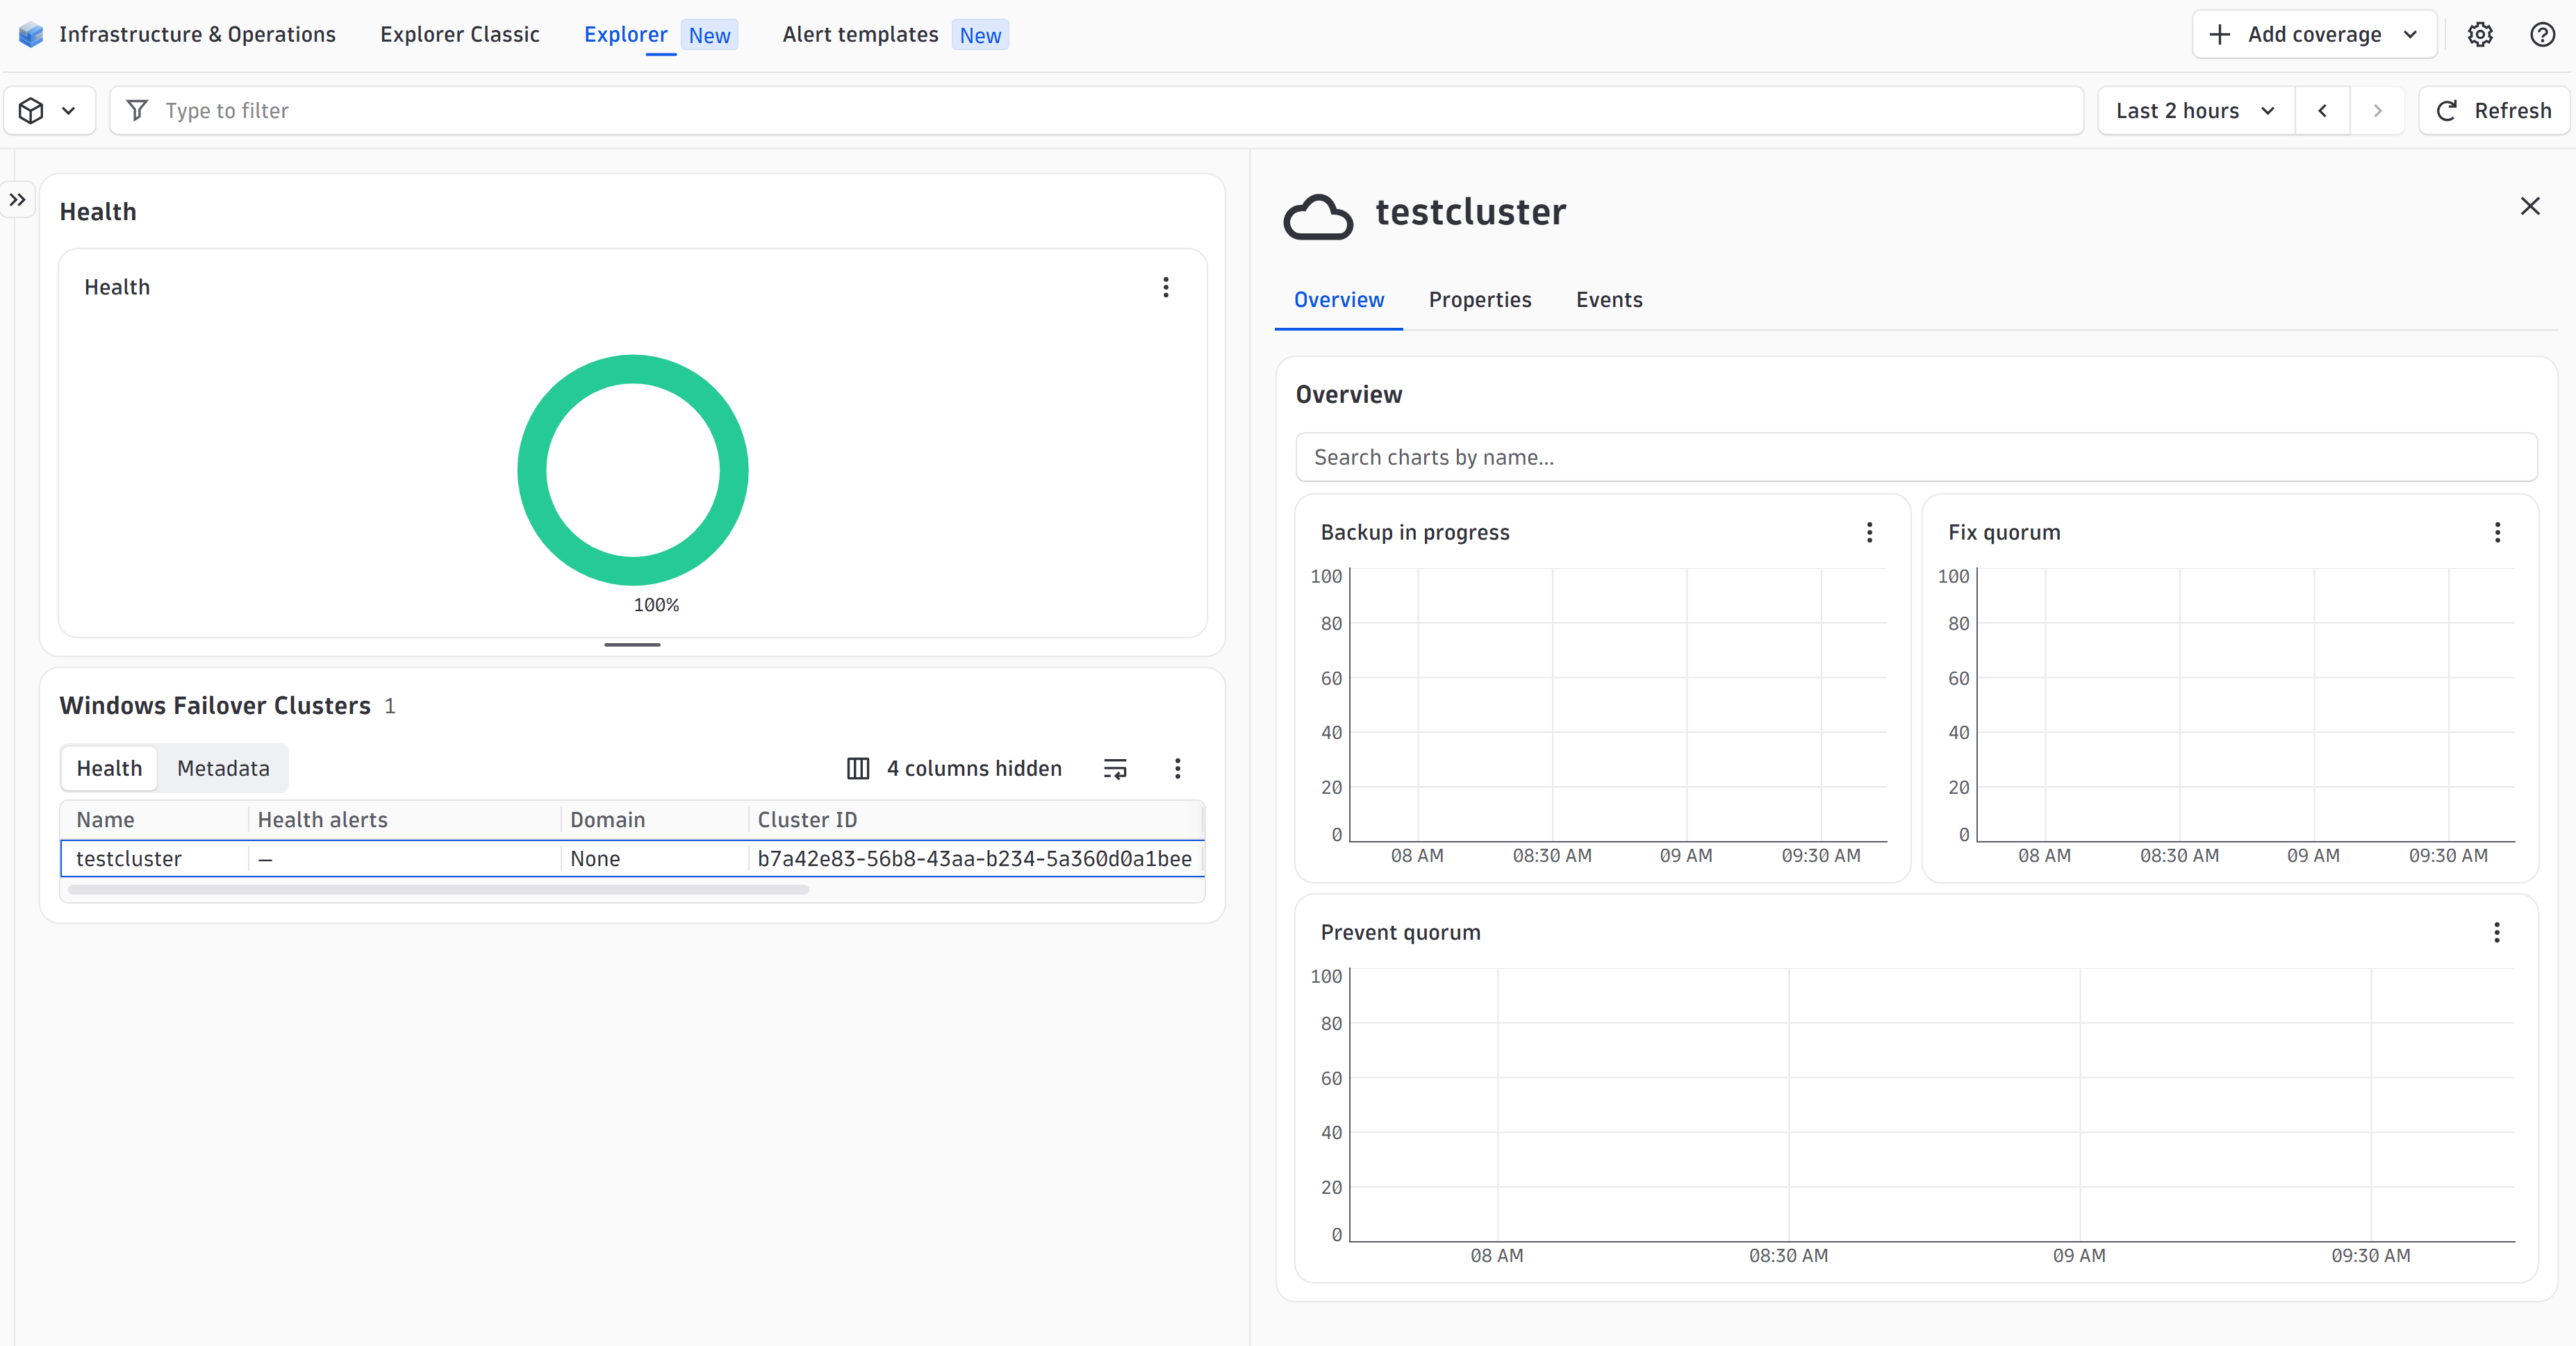
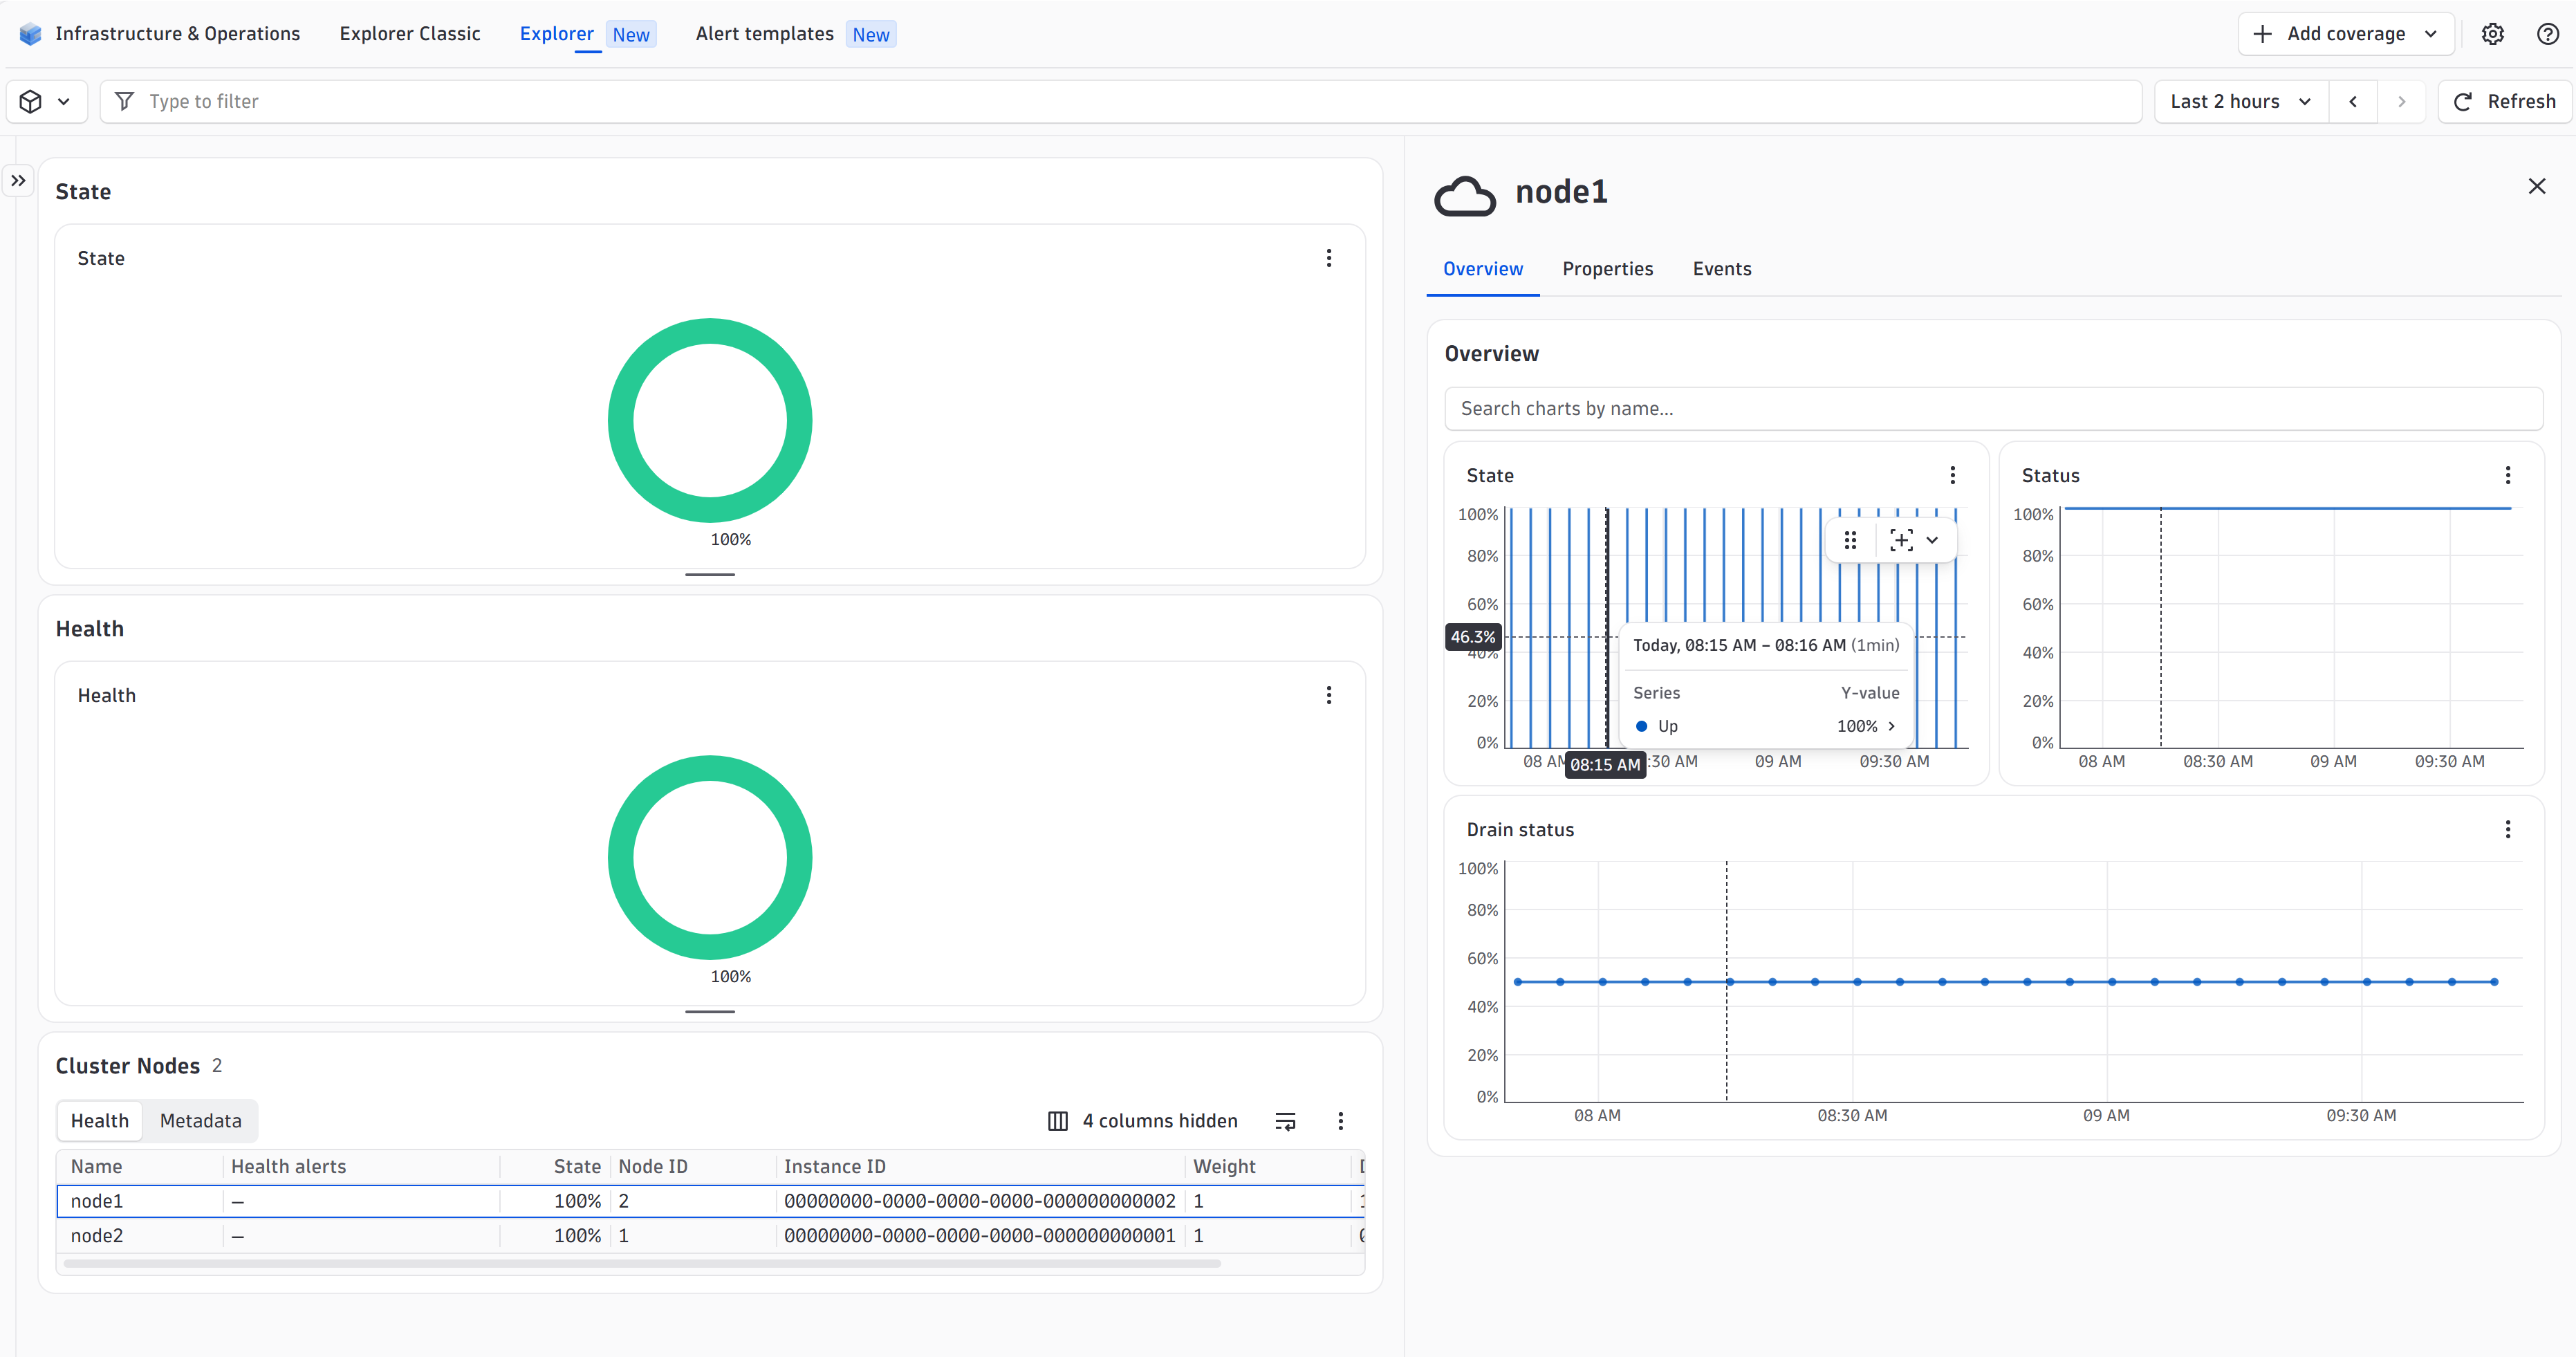
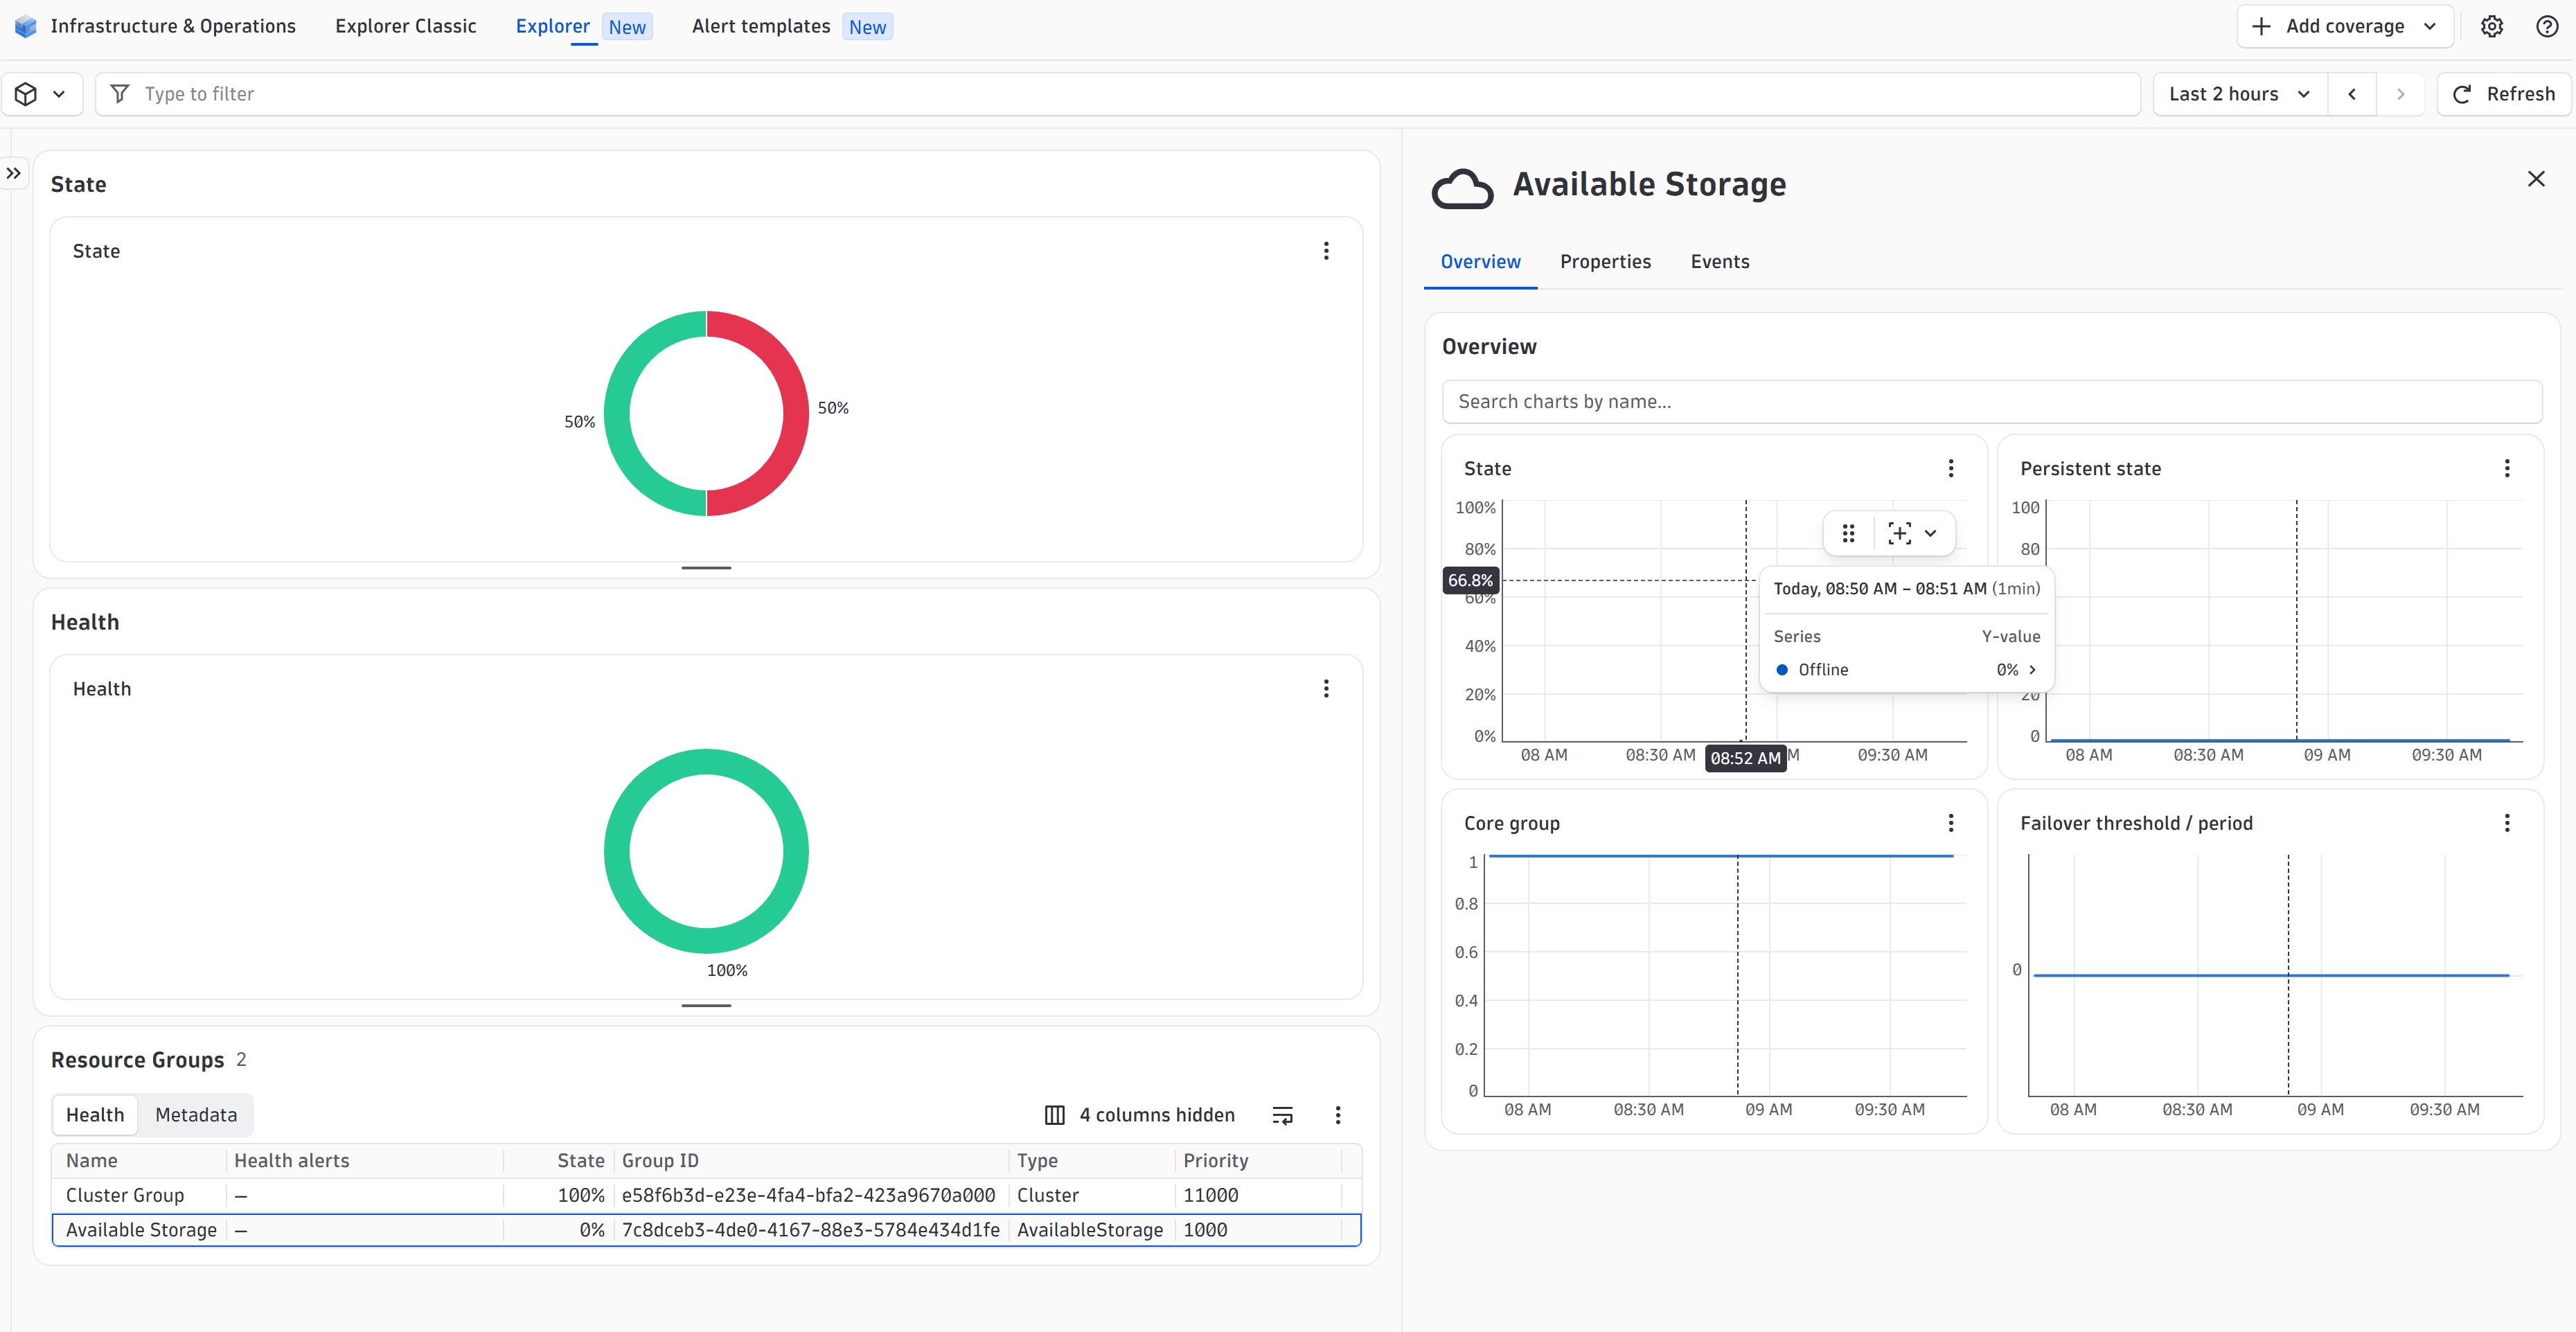
ExtensionWindows Server failover clusters keep business-critical workloads running when a server goes down. This extension runs on one of the OneAgent-monitored nodes of each cluster and gives you a single view of the cluster and its components: nodes, resource groups, resources, cluster networks, network interfaces, and cluster disks.
For every component, you can see whether it's online and healthy, so you can spot failed nodes, offline roles, or degraded networks as soon as they occur. At the cluster level, you can see whether the cluster is in a fix quorum or prevent quorum state and whether a backup is in progress. Each cluster's configuration, such as its domain, functional level, and quarantine settings, is also recorded. With this data in Dynatrace, Davis AI can detect anomalies and help you find the root cause of availability problems.
For more information on the installation and configuration, please see Microsoft Windows Failover Cluster extension in the Dynatrace Documentation.
Below is a complete list of the feature sets provided in this version. To ensure a good fit for your needs, individual feature sets can be activated and deactivated by your administrator during configuration.
| Metric name | Metric key | Description | Unit |
|---|---|---|---|
| Resource group failover period | windows.cluster.group.failover_period | Number of hours during which a maximum number of failover attempts can occur. | Hour |
| Resource group failover threshold | windows.cluster.group.failover_threshold | Maximum number of failover attempts that can be made on a group within the failover period. | Count |
| Resource group core state | windows.cluster.group.is_core_group | Indicates if the resource group is essential to the cluster and cannot be deleted. | Count |
| Resource group persistent state | windows.cluster.group.persistent_state | Whether a group should be left offline or brought online when the Cluster Service starts or the group is moved to another node. | Count |
| Metric name | Metric key | Description | Unit |
|---|---|---|---|
| Network interface availability | windows.cluster.network.interface.availability | The availability and status of the interface. | Count |
| Network interface power on hours | windows.cluster.network.interface.power_on_hours | Number of consecutive hours that the interface has been powered, since its last power cycle. | Hour |
| Metric name | Metric key | Description | Unit |
|---|---|---|---|
| Node status | windows.cluster.node.status | - | Percent |
| Resource group status | windows.cluster.group.status | Current status of the object: OK, Degraded, Stressed, Pred Fail, Error, NonRecover, Starting, Stopping, Service. | Percent |
| Resource status | windows.cluster.resource.status | Current status of the object: OK, Degraded, Stressed, Pred Fail, Error, NonRecover, Starting, Stopping, Service. | Percent |
| Network status | windows.cluster.network.status | Current status of the object: OK, Degraded, Stressed, Pred Fail, Error, NonRecover, Starting, Stopping, Service. | Percent |
| Network interface status | windows.cluster.network.interface.status | Current status of the object: OK, Degraded, Stressed, Pred Fail, Error, NonRecover, Starting, Stopping, Service. | Percent |
| Disk status | windows.cluster.disk.status | Current status of the object: OK, Degraded, Stressed, Pred Fail, Error, NonRecover, Starting, Stopping, Service. | Percent |
| Metric name | Metric key | Description | Unit |
|---|---|---|---|
| Node power state | windows.cluster.node.power_state | Indicates the current power state of the ComputerSystem and its associated OperatingSystem: Unknown, Full Power, Power Save, Power Cycle, Power Off. | Percent |
| Node drain status | windows.cluster.node.drain_status | The current node drain status of a node: Not Initiated, In Progress, Completed, Failed. | Percent |
| Metric name | Metric key | Description | Unit |
|---|---|---|---|
| Windows failover cluster properties | windows.cluster.properties | Static metric that registers properties for the cluster. | Count |
| Node state | windows.cluster.node.state | The current state of a node: Uknown, Up, Down, Paused, Joining. | Percent |
| Resource group state | windows.cluster.group.state | The current state of the resource group: Unknown, Online, Offline, Failed, Partial Online, Pending. | Percent |
| Resource state | windows.cluster.resource.state | Current state of the resource: Unknown, Inherited, Initializing, Online, Offline, Failed, Pending, Online Pending, Offline Pending. | Percent |
| Network state | windows.cluster.network.state | Current state of a network: Unknown, Unavailable, Down, Partitioned, Up. | Percent |
| Network interface state | windows.cluster.network.interface.state | The current state of the network interface: Unknown, Unavailable, Failed, Unreachable, Up. | Percent |
| Disk size | windows.cluster.disk.size | Physical size of the disk. | KiloByte |
| Metric name | Metric key | Description | Unit |
|---|---|---|---|
| Windows failover cluster fix quorum | windows.cluster.fix_quorum | Specifies whether the cluster is in a fix quorum state or not. | Count |
| Windows failover cluster prevent quorum | windows.cluster.prevent_quorum | Specifies whether the cluster is in a prevent quorum state or not. | Count |
| Windows failover cluster backup in progress | windows.cluster.backup | Specifies whether a backup is in progress or not. | Count |
| Metric name | Metric key | Description | Unit |
|---|---|---|---|
| Resource core state | windows.cluster.resource.is_core_resource | If the resource is essential to the cluster and cannot be deleted. | Count |
| Resource persistent state | windows.cluster.resource.persistent_state | Whether the resource should be brought online or left offline when the Cluster Service is started. | Count |
ℹ️ This version requires a minimum Dynatrace version of 1.343.0 and a minimum OneAgent version of 1.341.0.