


























Kick-start your app creation
Whether you’re a beginner or a pro, Dynatrace Developer has the tools and support you need to create incredible apps with minimal effort.
Go to Dynatrace Developer
 Fortinet FortiManager
Observe FortiManager managed devices, config sync, policy packages, and tasks.
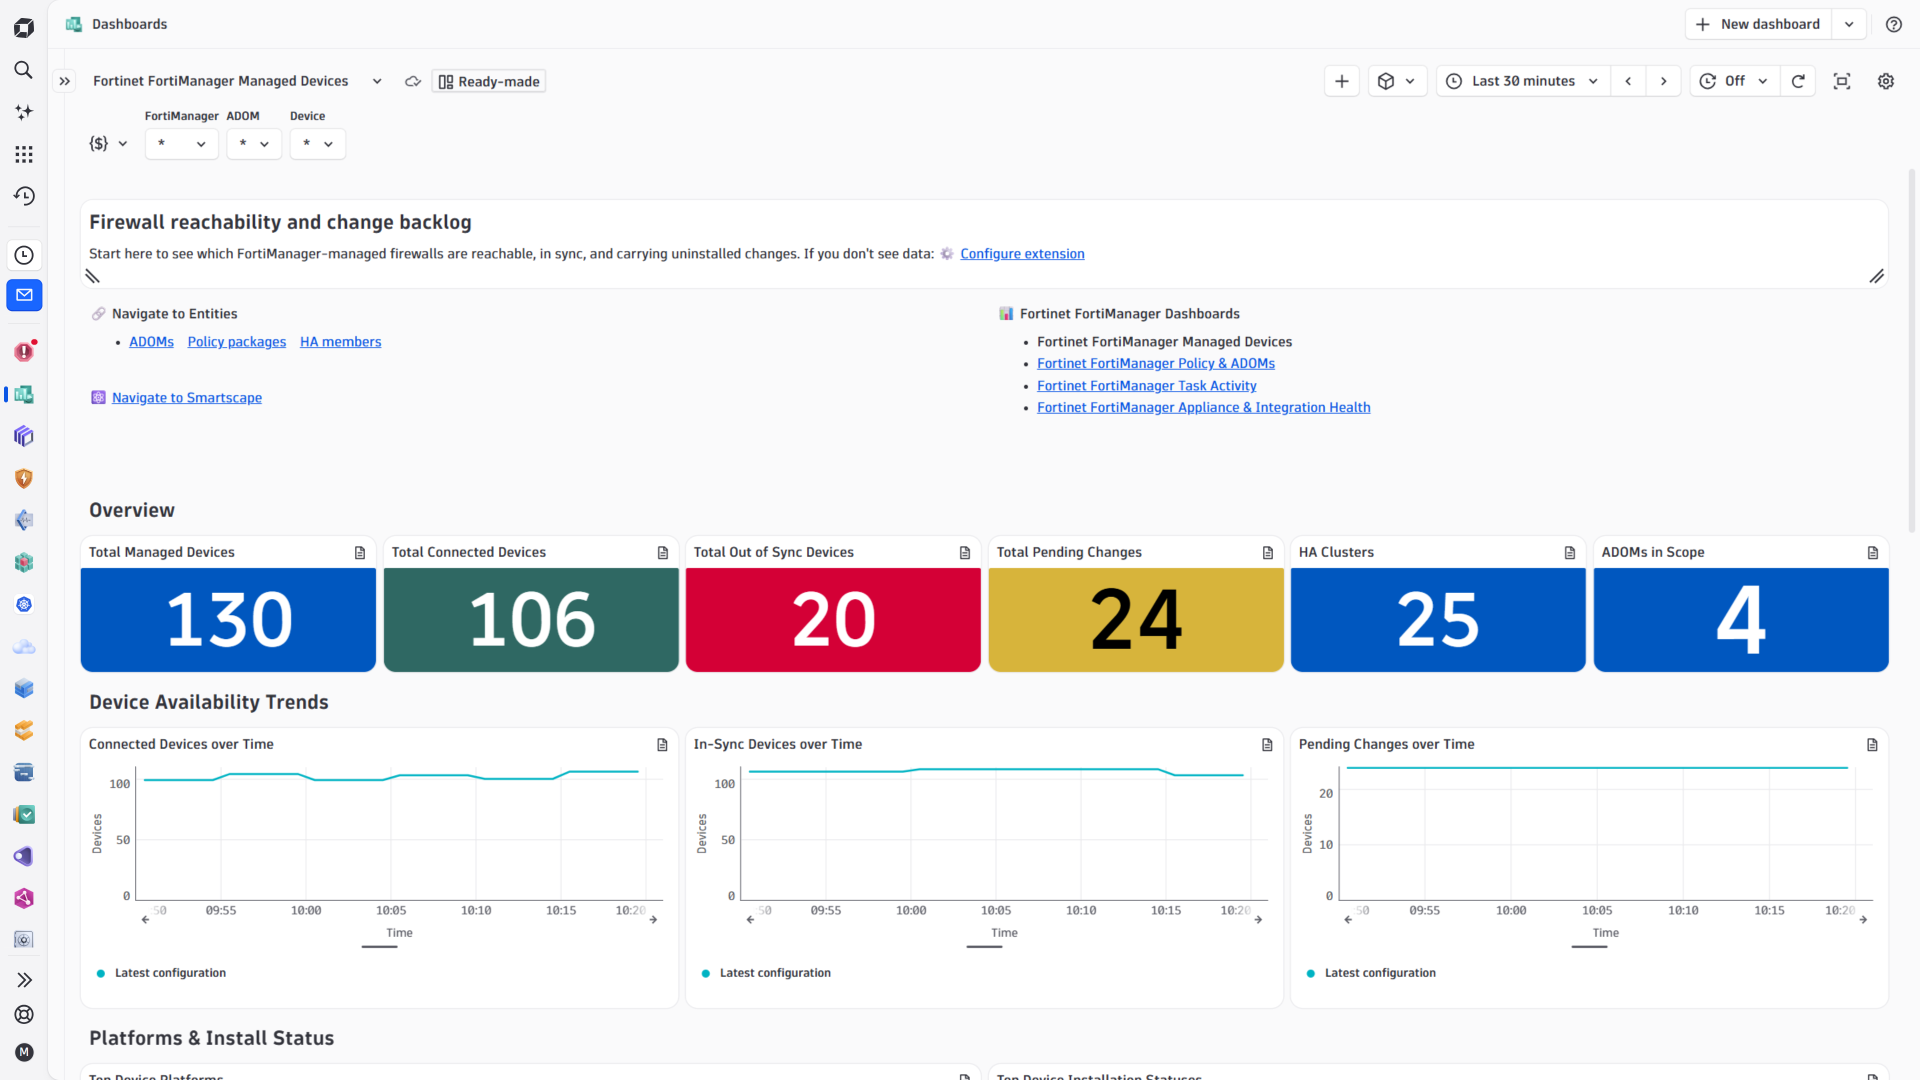
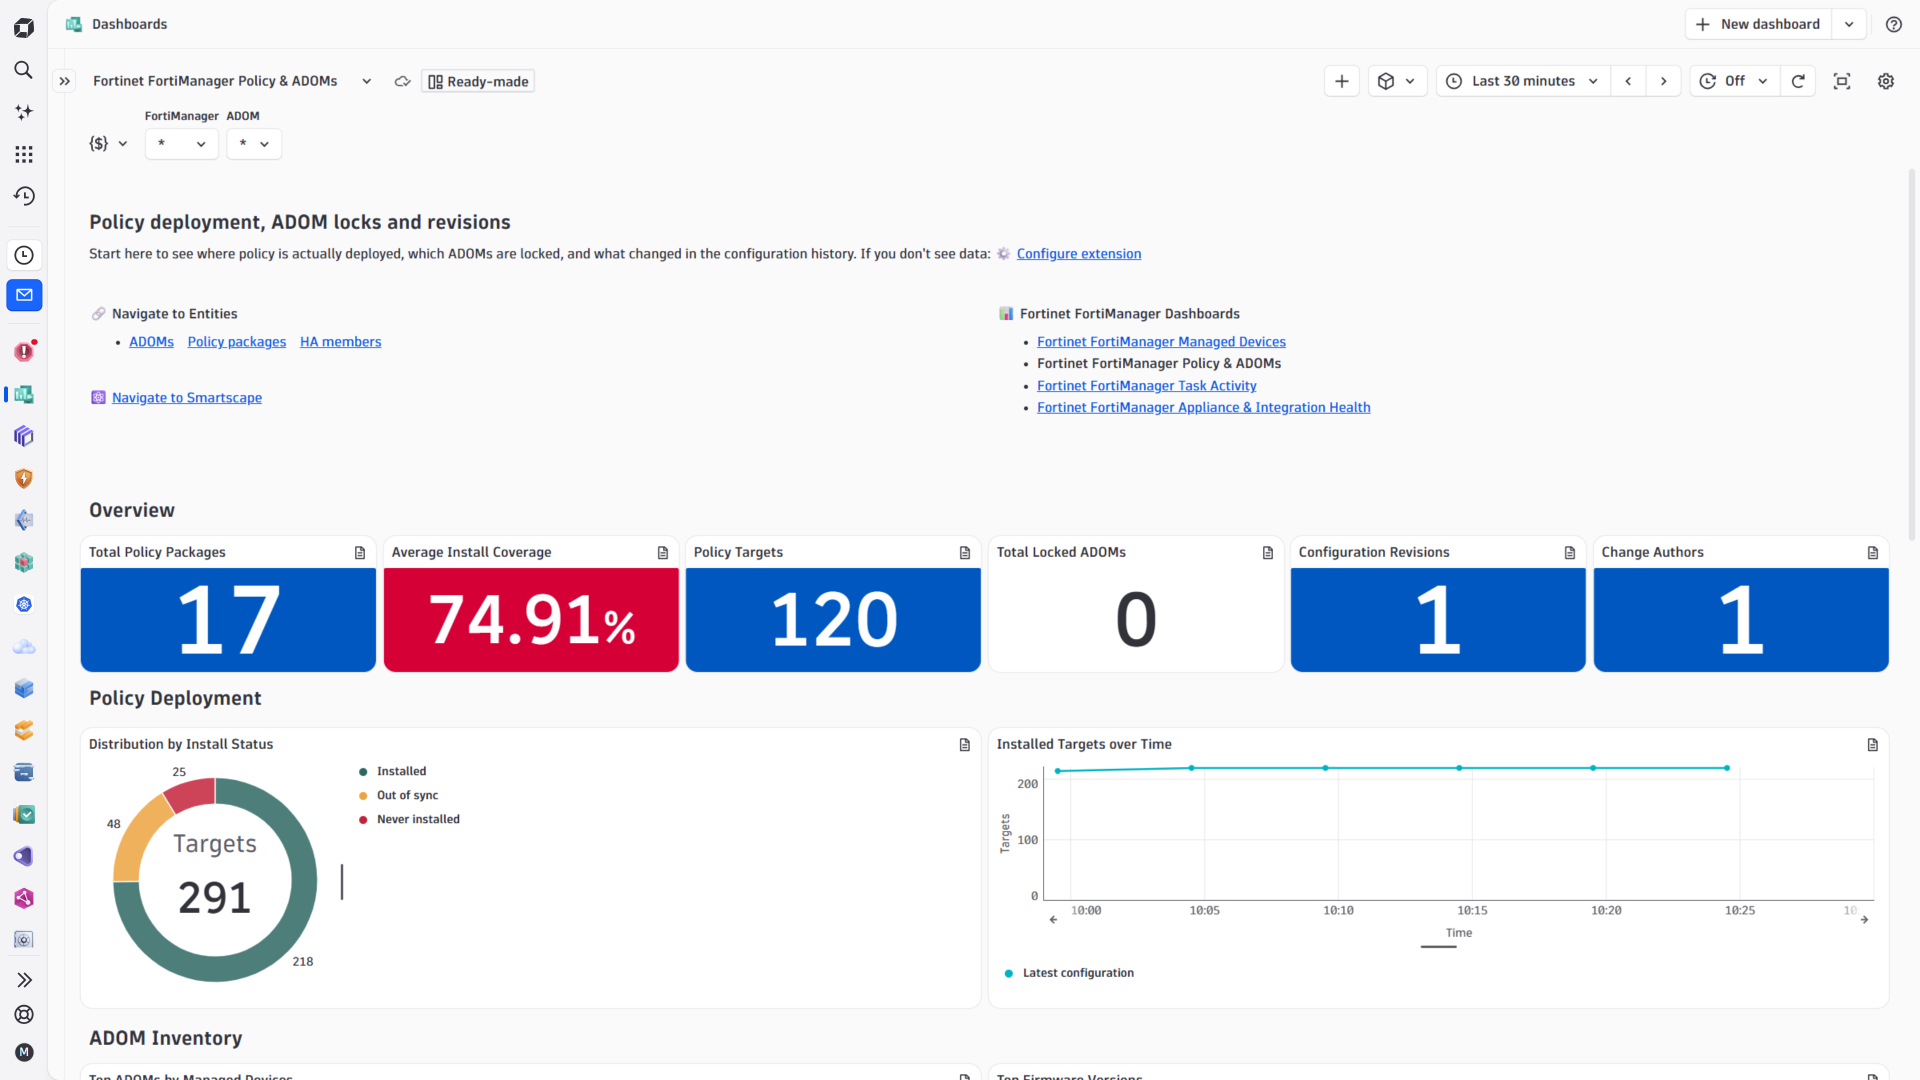
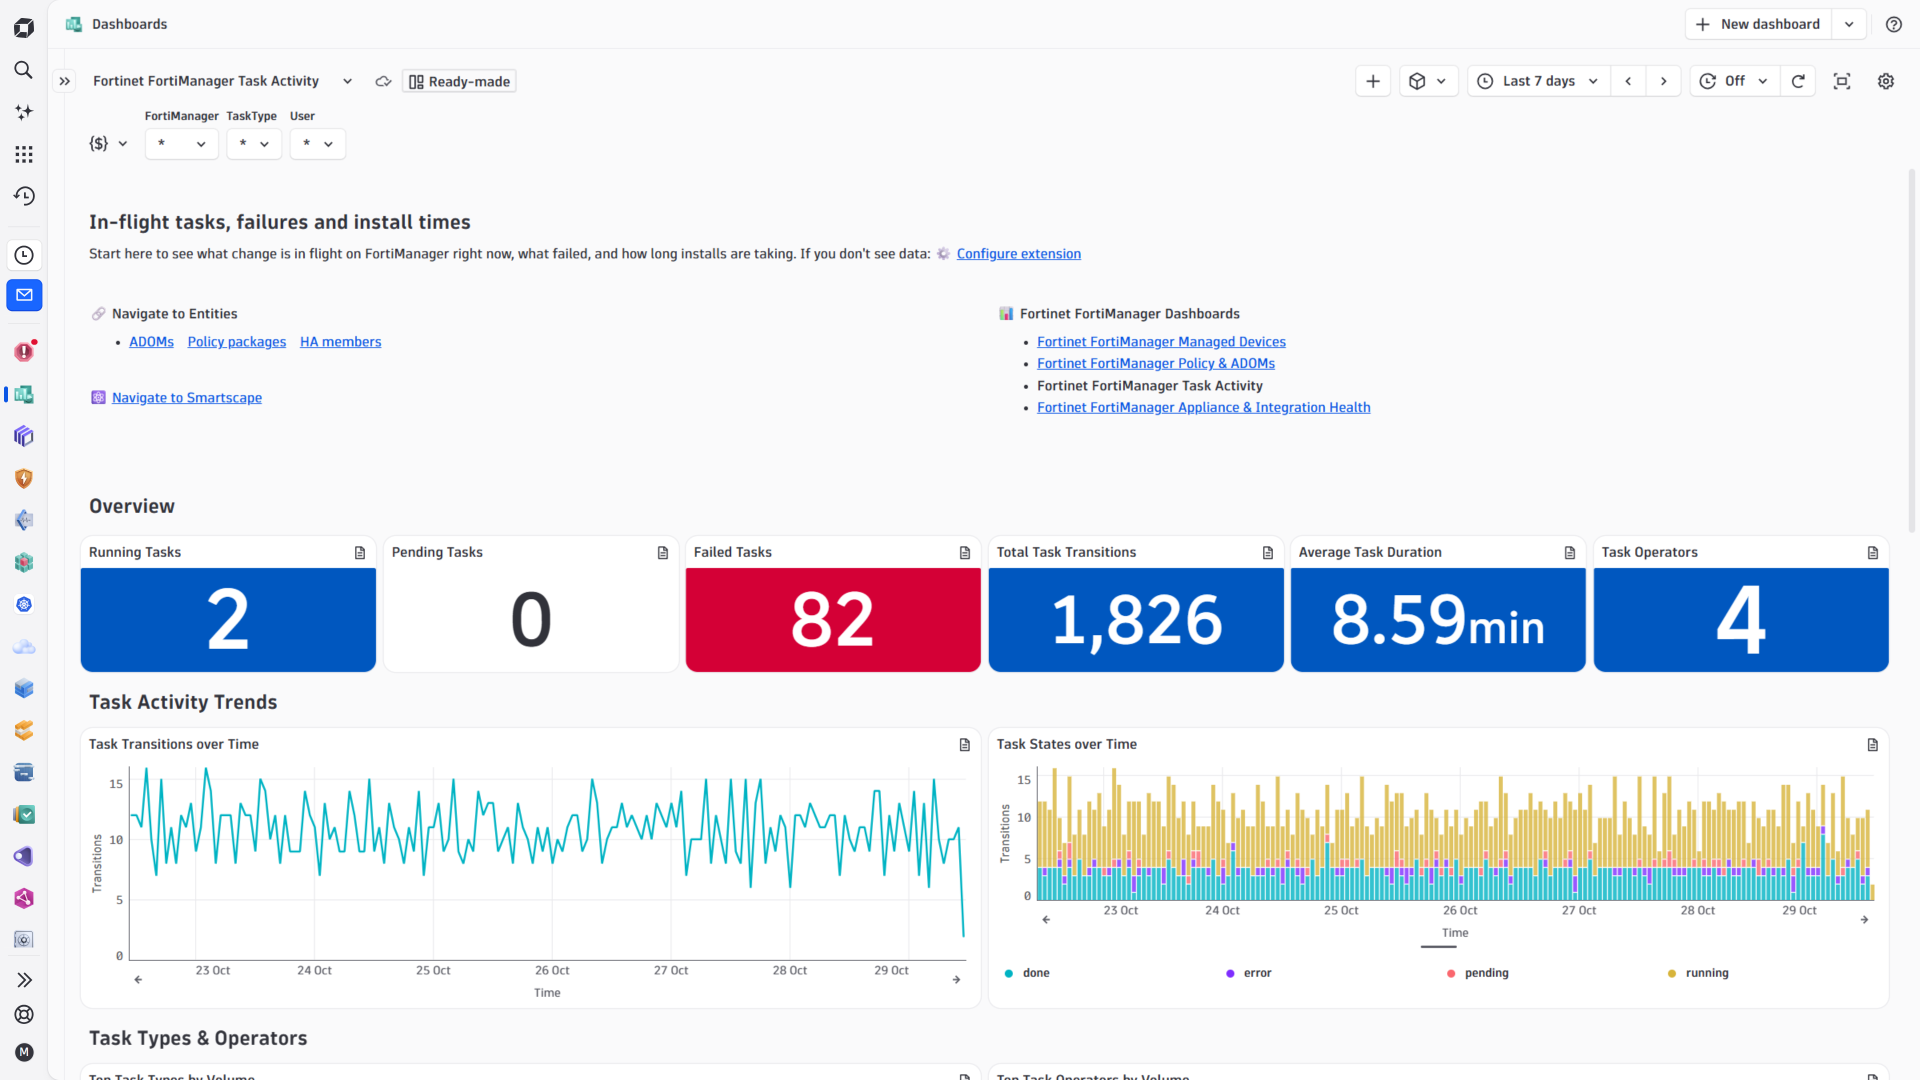
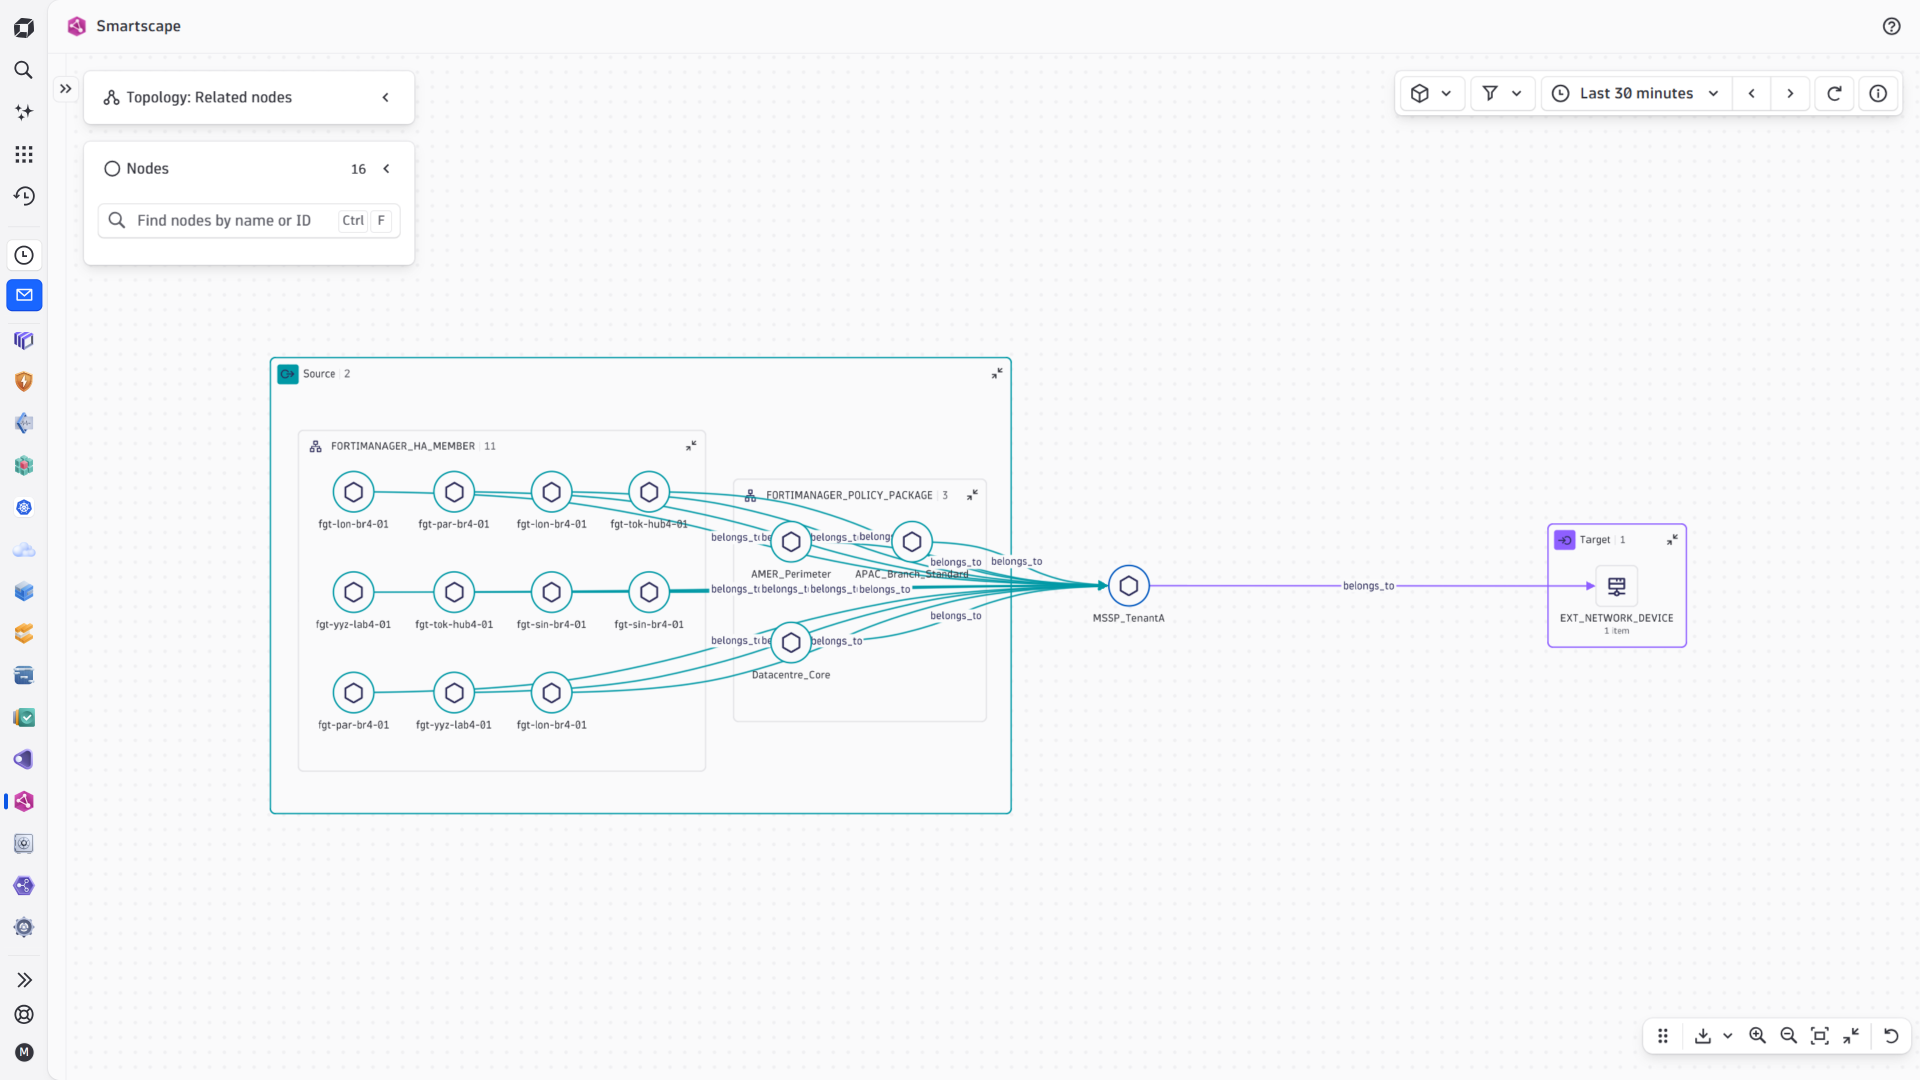
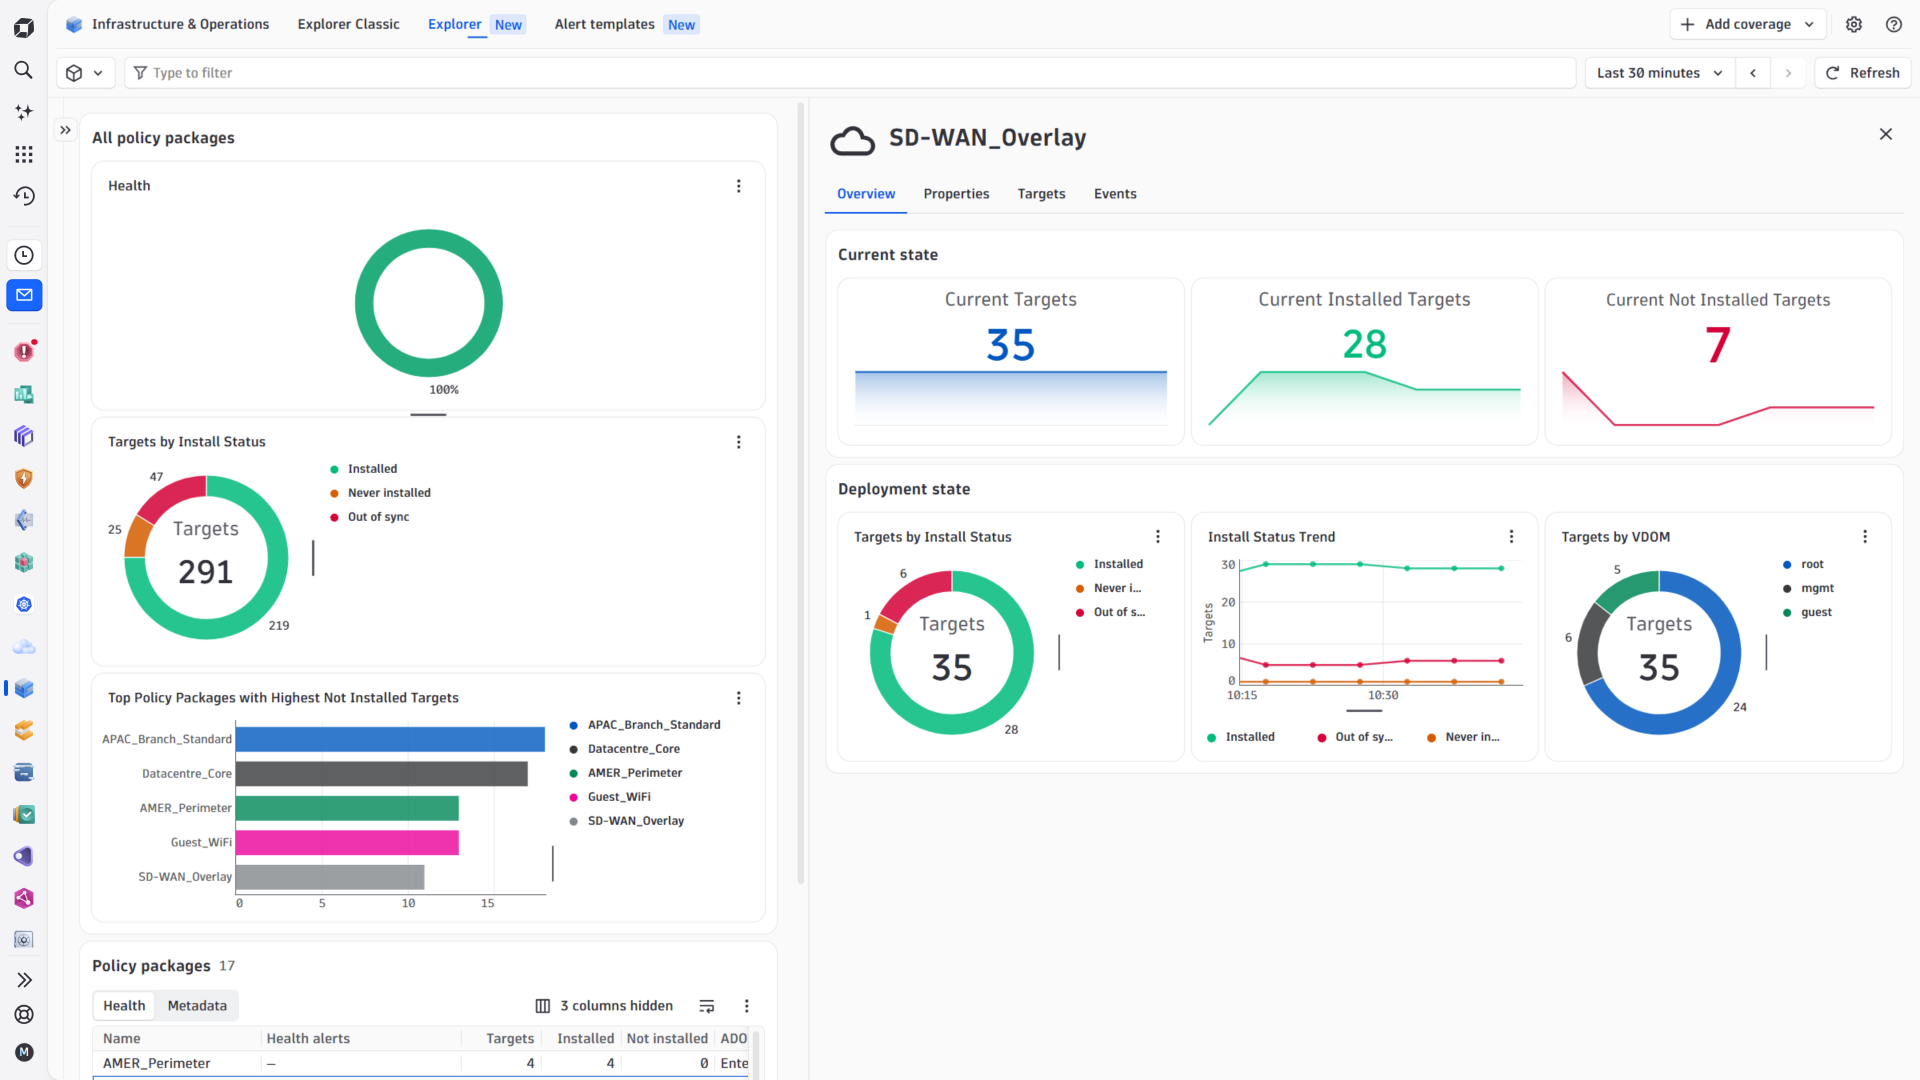
ExtensionThe Fortinet FortiManager extension brings the management-plane state held by a Fortinet FortiManager into Dynatrace. Running on an ActiveGate, it polls the FortiManager JSON-RPC API, reports metrics on the appliance, its ADOMs, managed devices and policy packages, builds the Smartscape topology, and streams task, configuration revision, and FortiAnalyzer alert details as structured logs. Ready-to-use dashboards, unified analysis screens, and alert templates enable analysis of reachability, configuration drift, policy deployment, and change activity across your Fortinet estate. Managed devices share Smartscape nodes with the Fortinet FortiGate extension, so management-plane state and device performance meet on the same device.
You need a FortiManager 7.2.2 or later appliance or VM, or a FortiManager Cloud instance, and an Environment ActiveGate that can reach it over HTTPS. On the FortiManager side, create a dedicated read-only administrator with JSON API access (or a FortiCloud IAM API user for FortiManager Cloud) that lets Dynatrace connect and collect the data.
For step-by-step instructions on the installation and configuration on both FortiManager and Dynatrace sides, please see Fortinet FortiManager extension in the Dynatrace Documentation.
The Fortinet FortiManager extension collects metrics and topology for:
The extension brings four dashboards — Managed Devices, Policy & ADOMs, Task Activity, and Appliance & Integration Health — and eight alert templates.
Below is a complete list of the feature sets provided in this version. To ensure a good fit for your needs, individual feature sets can be activated and deactivated by your administrator during configuration.
| Metric name | Metric key | Description | Unit |
|---|---|---|---|
| Managed device inventory | fortimanager.devices | Presence signal (constant 1) per managed device, carrying its full identity, platform, firmware, connection/config-sync/database-modified/device status codes and HA role. The canonical per-device inventory record the Managed Devices dashboard and the ADOM screen's device list are built on. Managed devices get no Smartscape node of their own, because FortiManager reports no health or performance for them; the device is reported here and on its ADOM rather than as an empty network device page. os.version is composed from the device's os_ver (the major version alone), mr and patch fields, giving the same form the FortiGate GUI shows. | Count |
| Device connection status | fortimanager.device.connection_status | Whether a managed device is currently connected to FortiManager (1) or not (0). The device-level availability signal. is_model marks a device that was added to FortiManager but has never connected — exclude those from device-down alerting so that staged devices do not raise problems before they are deployed. | State |
| Device configuration sync status | fortimanager.device.config_sync_status | Whether a managed device's configuration is in sync with FortiManager's database (1 = in sync, 0 = out of sync/unknown). Flags configuration drift that has not yet been pushed to or pulled from the device. | State |
| Device database modified flag | fortimanager.device.db_modified | Whether FortiManager's database record for a device has pending local modifications not yet installed to the device (1 = modified, 0 = not modified). Distinct from config_sync_status, which reflects the device's own reported sync state rather than FortiManager's pending changes. | State |
| HA cluster members | fortimanager.device.ha_members | Presence signal (constant 1) per HA cluster member nested under its parent device, carrying the member's serial number, role and priority. Only clustered devices emit rows here; standalone devices emit none. Identity keys on member.serial, never member.name (member.name may repeat the parent device's name); the member's node belongs to its ADOM. | Count |
| Metric name | Metric key | Description | Unit |
|---|---|---|---|
| - | com.dynatrace.extension.network_device.cpu_usage | - | - |
| - | com.dynatrace.extension.network_device.memory_usage | - | - |
| - | com.dynatrace.extension.network_device.if.status | - | - |
| FortiManager connectivity | fortimanager.connectivity | Whether the extension's last poll of this FortiManager succeeded (1) or failed (0) at the authentication and system-status level. The primary availability signal for this monitoring configuration. | State |
| FortiManager system status | fortimanager.system.status | Presence signal (constant 1) carrying the FortiManager appliance's own identity and platform attributes (hostname, serial, firmware version/build, HA mode, ADOM mode) — use it to look up which appliance a given series belongs to. | Count |
| FortiManager appliance interfaces | fortimanager.system.interfaces | Presence signal (constant 1) per physical interface on the FortiManager appliance itself, carrying interface name, type, administrative status and configured speed/address. Distinct from managed-device interfaces reported by fortimanager.device.interfaces; the FortiManager's own operational link state has no source field on this endpoint and is permanently unset here. Carries fmg.serial — the appliance's own serial number, because no endpoint this extension reads reports a MAC address for the appliance — so this identifies the appliance's interface nodes the same way fortimanager.system.status identifies the appliance. | Count |
| Managed devices by ADOM and connection status | fortimanager.managed_devices | Count of managed devices grouped by ADOM and connection status (up/down/unknown) — answers "how many devices in each ADOM are currently reachable" without needing per-device detail. | Count |
| Administrative domains | fortimanager.adoms | Count of Administrative Domains (ADOMs) configured on this FortiManager, grouped by restricted product set — a low-cardinality inventory signal for sizing ADOM scope. | Count |
| Appliance CPU utilization | fortimanager.appliance.cpu.utilization | CPU utilization of the FortiManager appliance itself. This is the management appliance watching its own health — it is not a managed-device metric, and a busy FortiManager slows installs and API responses for every device it manages. | Percent |
| Appliance memory utilization | fortimanager.appliance.memory.utilization | Memory utilization of the FortiManager appliance itself, derived from its reported used and total values rather than from an embedded percentage string, since that string's formatting varies between firmware builds. | Percent |
| Appliance hard disk utilization | fortimanager.appliance.hard_disk.utilization | Hard disk utilization of the FortiManager appliance itself. A full disk stops configuration revisions and logging before it stops device management, so it fails quietly rather than obviously. | Percent |
| Appliance flash disk utilization | fortimanager.appliance.flash_disk.utilization | Flash disk utilization of the FortiManager appliance itself. Not present on every platform — where the appliance does not report it, the metric is simply not sent for that cycle rather than reported as zero. | Percent |
| Metric name | Metric key | Description | Unit |
|---|---|---|---|
| FortiManager tasks | fortimanager.tasks | Presence signal (constant 1) per task inside the configured lookback window whose state or percentage changed since the previous cycle, carrying its current state, type and initiating user. A task that has not moved reports nothing that cycle — the same dedup that keeps task IDs out of metric dimensions — so read this as change activity, not as a census of the window. | Count |
| Metric name | Metric key | Description | Unit |
|---|---|---|---|
| Policy packages | fortimanager.policy_packages | Presence signal (constant 1) per policy package defined in an ADOM, carrying its name, type (package vs. folder) and parent folder. The package inventory that fortimanager.policy_package.install_status cross-references by name. | Count |
| Policy package install status | fortimanager.policy_package.install_status | Whether a specific policy package's installation is in sync (1 = installed) or not (0 = out of sync or any other reported state) on a given device/VDOM target. The largest-cardinality metric in this extension (one series per package x device x VDOM target) — narrow the adom_scope configuration field to control series count. | State |
| Metric name | Metric key | Description | Unit |
|---|---|---|---|
| ADOM device inventory by OS version | fortimanager.adom.devices | Count of devices within an ADOM grouped by restricted product set and OS version. Answers "how many devices in this ADOM are on which firmware" for upgrade-campaign planning. | Count |
| ADOM workspace lock status | fortimanager.adom.workspace_locked | Whether an ADOM's workspace is currently locked for editing, and by whom. A locked workspace blocks other administrators from making changes until it is released. | State |
| Metric name | Metric key | Description | Unit |
|---|---|---|---|
| FortiManager API successful calls | sfm.fortimanager.api.successful_calls | Number of FortiManager JSON-RPC calls that returned status.code 0 in the last self-monitoring window, split by endpoint. A health signal for the extension's own connectivity, not for the managed estate. | Count |
| FortiManager API failed calls | sfm.fortimanager.api.failed_calls | Number of FortiManager JSON-RPC calls that failed (non-zero status.code or HTTP error) in the last self-monitoring window, split by endpoint, vendor error code and error class. The first place to look when the extension reports a non-OK status. | Count |
| FortiManager API response time | sfm.fortimanager.api.response_time | Mean elapsed time of FortiManager JSON-RPC calls in the last self-monitoring window, split by endpoint. Flags a slow or overloaded FortiManager before it starts timing out. | MilliSecond |
| FortiManager session re-authentications | sfm.fortimanager.session.reauth | Number of forced session re-logins in the last self-monitoring window, split by reason (idle timeout, invalid session, forced). Session auth mode only — token mode never reports this metric. | Count |
| Collection cycle duration | sfm.fortimanager.collection.duration | Wall-clock duration of each feature set's collection callback in the last self-monitoring window. Identifies which feature set is slow before it risks overrunning its interval. | Second |