


















Skip to technology filters Skip to main content
Dynatrace Hub

Extend the platform,
empower your team.

Popular searches:
Home hero bg
Data ObservabilityData Observabilitycoming soon
Data Observability

Data Observability

coming soon

Monitor Snowflake health, queries, and credit costs — directly inside Dynatrace.

App
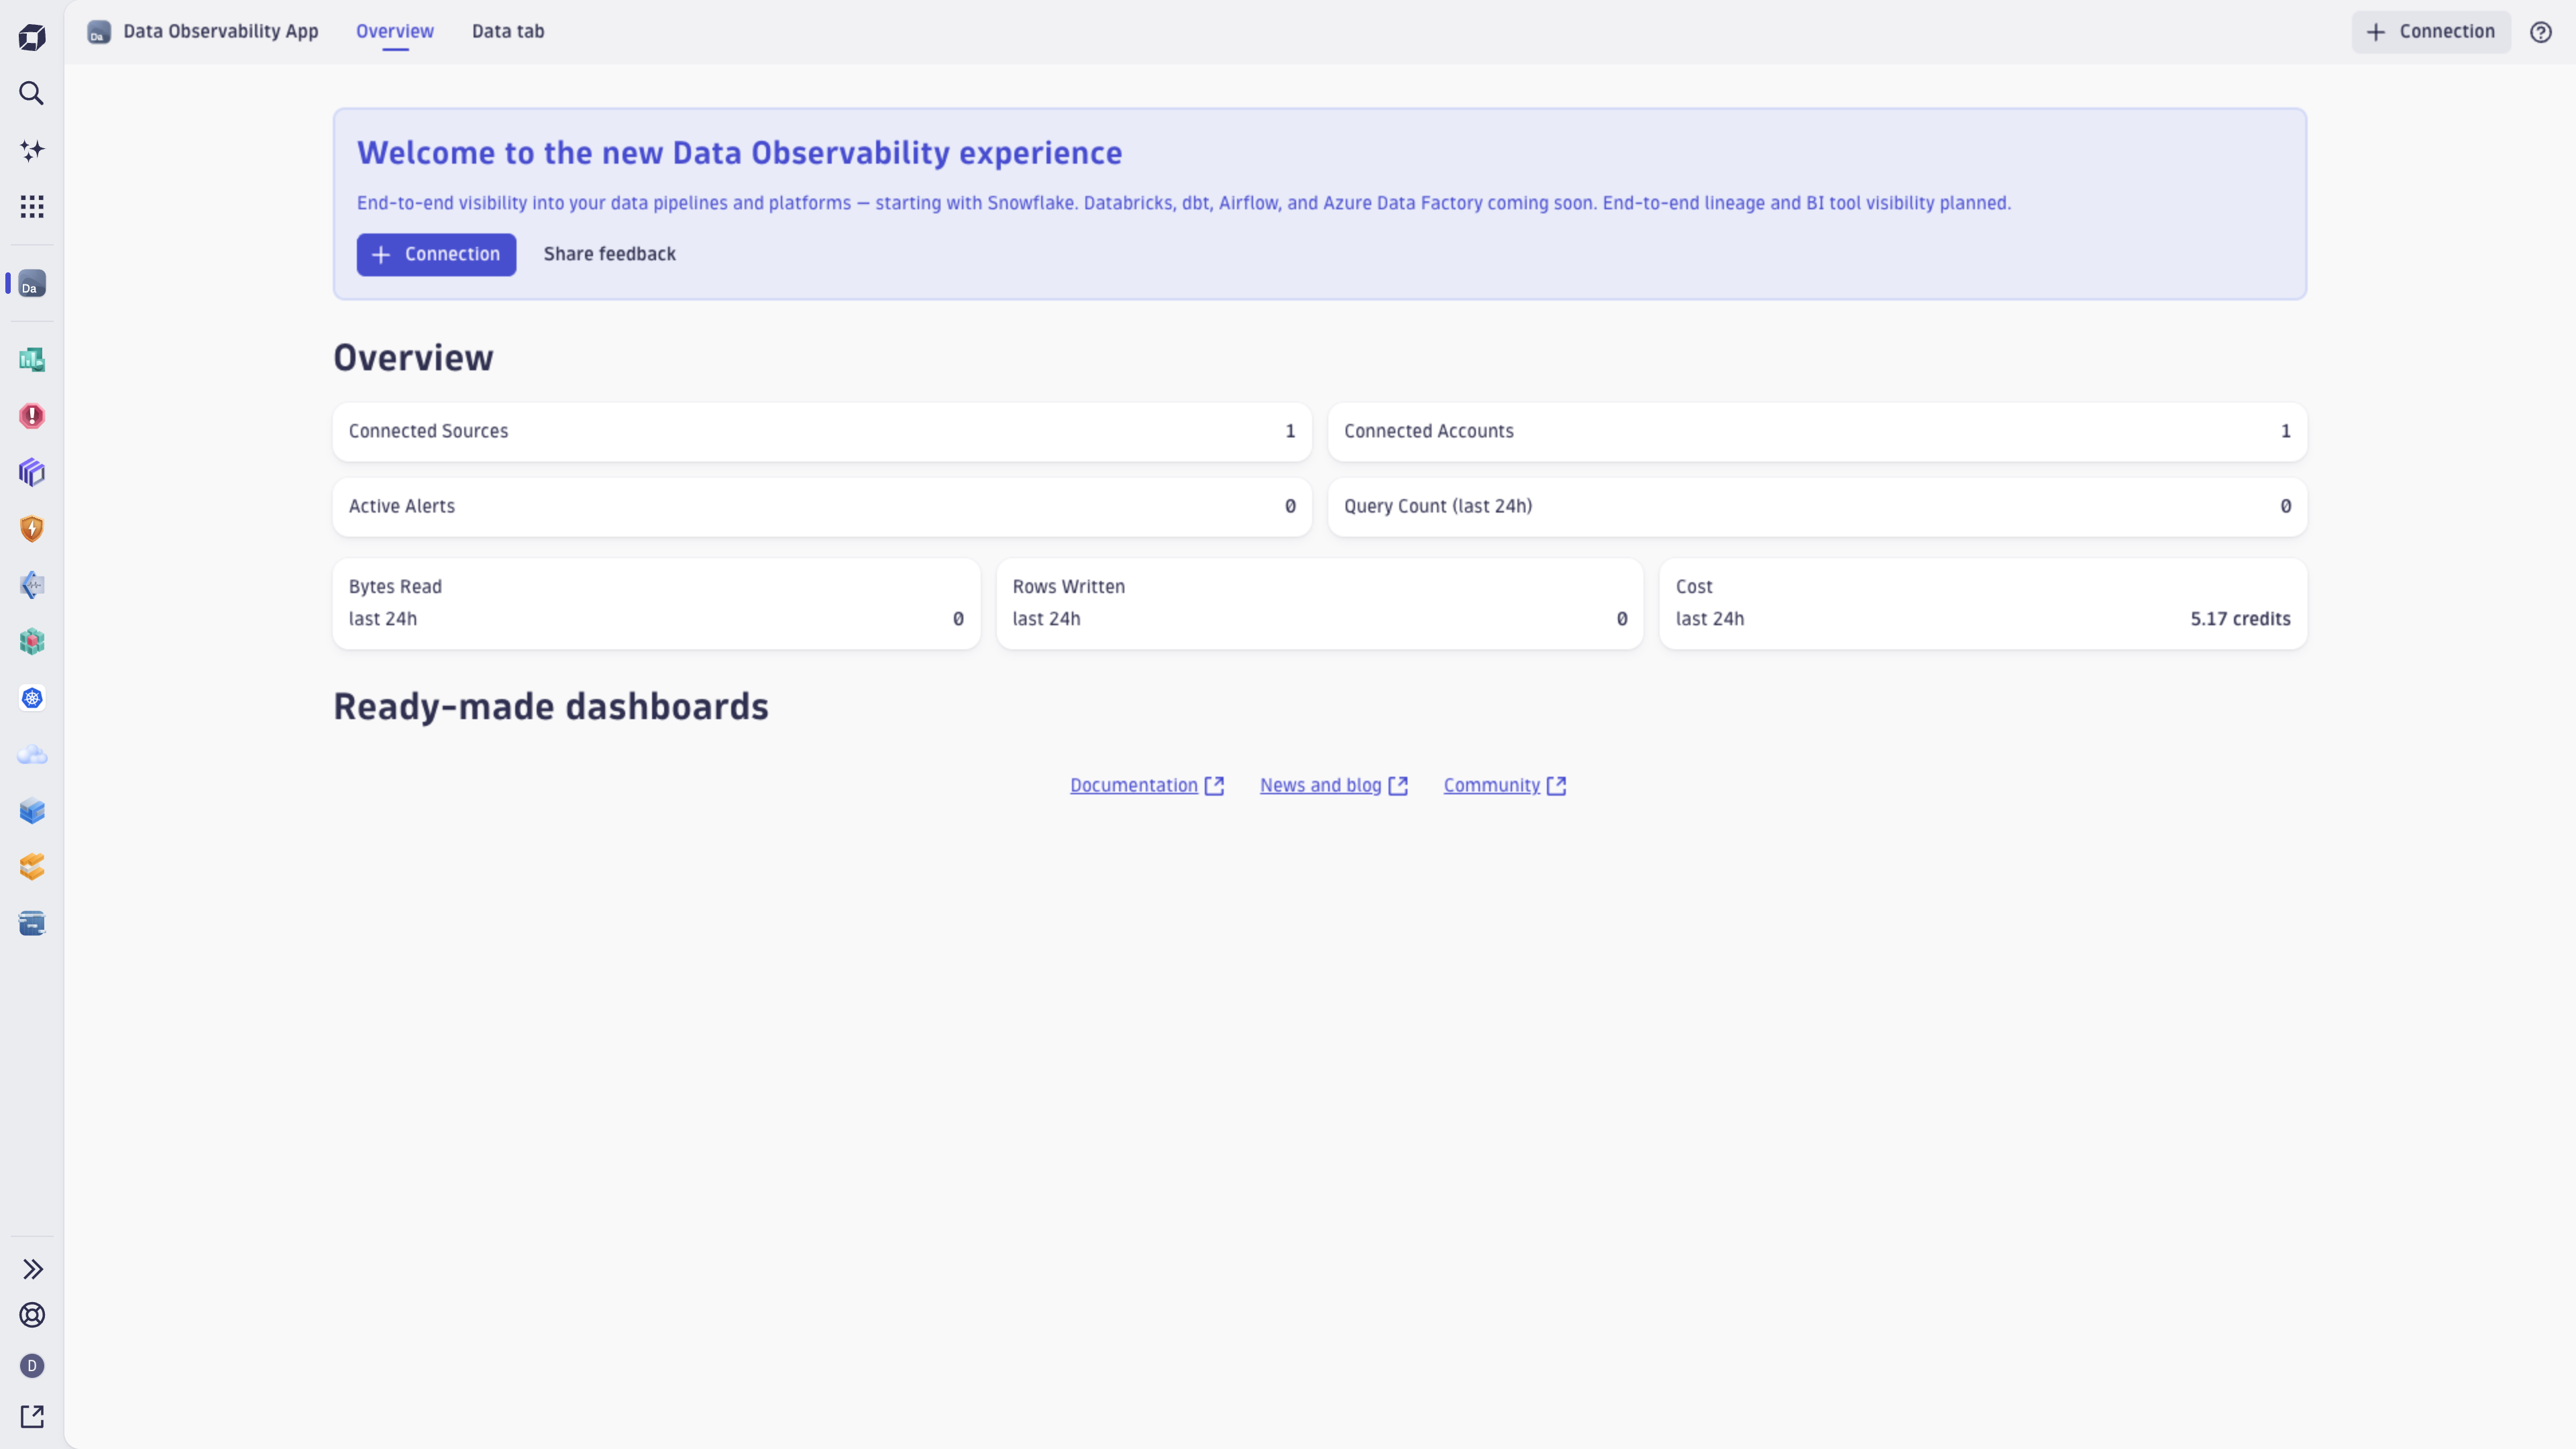
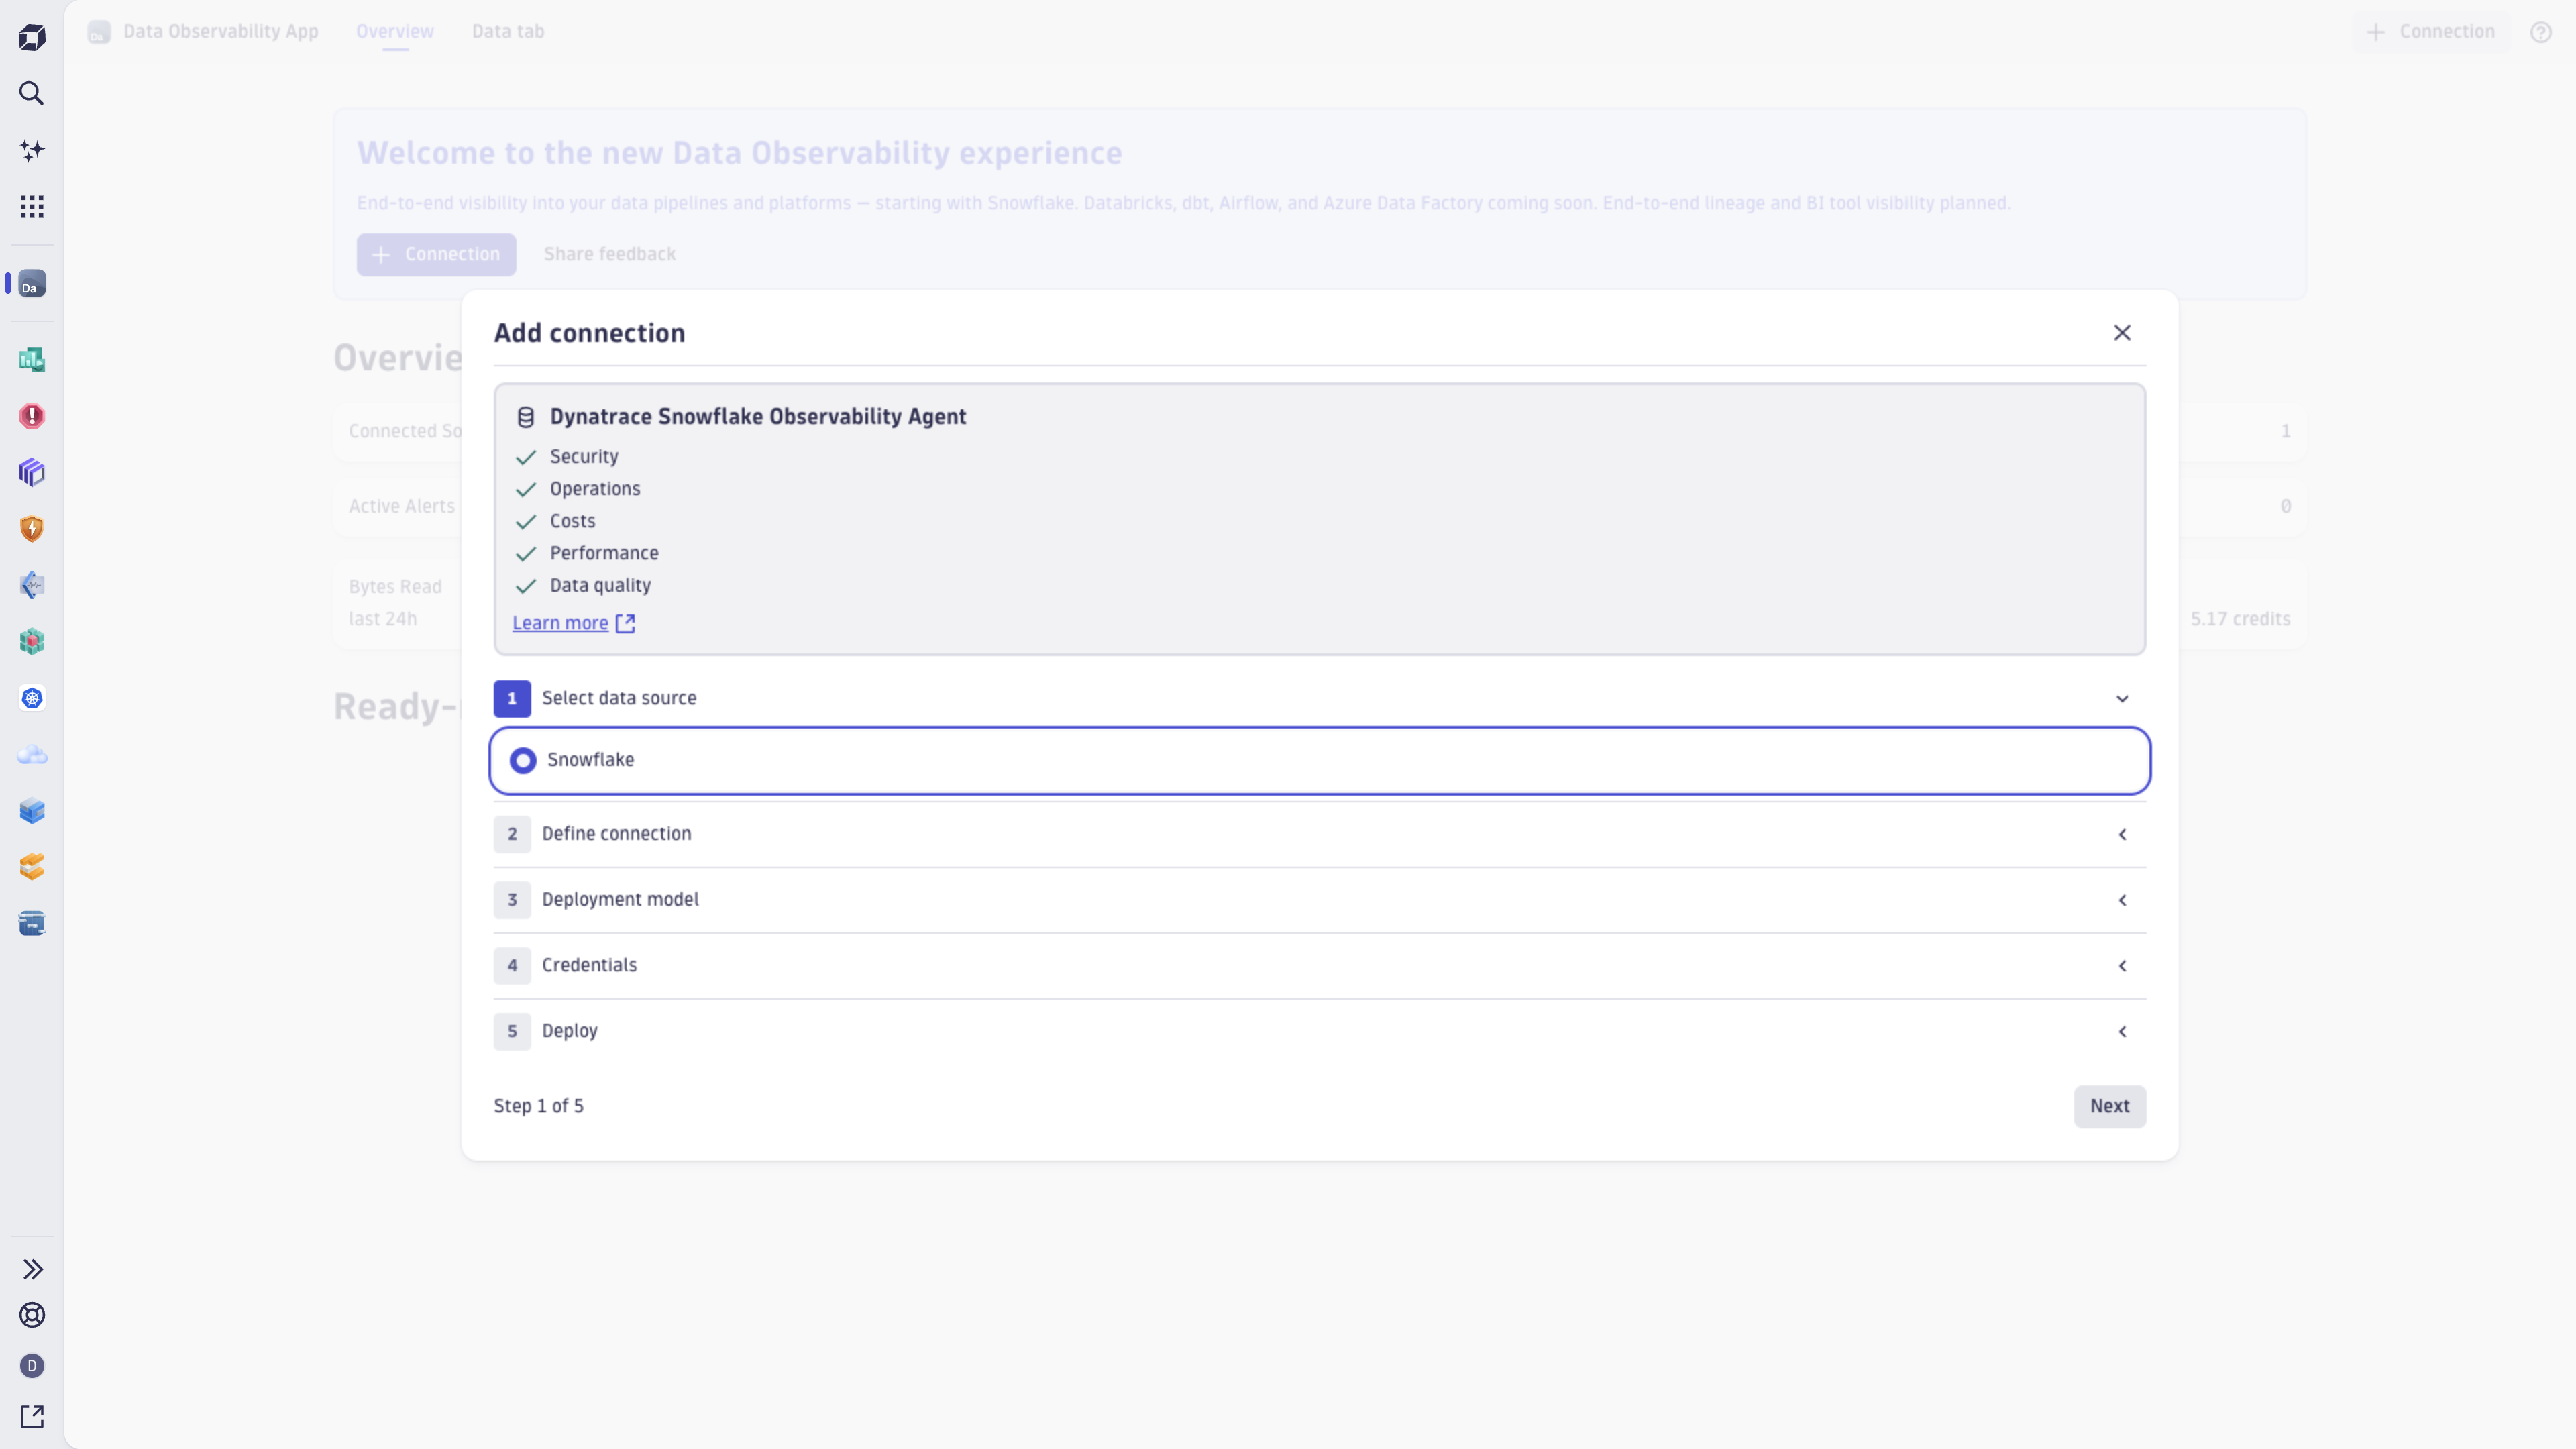
Data Observability application main screenDynatrace Snowflake Observability Agent connection configuration wizard
  • Product information

Overview

The Data Observability application connects your Snowflake account to Dynatrace through a guided setup wizard — giving you warehouse health, query performance, credit consumption, and Davis AI anomaly detection in one place, without deploying external agents or writing code.

This is intended for users who:

  • Monitor Snowflake warehouse health alongside application observability in Dynatrace
  • Need credit consumption and cost attribution by warehouse or team
  • Want proactive alerting on credit burn, saturation, or query failures before users are affected

Use cases

  • Incident triage for Data Engineers: When a Dynatrace Problem fires, you navigate directly to the affected Snowflake warehouse and the specific query responsible — without switching to the Snowflake Query History UI.
  • Cost attribution for Data Platform Lead: You get warehouse-level credit consumption and cost trend dashboards out of the box. Attribute Snowflake spend by warehouse and team without manually exporting data from Snowflake.
  • Unified observability for Platform SREs: Snowflake warehouse incidents surface alongside application and infrastructure Problems in the same Dynatrace timeline. Assess the blast radius of a warehouse anomaly without context-switching between tools.

Get started

Open the Data Observability App, navigate to Connections, and click + Connection to launch the setup wizard. The wizard guides you through:

  1. Snowflake account connection and service account setup (one-time; elevated access required only here)
  2. Warehouse and database scope selection
  3. Telemetry module selection
  4. Connectivity validation and first telemetry confirmation

Setup completes in under 30 minutes. Your Snowflake credentials are never held by Dynatrace after initial setup.

Core modules are pre-selected by default: warehouse health, query performance, and credit consumption.

Advanced modules — task graphs, dynamic table refresh, schema changes, cost budgets, Snowpipe ingestion, Trust Center security findings, and user governance — can be enabled or disabled at any time without re-running the wizard.

Details

Anomaly detection

Three ready-made alert policies activate automatically, creating alerts when the following conditions are met:

  • Credit burn spike — auto-baselining on warehouse credit consumption; active after a 7-day learning period
  • Warehouse saturation — sustained high concurrency load
  • Query failure rate — threshold-based, over a 1-hour window

Each of these alerts deep links to a runbook.

Auto-provisioned dashboards

Data Observability ships with several ready-made dashboards:

  • Query Performance
  • Costs Monitoring
  • Self-Monitoring

Additional dashboards will be available, once their corresponding modules are enabled:

  • Budgets & FinOps
  • Tasks & Pipelines
  • Snowpipe
  • Data Volume & Storage
  • Snowflake Security
Dynatrace
By Dynatrace
Dynatrace support center
Subscribe to new releases
Copy to clipboard
Dynatrace Hub
Get data into DynatraceBuild your own app
Dynatrace Intelligence - Agentic Operations SystemThe Dynatrace Agentic AI ecosystem
All (915)Log Management and AnalyticsKubernetesAI and LLM ObservabilityInfrastructure ObservabilitySoftware DeliveryApplication ObservabilityApplication SecurityBusiness ObservabilityDigital Experience
Filter
Type
Built and maintained by
Deployment model
SaaS
  • SaaS
  • Managed
Partner FinderBecome a partnerDynatrace Developer

Discover recent additions to Dynatrace

Dynatrace Assist logo

Dynatrace Assist

Dynatrace Assist: Ask, analyze, and act with Dynatrace Intelligence.

Smartscape logo

Smartscape

Interactively explore and analyze topology and relationships in digital systems.

Compliance Assistant logo

Compliance Assistant

Track, manage, and automate compliance across your IT and business landscape.

Experience Vitals logo

Experience Vitals

Optimize UX with core vitals, frontend error tracking, and end-to-end visibility.

Error Inspector logo

Error Inspector

Discover, triage, and manage errors across all your frontends.

Users & Sessions logo

Users & Sessions

Discover how users and cohorts with common characteristics experience your app.

Analyze your data

Understand your data better with deep insights and clear visualizations.

Notebooks logo

Notebooks

Create powerful, data-driven documents for custom analytics and collaboration.

Dashboards logo

Dashboards

Transform complex data into clear visualizations with custom dashboards.

Investigations logo

Investigations

Fast and precise incident response on Grail data with DQL queries.

Smartscape logo

Smartscape

Interactively explore and analyze topology and relationships in digital systems.

Logs logo

Logs

Explore all your logs without writing a single query.

Problems logo

Problems

Detect, explain and triage problems automatically using Dynatrace Intelligence.

Automate your processes

Turn data and answers into actions, securely, and at scale.

Workflows logo

Workflows

Automate tasks in your IT landscape and move towards autonomous operations.

Jira logo

Jira

Open, update, and close Jira tickets automatically from Dynatrace Workflows.

Slack logo

Slack

Automate Slack messaging for security incidents, attacks, remediation, and more.

Secure your cloud application

See vulnerabilities and attacks in your environment.

Security Posture Management logo

Security Posture Management

Detect, prioritize, and remediate security and compliance findings with SPM.

Threats & Exploits logo

Threats & Exploits

Understand, triage, and investigate detection findings and alerts.

More resources

Observability for Developers on Cursor logo

Observability for Developers on Cursor

Get Real time Code-Level data directly to your Cursor IDE.

Documents logo

Documents

Manage Dashboards, Notebooks and other documents in your Dynatrace environment.

GitHub Copilot Coding Agent logo

GitHub Copilot Coding Agent

Automate vulnerability remediation and boost developer productivity.

GitHub Copilot Custom Agent logo

GitHub Copilot Custom Agent

Automate your development workflows with specialized agent definitions.

Observability for Developer on JetBrains logo

Observability for Developer on JetBrains

Get real-time code-level data directly to your Jetbrains IDE.

Metrics logo

Metrics

Browse, search, and manage all your metrics in one central catalog.

Pagerduty for Dynatrace Workflows logo

Pagerduty for Dynatrace Workflows

Streamline incident management with automated Pageruty workflows.

Cursor IDE logo

Cursor IDE

Boost developer productivity and get real-time, code-level insights into Cursor.

Observability for Developers on Windsurf logo

Observability for Developers on Windsurf

Get real-time code-level data directly to your Windsurf IDE.

Are you looking for something different?

We have hundreds of apps, extensions, and other technologies to customize your environment

Leverage our newest innovations of Dynatrace Saas

Kick-start your app creation

Kick-start your app creation

Whether you’re a beginner or a pro, Dynatrace Developer has the tools and support you need to create incredible apps with minimal effort.
Go to Dynatrace Developer

Upgrading from Dynatrace Managed to SaaS

Upgrading from Dynatrace Managed to SaaS

Drive innovation, speed, and agility in your organization by seamlessly and securely upgrading.
Learn More
Log Management and Analytics

Log Management and Analytics

Innovate faster and more efficiently with unified log management and log analytics for actionable insights and automation.
Learn more