
Skip to technology filters Skip to main content
Dynatrace Hub

Extend the platform,
empower your team.

Popular searches:
Home hero bg
blueboxbluebox
bluebox

bluebox

Helping agents ship code you trust to prod.

Technology
Free trialDocumentation
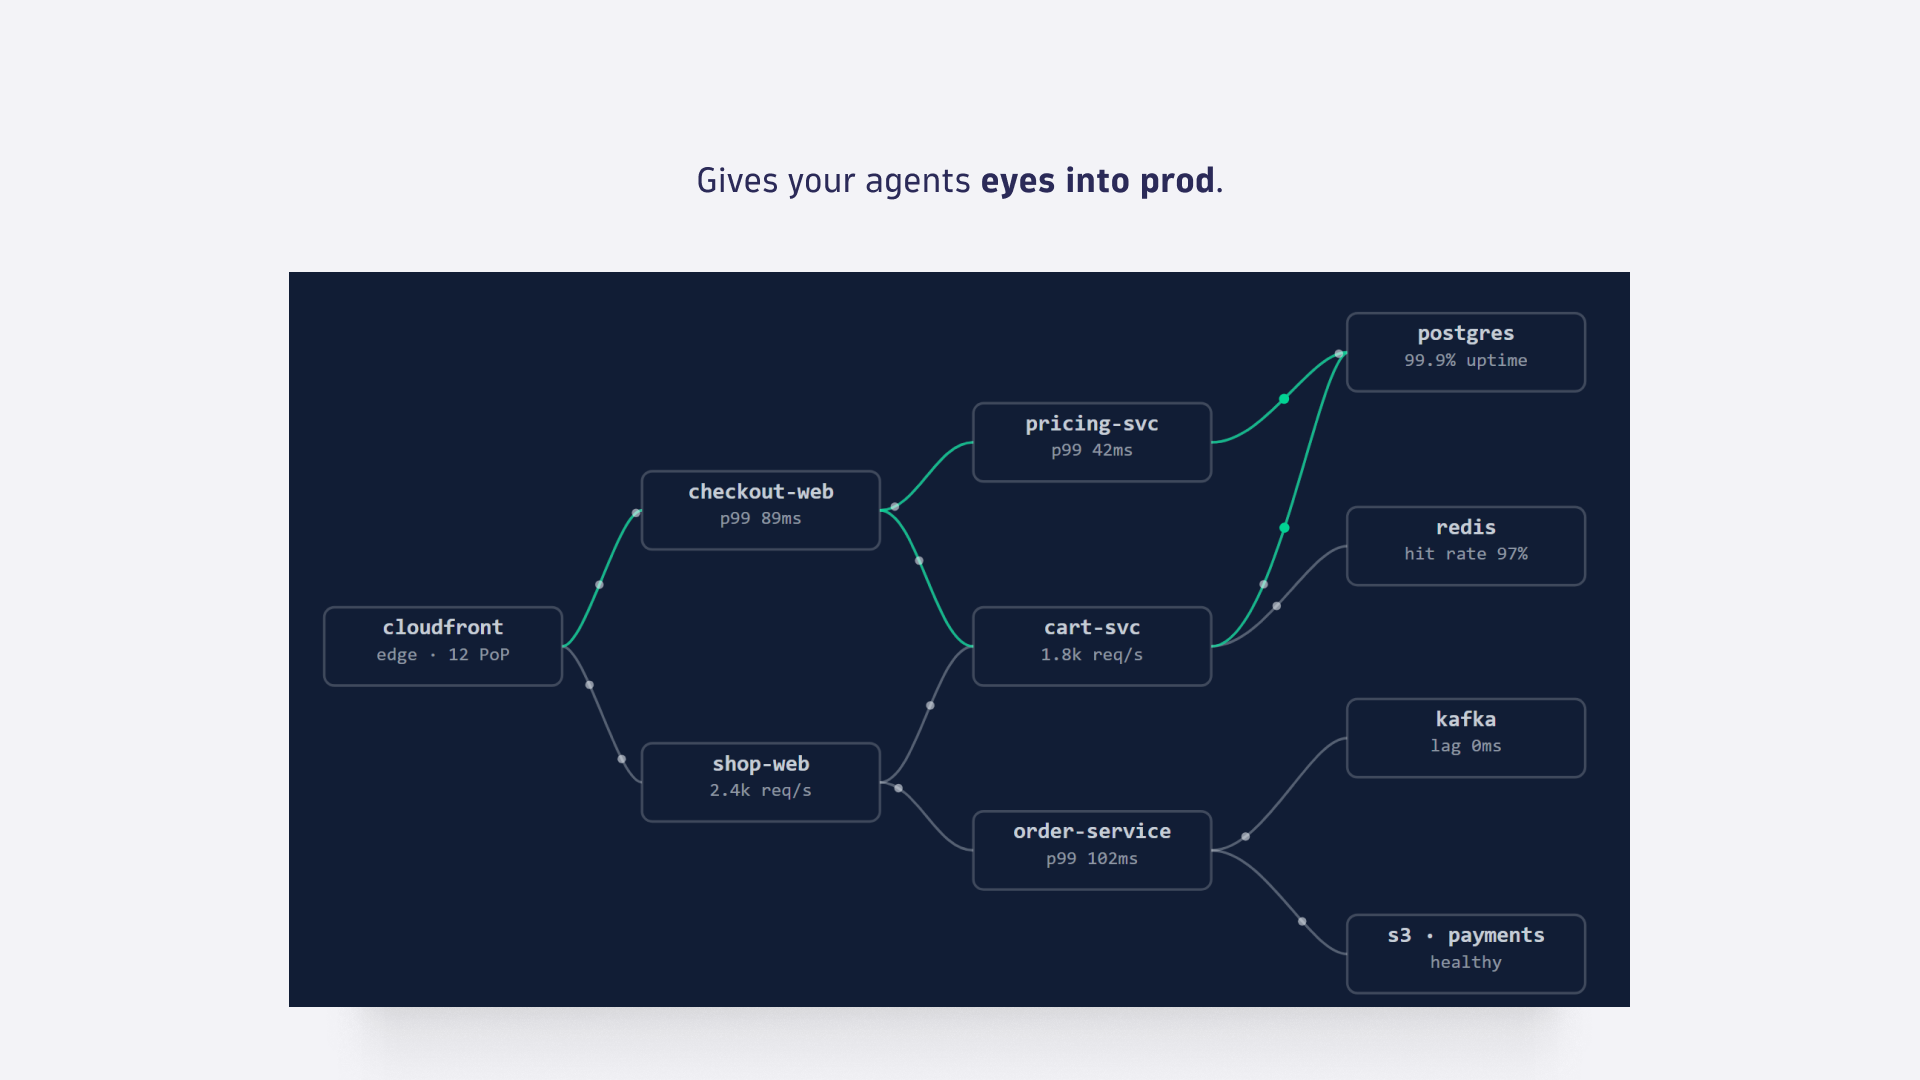
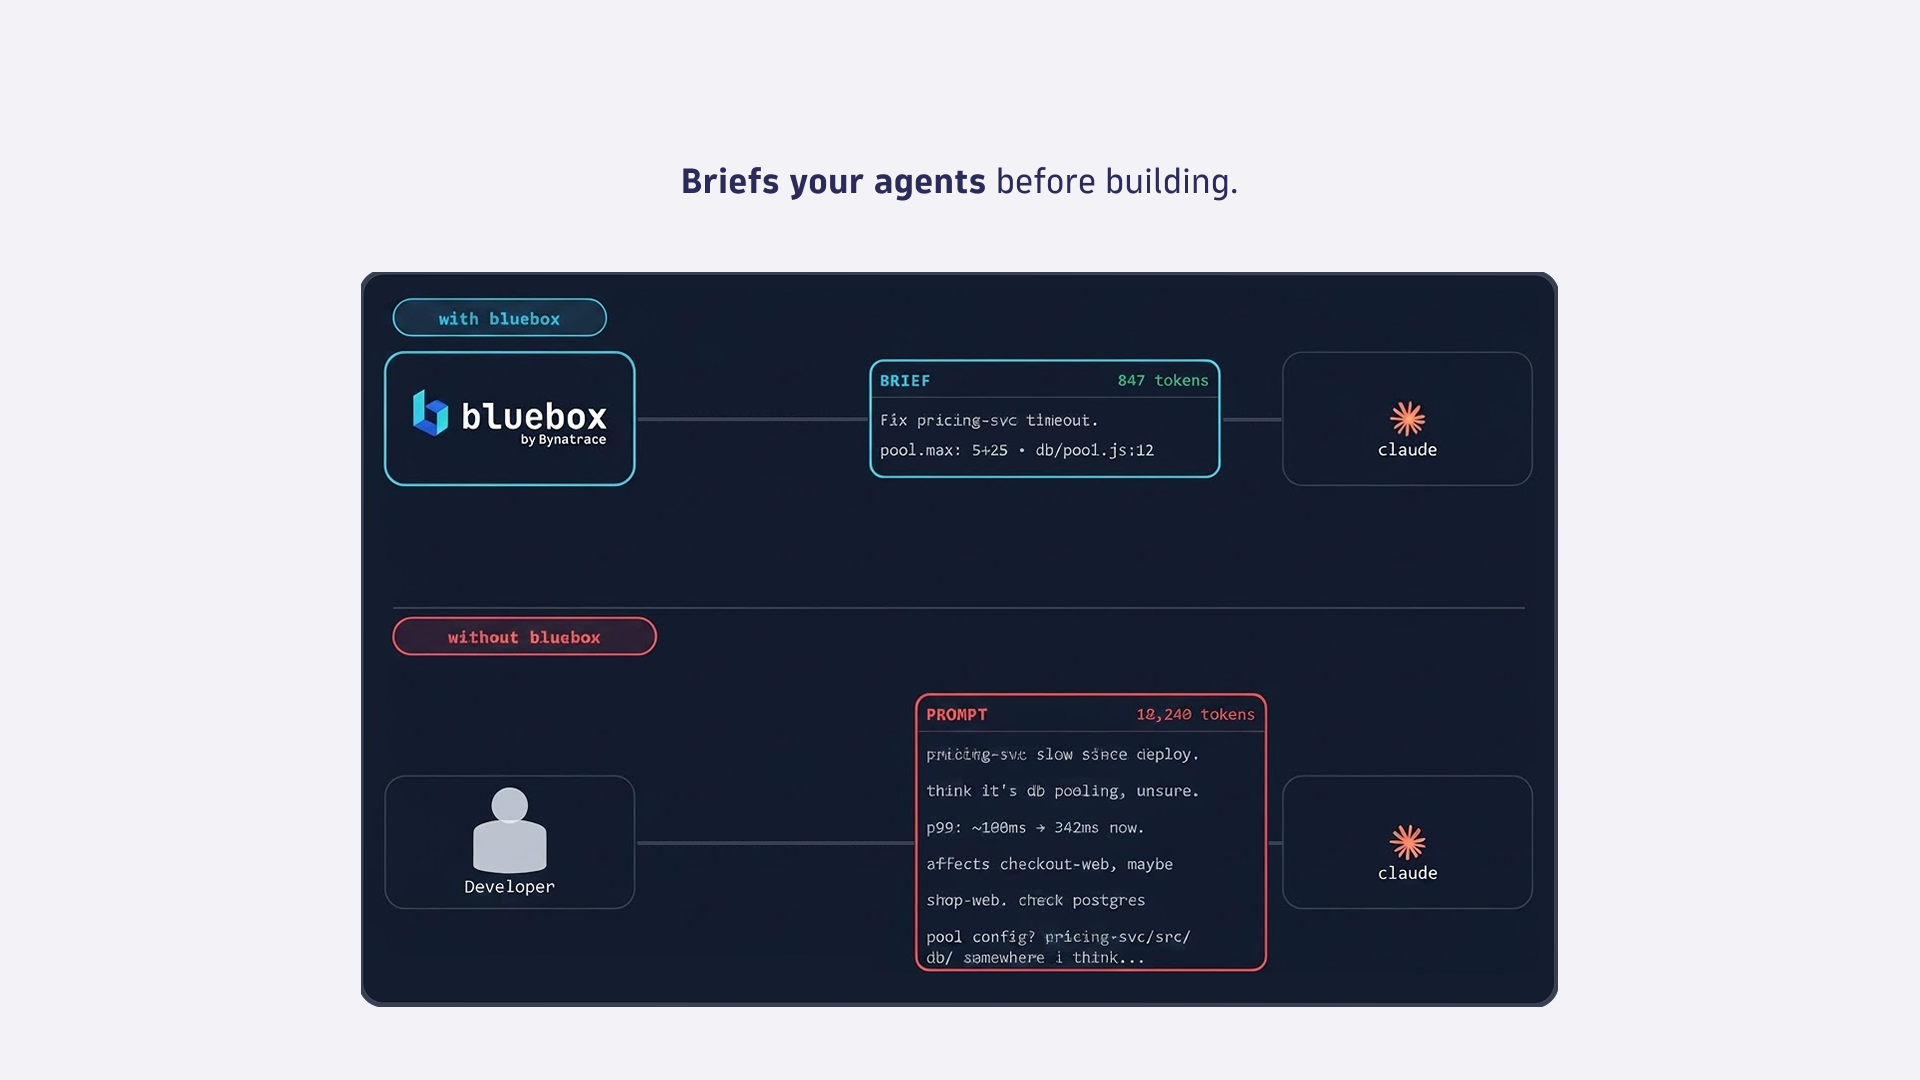
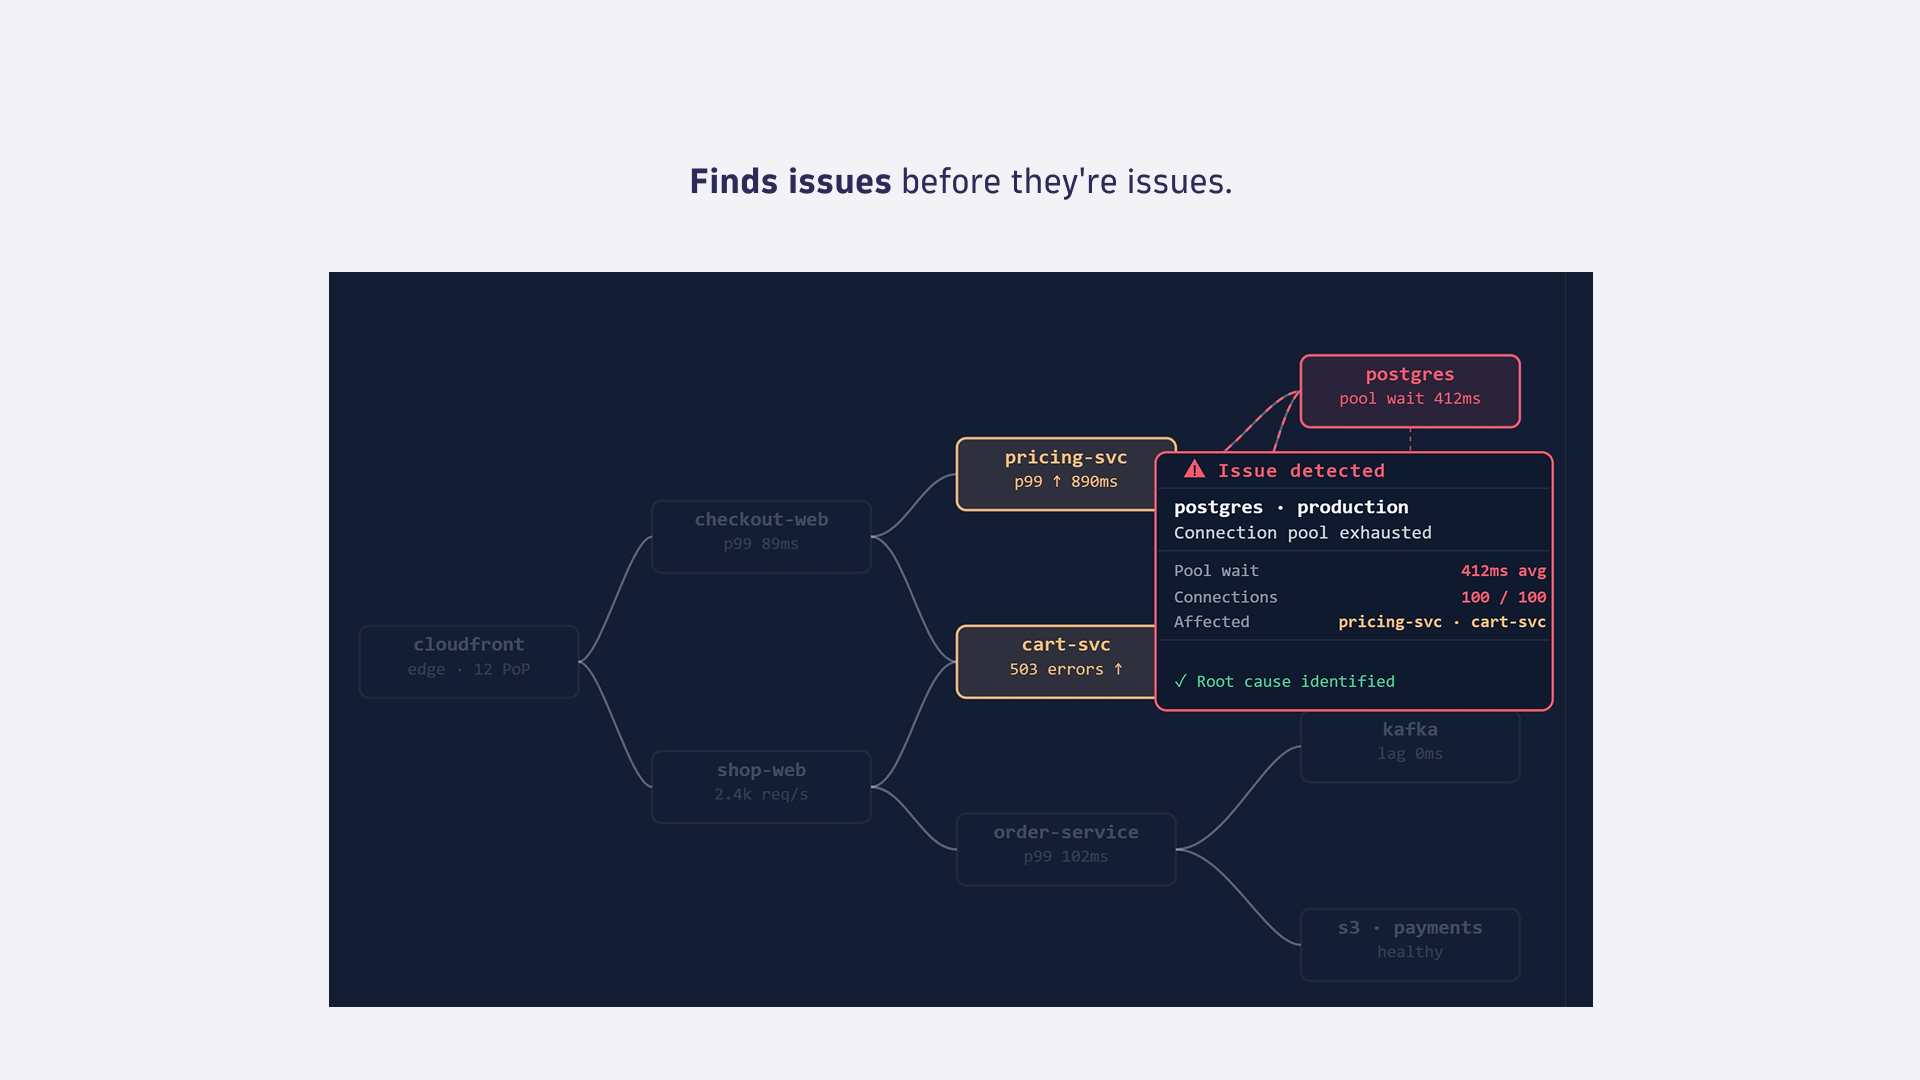
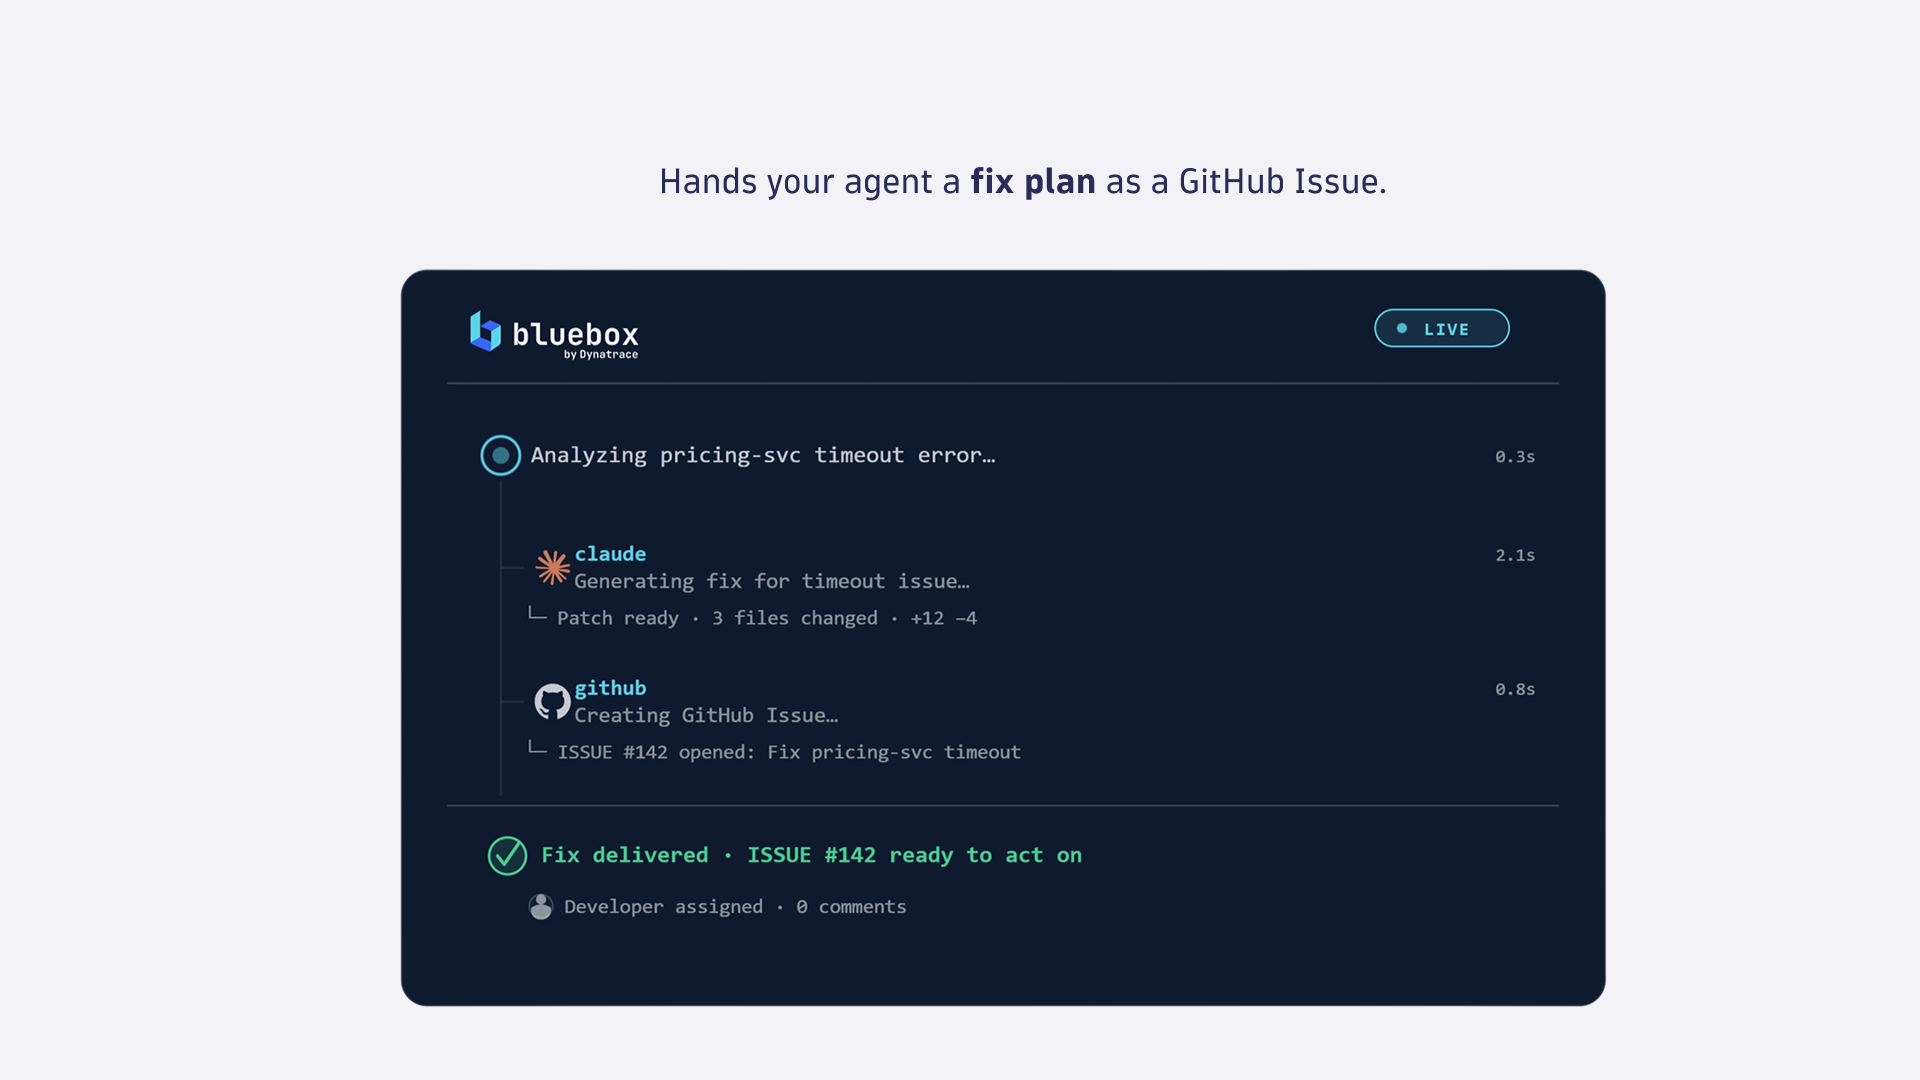
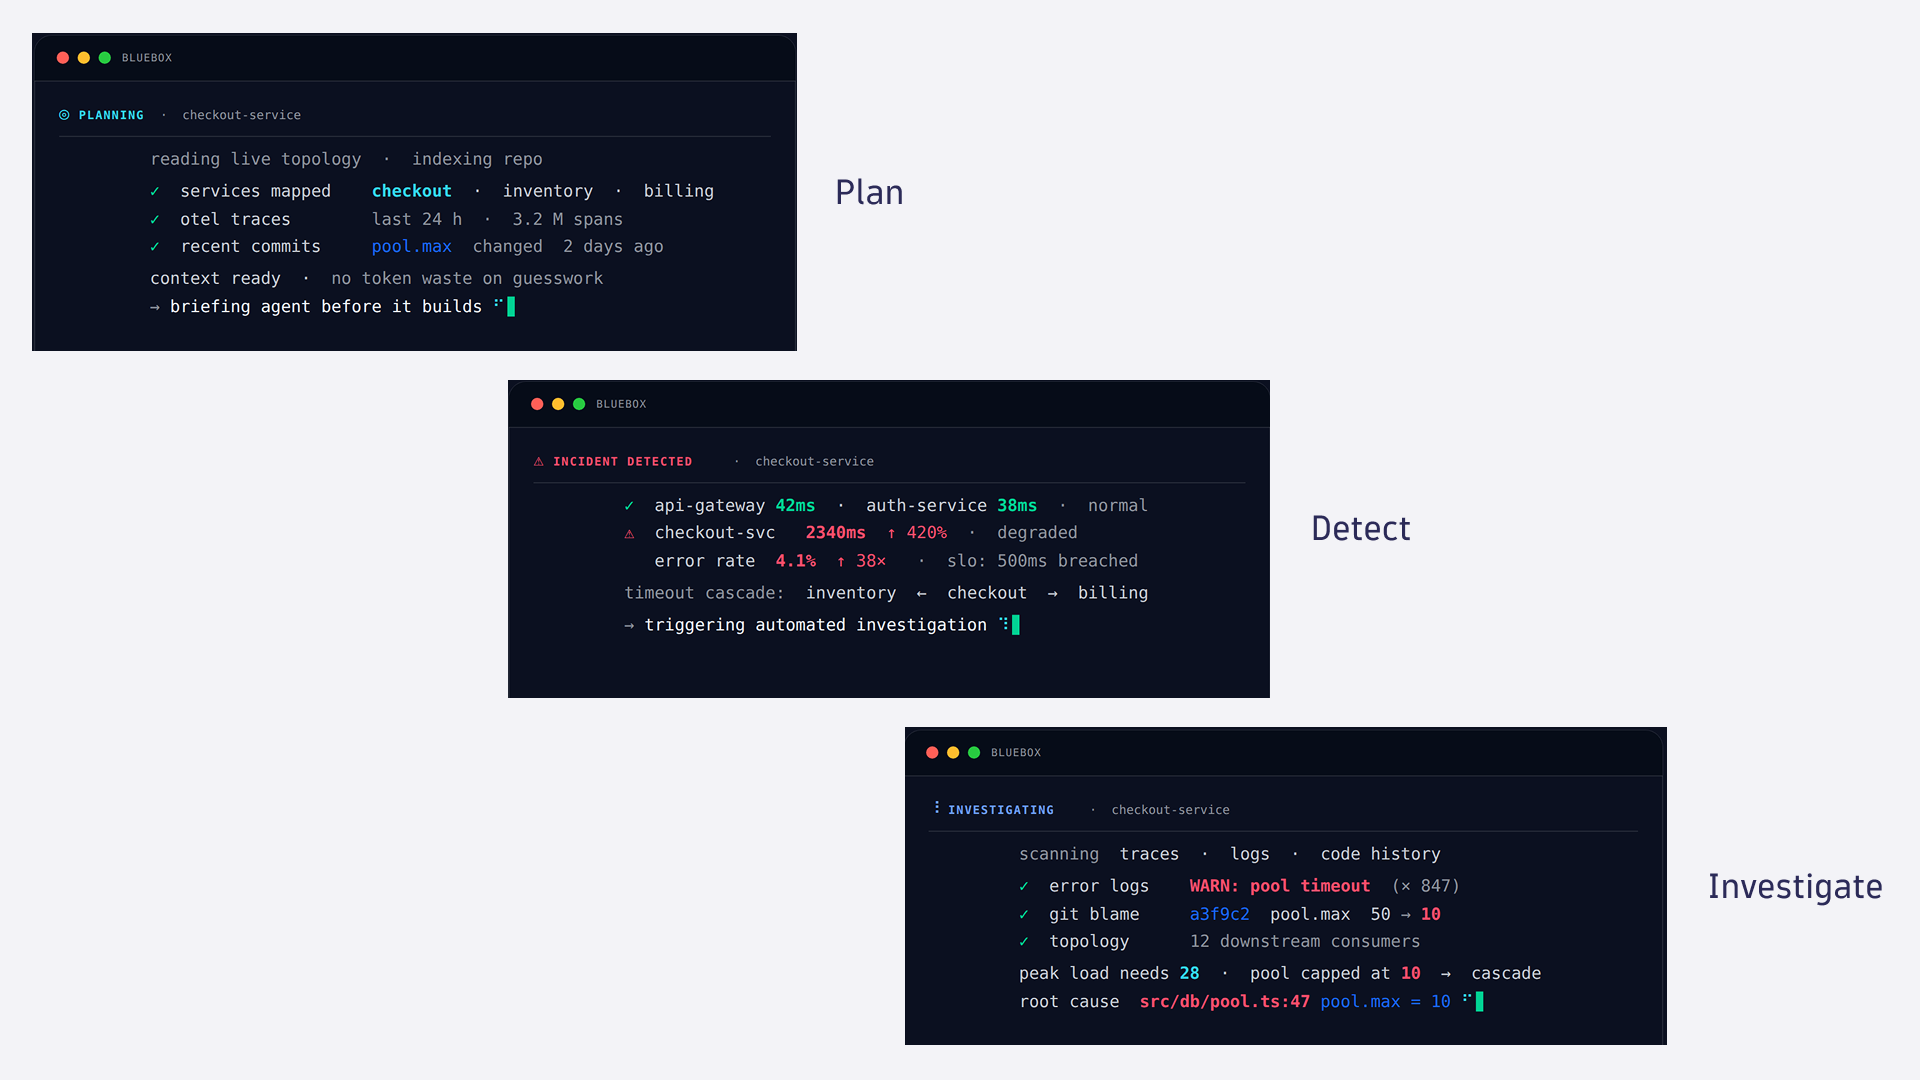
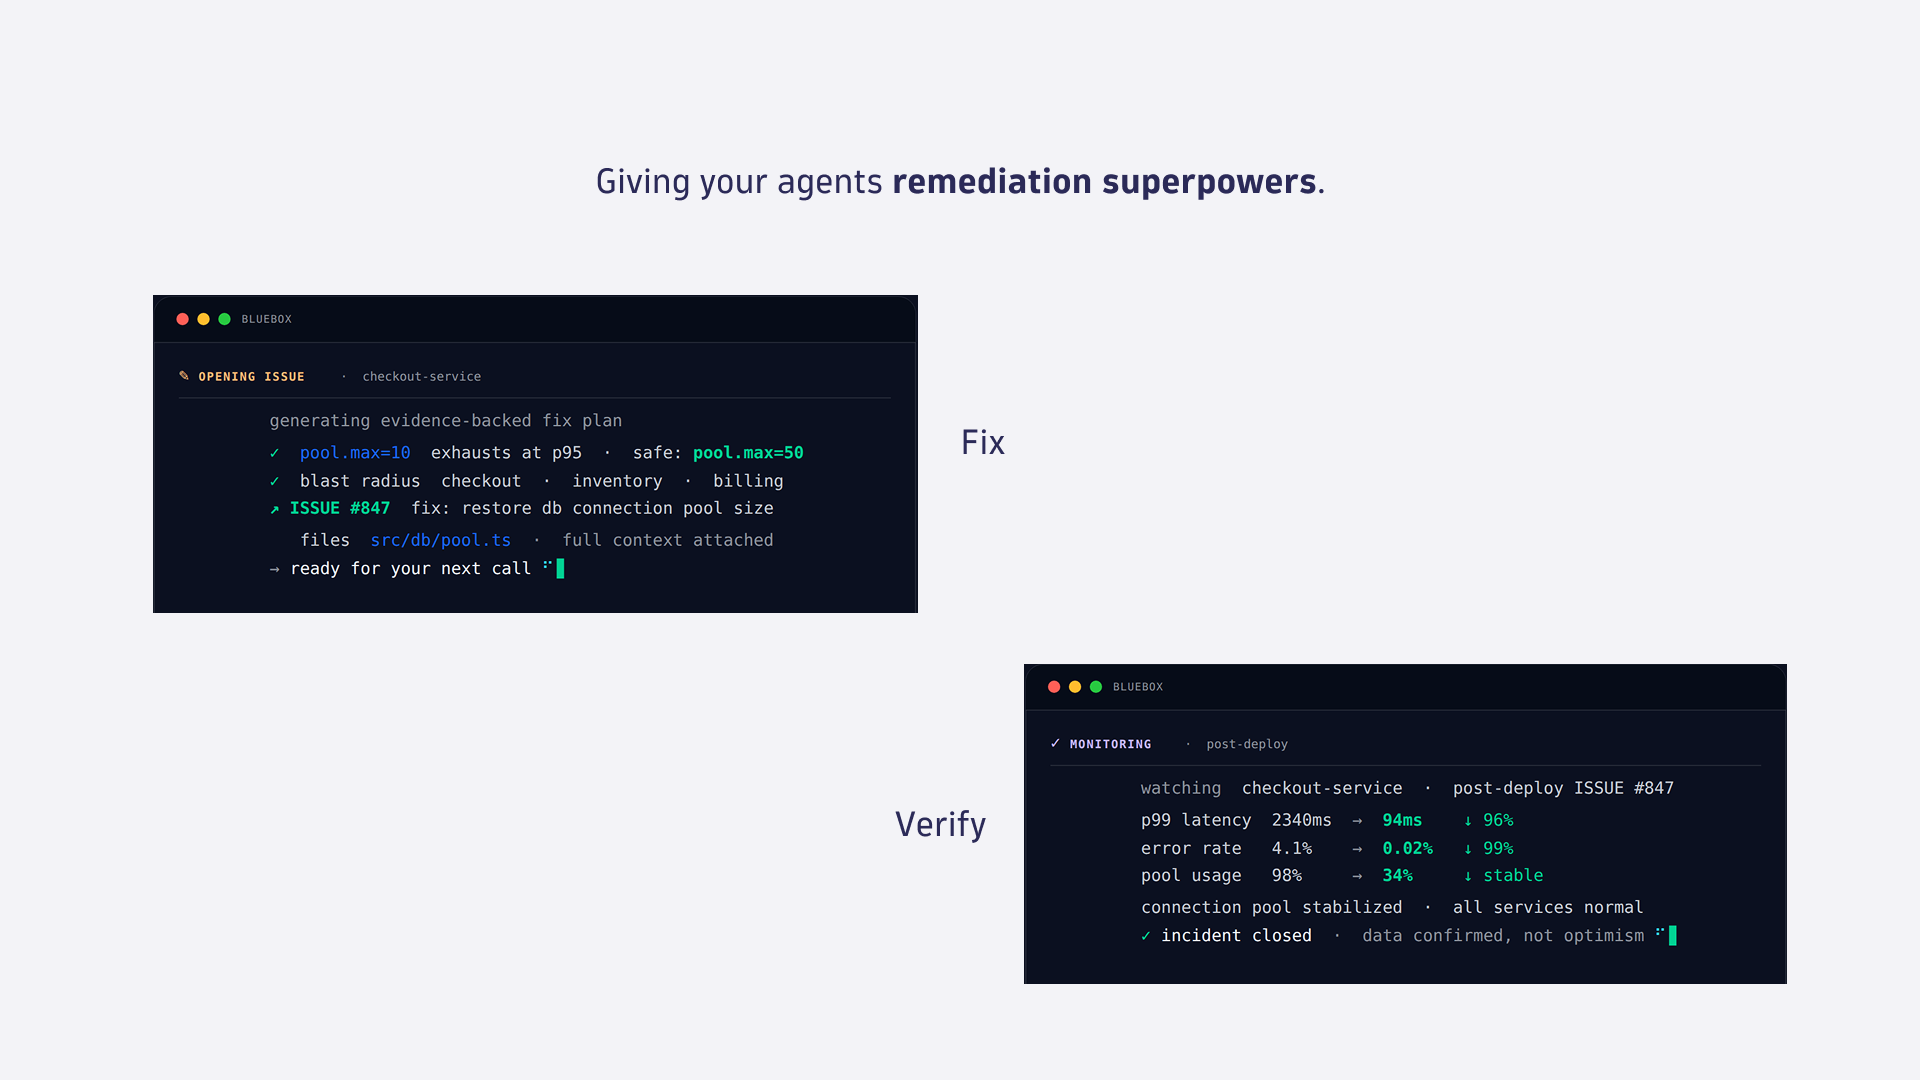
Gives your agents eyes into prod.Brief your agents before building.Finds issues before they're issues.Hands your agent a fix plan as a GitHub Issue.Giving your agents superpowers: Plan, Detect, Investigate ...Giving your agents superpowers: ... Fix and Verify.
  • Product information

Overview

Bluebox by Dynatrace gives your coding agents the one thing they don't have on their own: runtime context. It scans your repo, maps your live topology, and watches production signals continuously, so agents reason against what your system actually does, not just what the code says it should do. When an issue shows up in production, Bluebox investigates it with full context, traces, logs, topology, and the live code path, identifies the actual commit and code path at fault, and hands your coding agent a GitHub Issue with the evidence already attached. Your agent (or you) decides what happens next; Bluebox never pushes a fix on its own.

Give your agents observability superpowers

  • Automatic topology and OTel discovery. Scans your repo to find every service, database, and dependency, and guides you through OpenTelemetry instrumentation if you don't have it already.
  • Continuous production monitoring. Watches latency, error rates, and SLOs across your services, and only surfaces the signal that matters.
  • Root cause in your code, not just infrastructure noise. Correlates traces, logs, and topology to point at the specific commit and code path behind an incident.
  • Evidence-backed GitHub Issues. Every detected issue becomes a ready-to-act-on Issue: the trace, the offending lines, and the blast radius, so your agent can execute instead of exploring.
  • Post-deploy verification. Confirms a fix actually resolved the incident using data, not assumptions.

Trusted, open, no lock-in

  • Dynatrace-powered insights. Root cause detection runs on Dynatrace's causal AI, not pattern matching or guesswork.
  • GitHub-native output. Every fix lands as a GitHub Issue with full context attached. No new interface for your agents or your team to learn.
  • Built on OpenTelemetry. Works with your existing OTel setup, or guides you through setting one up. No vendor lock-in.Works where you work

Use cases

  • Brief your agent before it builds. Instead of a long, uncertain prompt, hand your agent a short, evidence-backed brief. Less back-and-forth, more accurate first attempts, even with smaller models.
  • Catch production issues before they pile up. Bluebox watches your services continuously and flags the moment something degrades, rather than waiting for a support ticket or a page.
  • Investigate incidents with full context. Get the trace, the log, the topology, and the responsible code path in one place instead of piecing it together across five tools.
  • Turn incidents into ready-to-fix GitHub Issues. Every issue lands with the blast radius and the fix path attached, so your agent (or your team) can act immediately.
  • Verify a fix actually worked. After deploy, Bluebox checks the same signals that flagged the incident to confirm it's resolved.

Works where you work

Bluebox works with the coding agents and environments you're already using, including Claude and Kiro, and runs on AWS.

Get started

Bluebox is a separate product from the Dynatrace platform, so sign-up happens at bluebox.ai, not inside your Dynatrace environment. Head over and sign in with GitHub to get started - no credit card is required.

πŸ‘‰Sign-up now for your free bluebox trial and equip your agents with superpowers.

Once your account is created, connect your repos and Bluebox scans them automatically to build your topology. If you don't have OpenTelemetry set up yet, Bluebox walks you through instrumentation. From there, Bluebox starts watching your production signals and will open its first GitHub Issue as soon as it detects and confirms a root cause.

Dynatrace
DocumentationMore Information
By Dynatrace
Dynatrace support center
Copy to clipboard

More resources

Blog: Why we built bluebox.

Blog: Why we built bluebox.

Software is getting built in a fundamentally different way. Over the last year, coding with agents has changed how we design, build, ship, and operate applications, and that
Read more
Sign-up to bluebox

Sign-up to bluebox

Visit app.bluebox.at and sign-up using your GitHub account. No credit-card required!
Learn more
Dynatrace Hub
Get data into DynatraceBuild your own app
Dynatrace Intelligence - Agentic Operations SystemThe Dynatrace Agentic AI ecosystem
All (922)Log Management and AnalyticsKubernetesAI and LLM ObservabilityInfrastructure ObservabilitySoftware DeliveryApplication ObservabilityApplication SecurityBusiness ObservabilityDigital Experience
Filter
Type
Built and maintained by
Partner FinderBecome a partnerDynatrace Developer

Discover recent additions to Dynatrace

Dynatrace Assist logo

Dynatrace Assist

Dynatrace Assist: Ask, analyze, and act with Dynatrace Intelligence.

Smartscape logo

Smartscape

Interactively explore and analyze topology and relationships in digital systems.

Compliance Assistant logo

Compliance Assistant

Track, manage, and automate compliance across your IT and business landscape.

Experience Vitals logo

Experience Vitals

Optimize UX with core vitals, frontend error tracking, and end-to-end visibility.

Error Inspector logo

Error Inspector

Discover, triage, and manage errors across all your frontends.

Users & Sessions logo

Users & Sessions

Discover how users and cohorts with common characteristics experience your app.

Analyze your data

Understand your data better with deep insights and clear visualizations.

Notebooks logo

Notebooks

Create powerful, data-driven documents for custom analytics and collaboration.

Dashboards logo

Dashboards

Transform complex data into clear visualizations with custom dashboards.

Investigations logo

Investigations

Fast and precise incident response on Grail data with DQL queries.

Smartscape logo

Smartscape

Interactively explore and analyze topology and relationships in digital systems.

Logs logo

Logs

Explore all your logs without writing a single query.

Problems logo

Problems

Detect, explain and triage problems automatically using Dynatrace Intelligence.

Automate your processes

Turn data and answers into actions, securely, and at scale.

Workflows logo

Workflows

Automate tasks in your IT landscape and move towards autonomous operations.

Jira logo

Jira

Open, update, and close Jira tickets automatically from Dynatrace Workflows.

Slack logo

Slack

Automate Slack messaging for security incidents, attacks, remediation, and more.

Secure your cloud application

See vulnerabilities and attacks in your environment.

Security Posture Management logo

Security Posture Management

Detect, prioritize, and remediate security and compliance findings with SPM.

Threats & Exploits logo

Threats & Exploits

Understand, triage, and investigate detection findings and alerts.

More resources

Cursor logo

Cursor

Get Real time Code-Level data directly to your Cursor IDE.

Documents logo

Documents

Manage Dashboards, Notebooks and other documents in your Dynatrace environment.

GitHub Copilot Coding Agent logo

GitHub Copilot Coding Agent

Automate vulnerability remediation and boost developer productivity.

GitHub Copilot Custom Agent logo

GitHub Copilot Custom Agent

Automate your development workflows with specialized agent definitions.

Dynatrace Live Debugger on JetBrains logo

Dynatrace Live Debugger on JetBrains

Get real-time code-level data directly to your Jetbrains IDE.

Metrics logo

Metrics

Browse, search, and manage all your metrics in one central catalog.

Pagerduty for Dynatrace Workflows logo

Pagerduty for Dynatrace Workflows

Streamline incident management with automated Pageruty workflows.

Cursor IDE logo

Cursor IDE

Boost developer productivity and get real-time, code-level insights into Cursor.

Dynatrace Live Debugger on Windsurf logo

Dynatrace Live Debugger on Windsurf

Get real-time code-level data directly to your Windsurf IDE.

Are you looking for something different?

We have hundreds of apps, extensions, and other technologies to customize your environment

Leverage our newest innovations of Dynatrace Saas

Kick-start your app creation

Kick-start your app creation

Whether you’re a beginner or a pro, Dynatrace Developer has the tools and support you need to create incredible apps with minimal effort.
Go to Dynatrace Developer
Upgrading from Dynatrace Managed to SaaS

Upgrading from Dynatrace Managed to SaaS

Drive innovation, speed, and agility in your organization by seamlessly and securely upgrading.
Learn More
Log Management and Analytics

Log Management and Analytics

Innovate faster and more efficiently with unified log management and log analytics for actionable insights and automation.
Learn more