












Skip to technology filters Skip to main content
Dynatrace Hub

Extend the platform,
empower your team.

Popular searches:
Home hero bg
AWS Strands AgentsAWS Strands Agents
AWS Strands Agents

AWS Strands Agents

Observe your AWS Strands Agents AI agents with Dynatrace AI Observability.

Technology
Free trialDocumentation
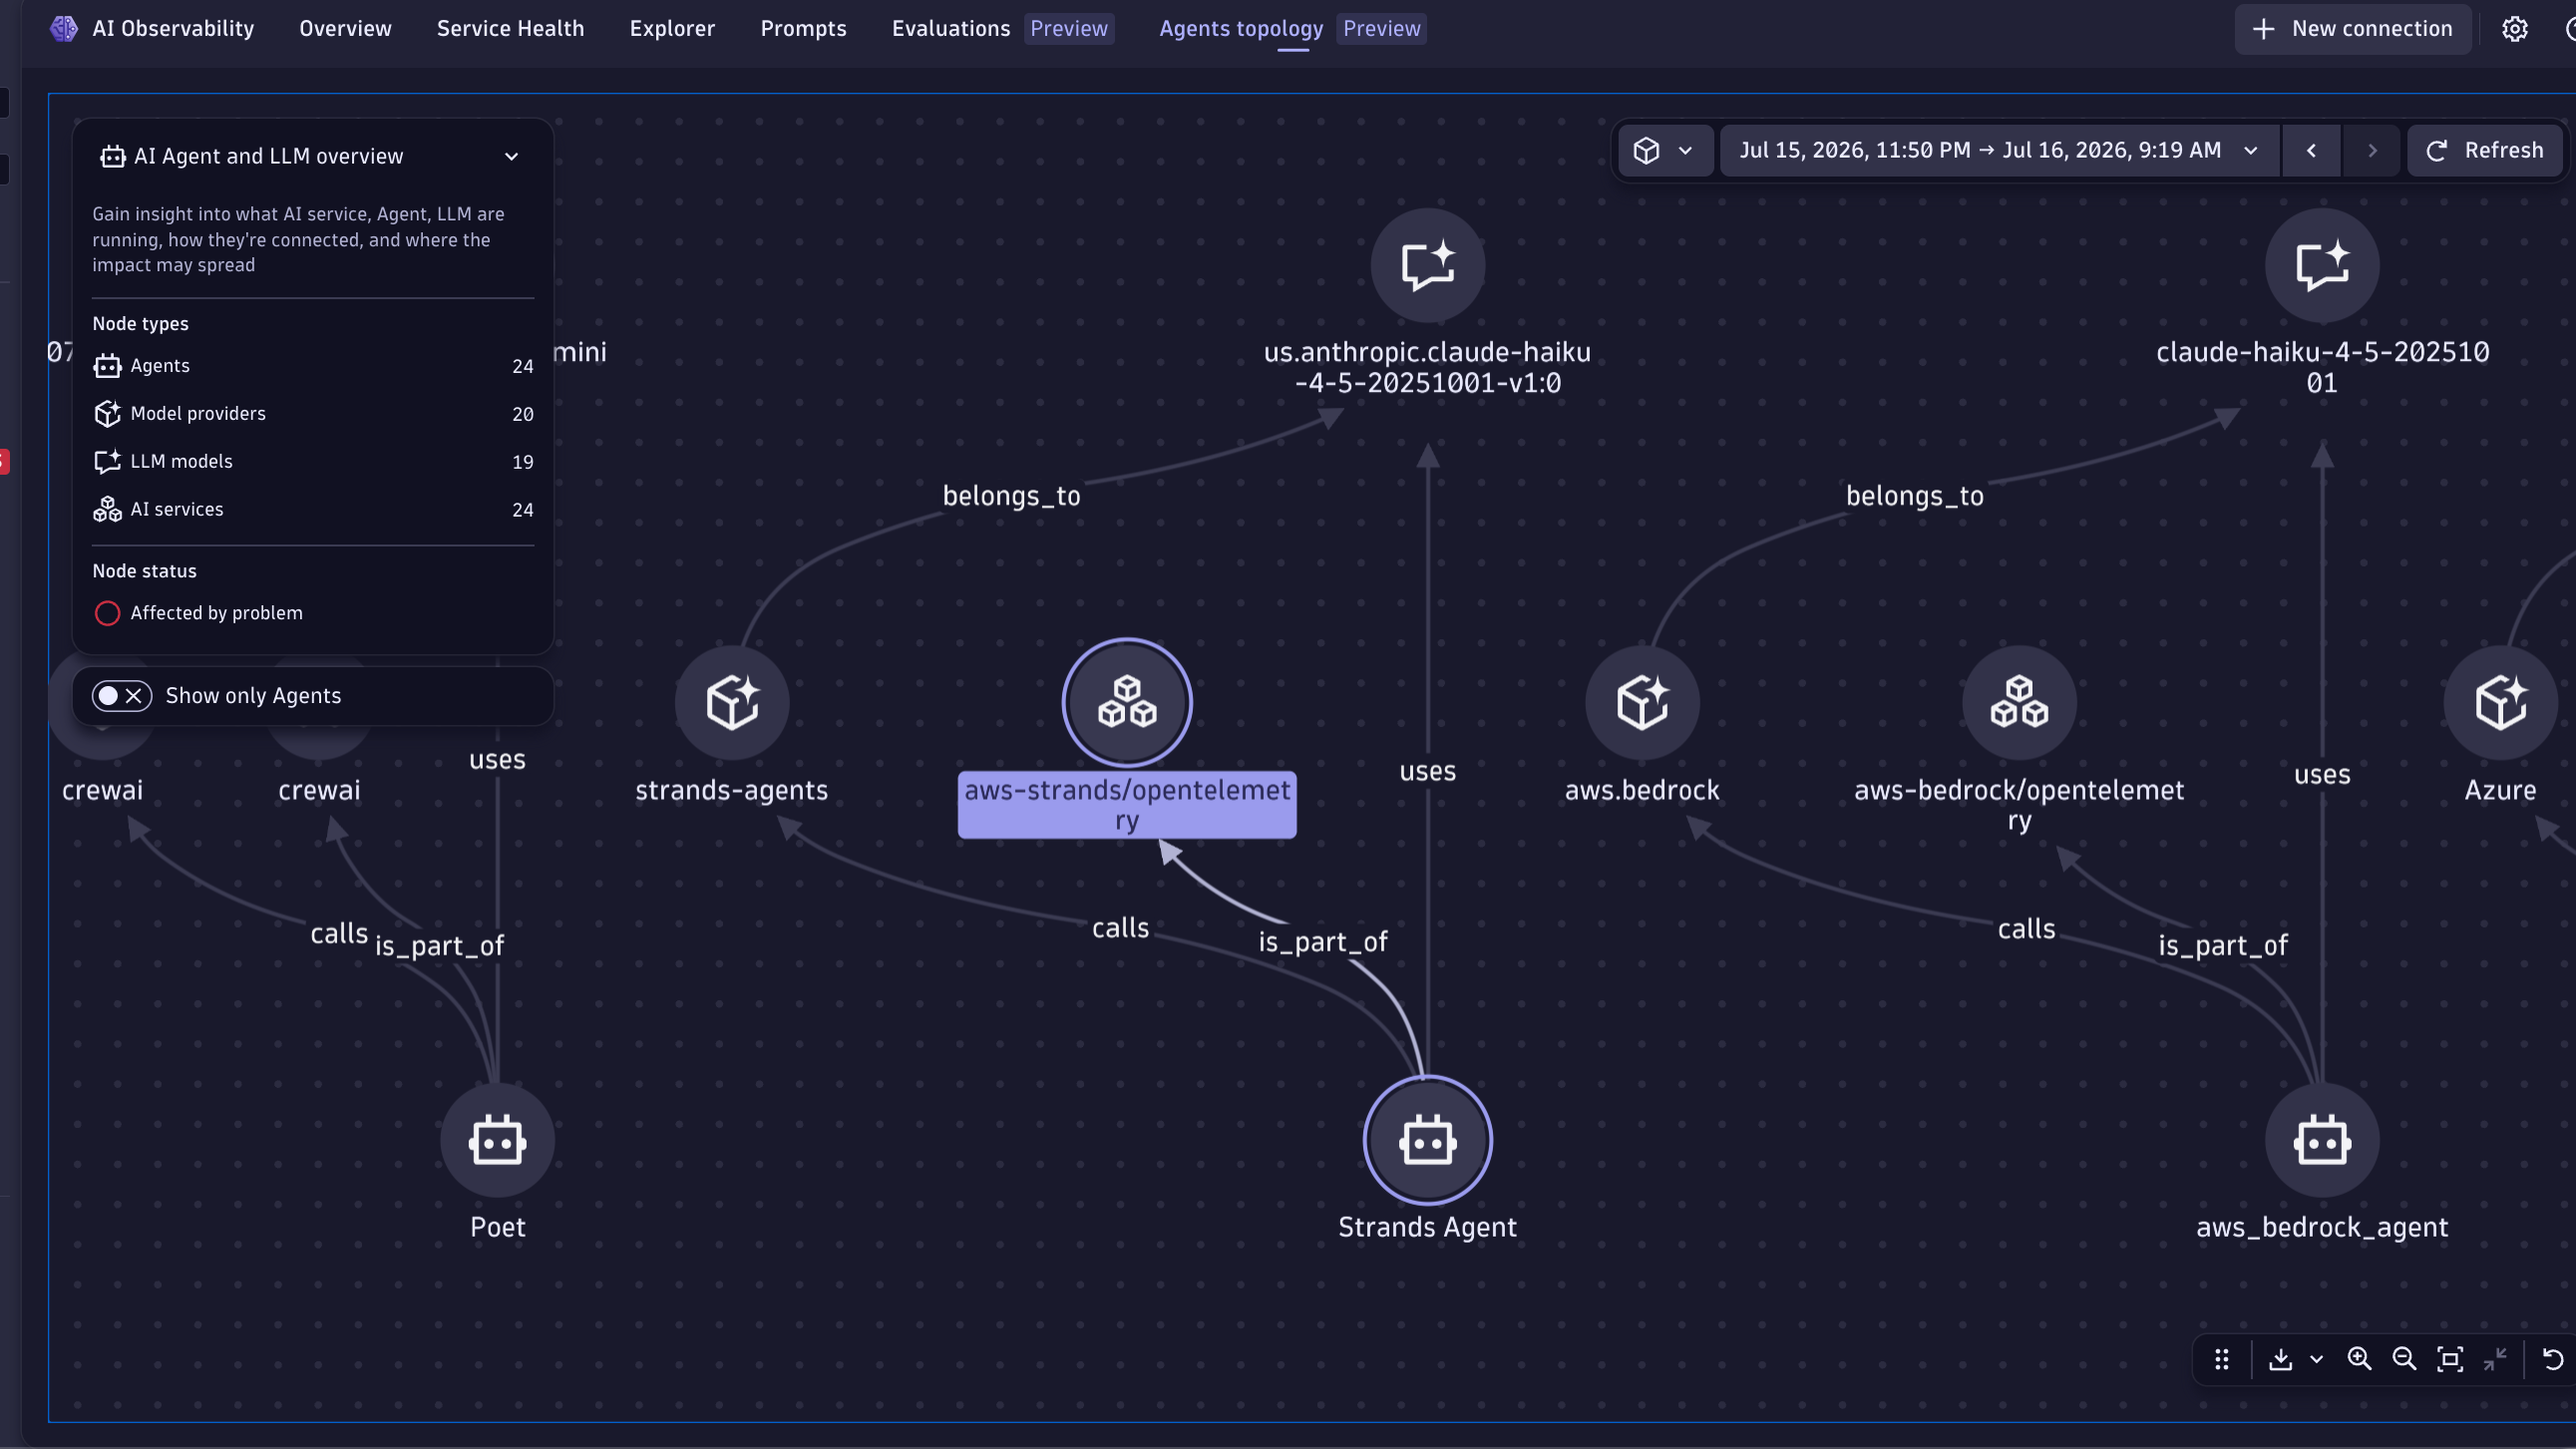
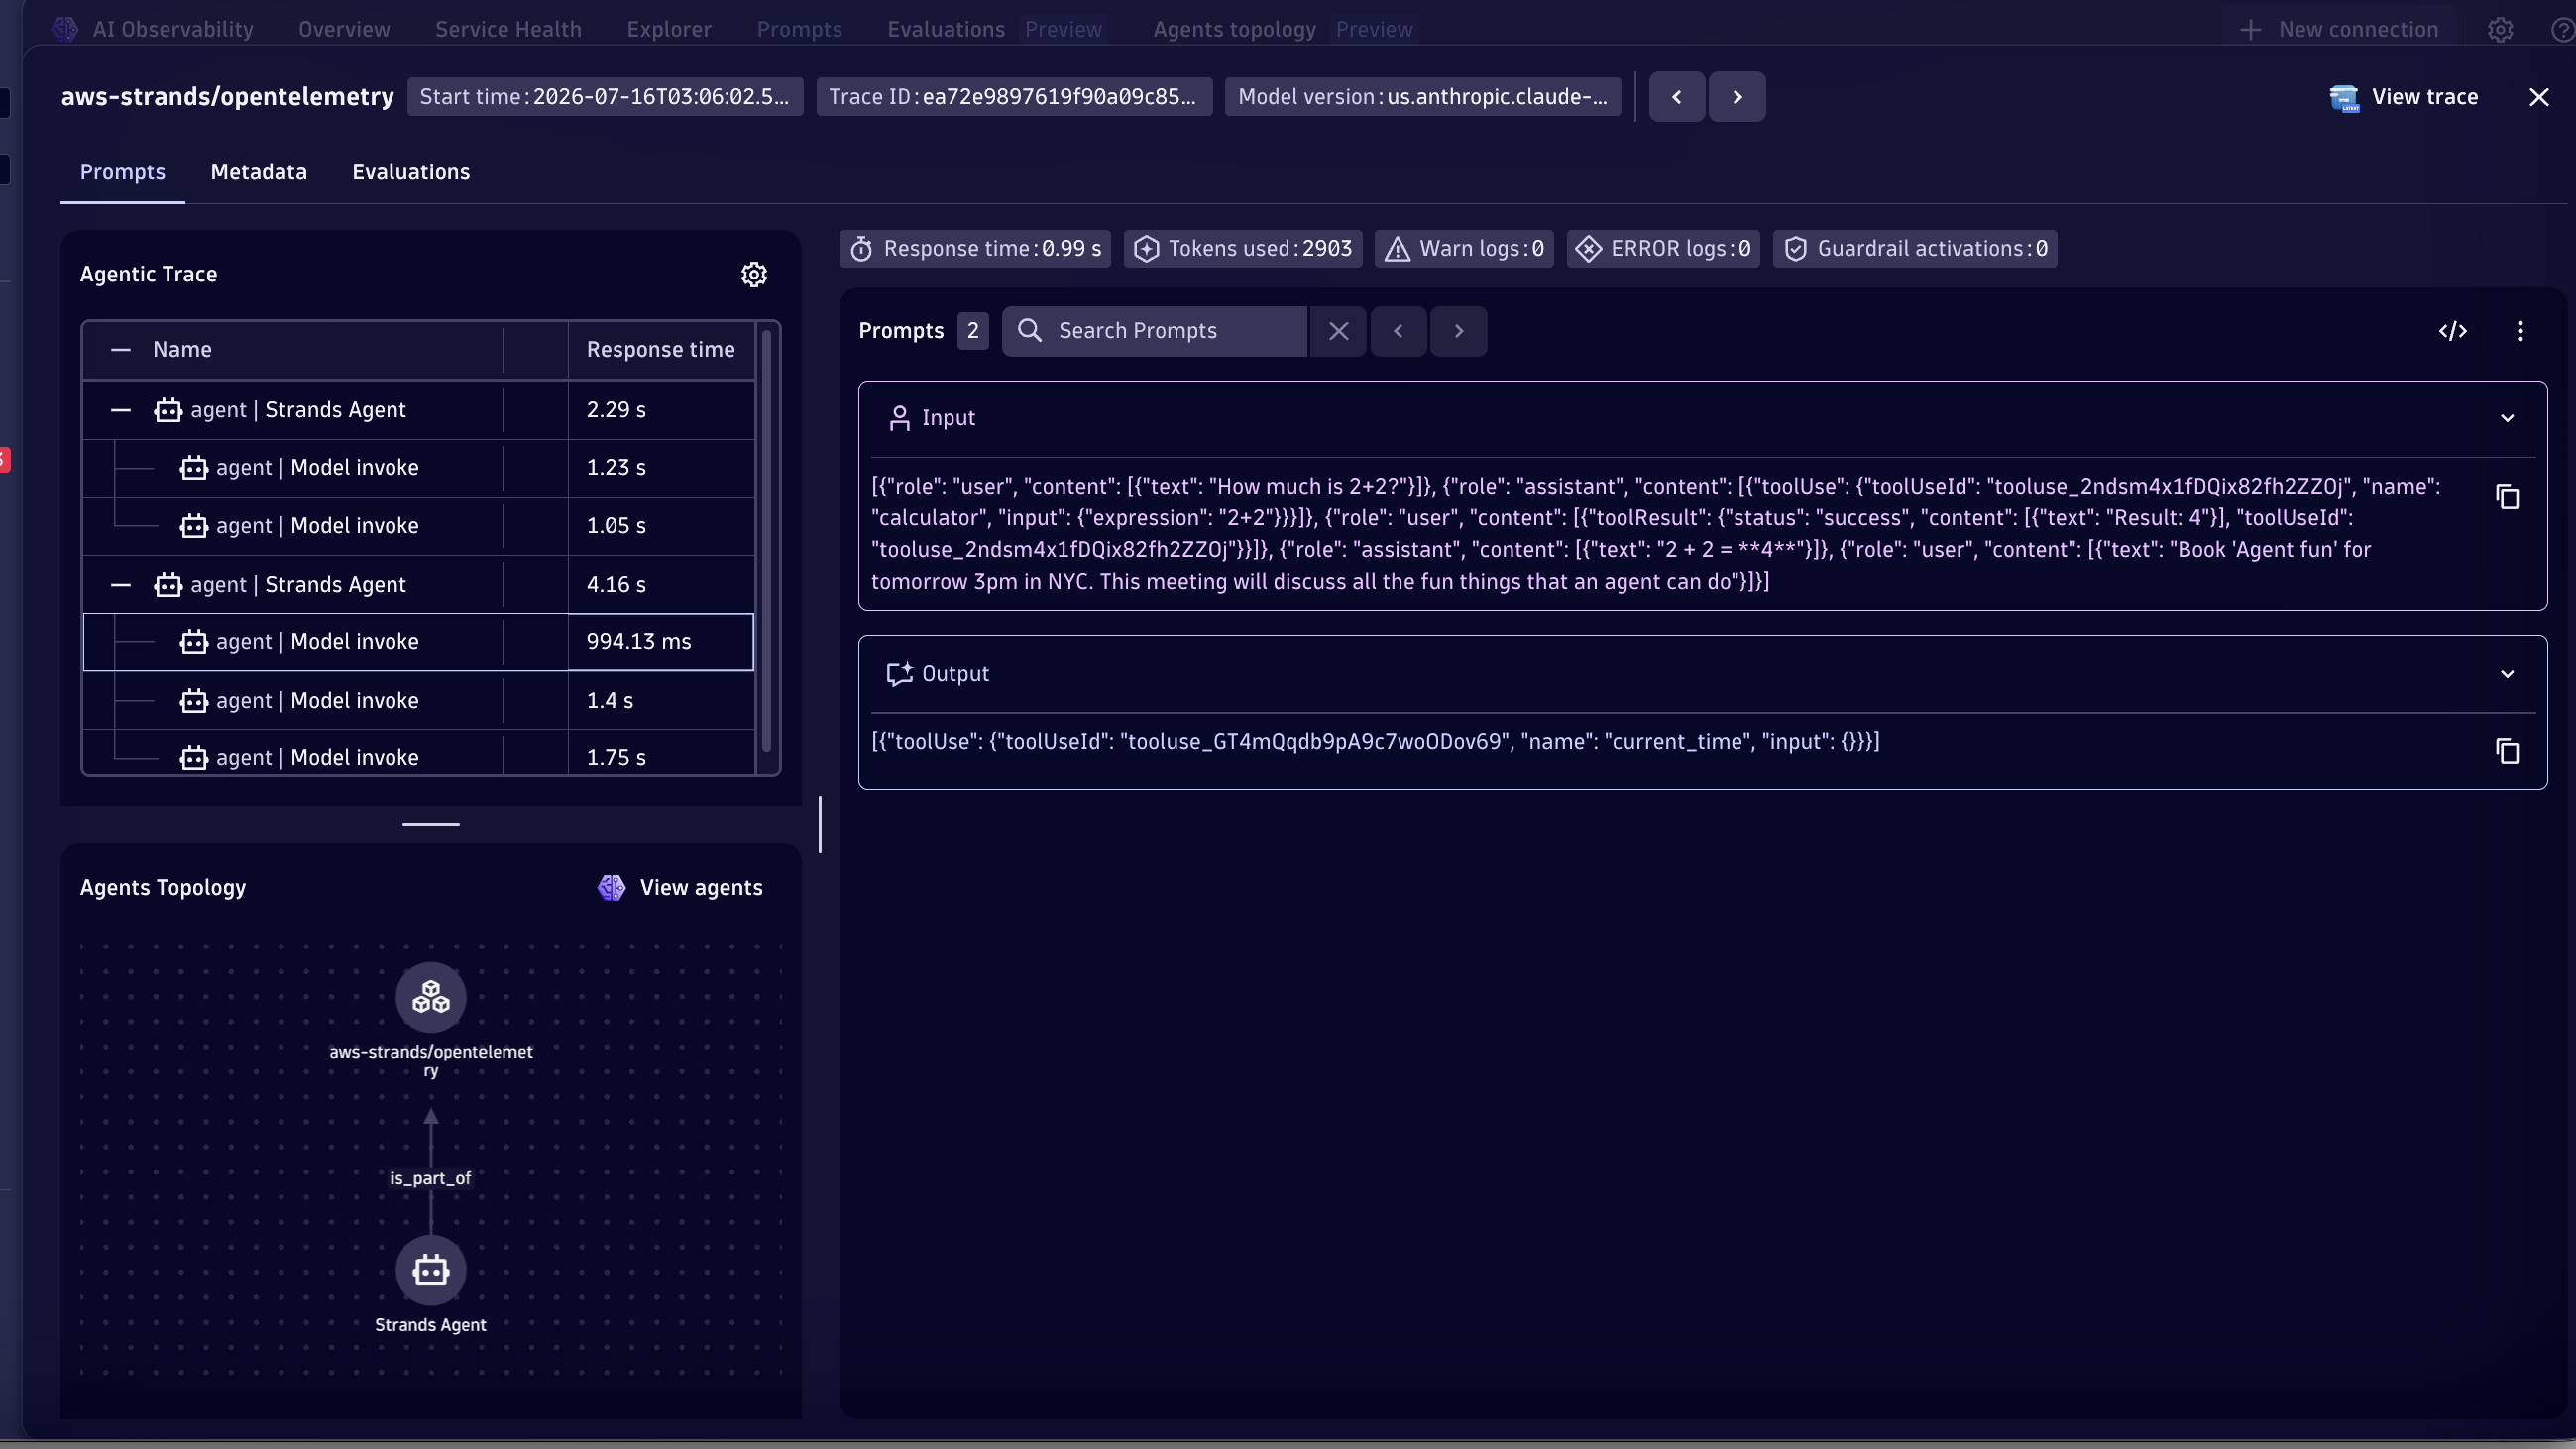
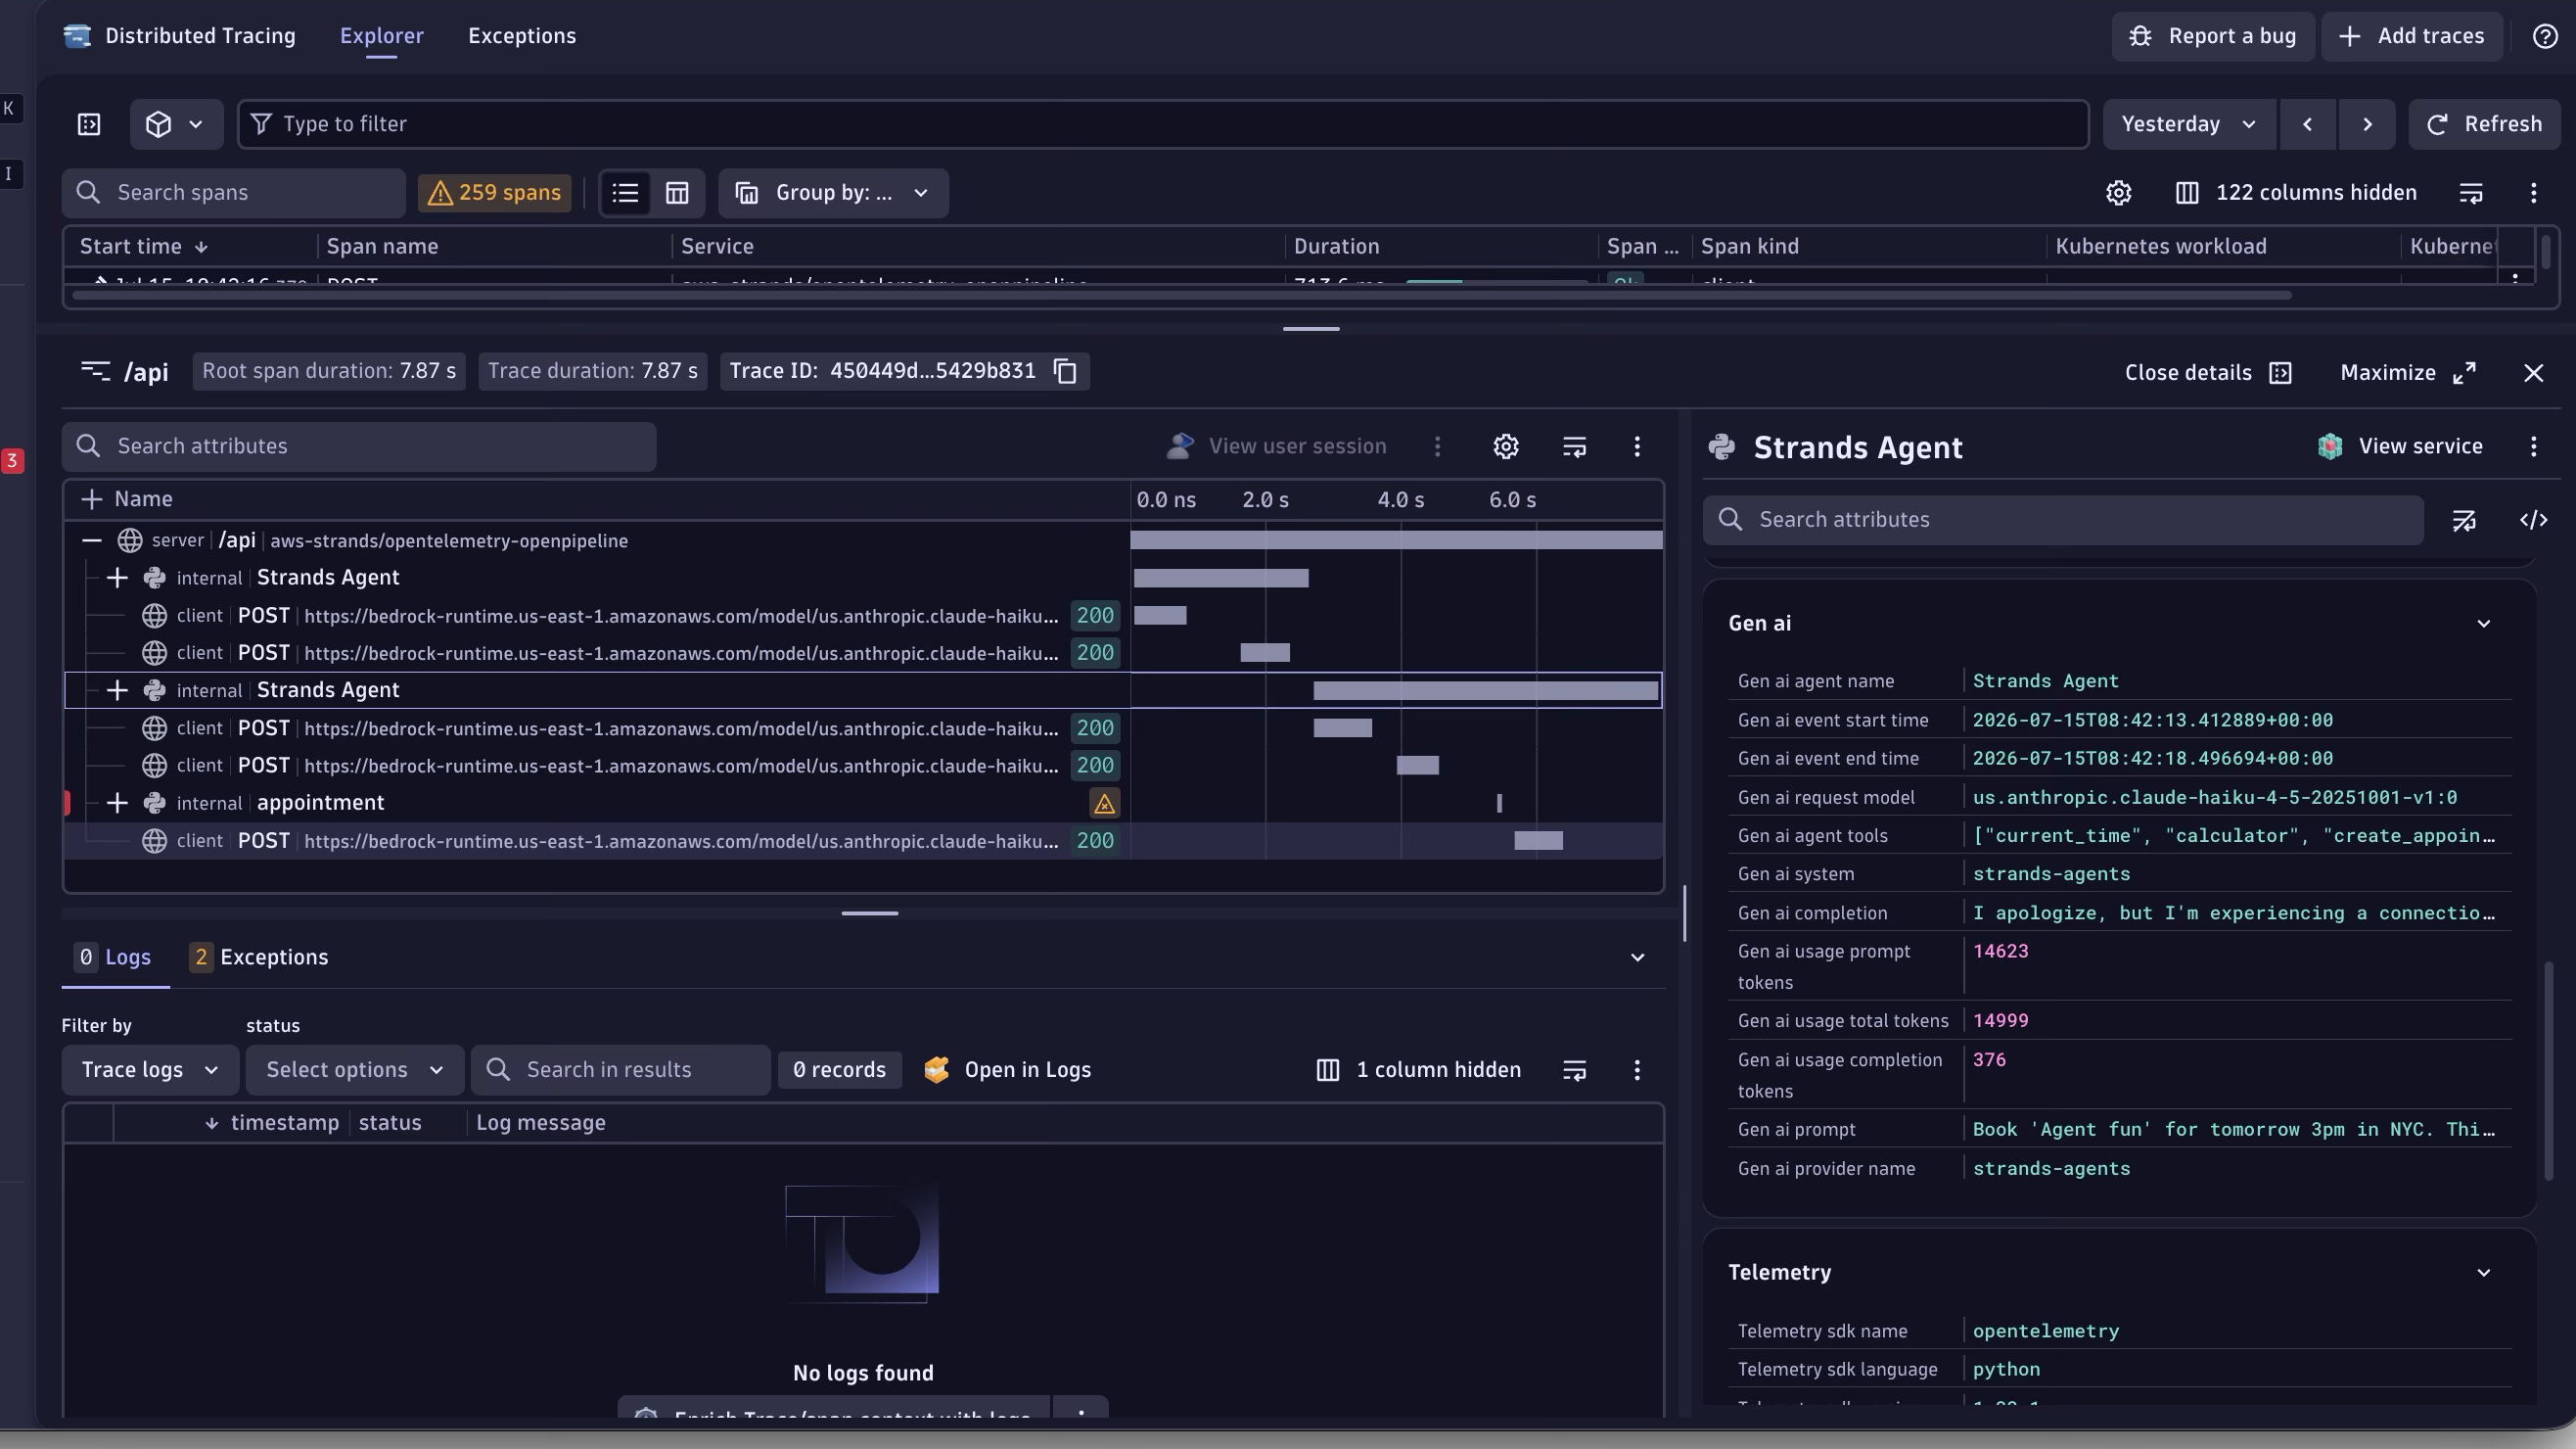
Get visibility into Agent Topology and dependency for your AWS Strands instrumented AI servicesPrompts stream showing all Agent and LLM interactions with model version, token count, agent topology, and full prompt/response contentDistributed trace showing the full Strands agent execution.
  • Product information

Overview

Get full-stack visibility into your AWS Strands Agents with Dynatrace AI Observability. Strands emits OpenTelemetry traces out of the box, but uses non-standard span attribute names for prompt and completion content. This integration normalises them into native gen_ai.* semantic conventions so you can monitor model performance, token costs, agent behaviour, and conversation flows in Dynatrace without writing custom instrumentation code.

Three instrumentation paths are supported:

  • OneAgent — auto-instrumentation with zero configuration for Python agents running on monitored hosts.
  • OpenTelemetry Collector — send traces via OTLP with attribute normalisation handled by a pre-configured collector pipeline.
  • OpenPipeline — export traces directly to Dynatrace via OTLP (no collector required) and let Dynatrace OpenPipeline normalise attributes at ingestion time.

This is intended for users who:

  • Build AI agent or multi-agent applications using AWS Strands Agents.
  • Want end-to-end tracing of agent orchestration — including prompt content, tool calls, and token usage — without writing custom instrumentation code.

Use cases

Monitor AI agent health and performance

  • Track request latency, error rates, and token consumption across models and providers.
  • Manage AI costs with token-level usage breakdowns by model and agent.
  • Enable alerting based on latency anomalies, cost thresholds, or error rate spikes in your AI workloads.

Debug agentic AI end-to-end

  • Trace complex agent orchestration with distributed traces showing prompt content, tool calls, and model handoffs across Strands cycles.
  • Pinpoint exact failure points in multi-agent pipelines with span-level detail.
  • Capture full prompt and completion content for root cause analysis.

Track agent behaviour across cycles

  • Follow multi-cycle agent reasoning loops end-to-end.
  • Isolate individual tool call performance across your agent fleet.
  • Correlate regressions with model version changes or prompt updates.

Get observability with minimal configuration

  • Use OneAgent for zero-config auto-instrumentation on monitored hosts.
  • Or run the pre-configured OTel Collector pipeline to normalise attributes before export to Dynatrace.
  • No custom instrumentation code required in either path.

Get started

Requirements

  • Python 3.10+.
  • An AWS account with Amazon Bedrock access.
  • Dynatrace SaaS with Traces powered by Grail and Metrics powered by Grail enabled.
  • A Dynatrace API token with openTelemetryTrace.ingest and metrics.ingest scopes (OTel Collector path), or a OneAgent installation (OneAgent path).
  • Do not set OTEL_SEMCONV_STABILITY_OPT_IN=gen_ai_latest_experimental. This opt-in moves prompt and completion content from span attributes into OTel log events, which are not yet supported. Leave this variable unset to ensure prompt content is captured correctly.

For detailed instructions, see the instrumentation examples on GitHub. To install the AI Observability app, see the app installation docs.

Details

OneAgent Deploy OneAgent on the host running your Strands agent. No code changes or environment variables required. See the OneAgent example.

OpenTelemetry Collector Run the pre-configured collector alongside your agent. The collector pipeline normalizes Strands' non-standard attribute names (gen_ai.prompt, gen_ai.completion, gen_ai.usage.prompt_tokens, etc.) into the gen_ai.* semantic conventions that Dynatrace AI Observability queries. See the OpenTelemetry example.

OpenPipeline Export traces directly from your agent to Dynatrace via OTLP (no collector required) and let Dynatrace OpenPipeline handle the attribute normalization at ingestion time. Deploy the pre-configured OpenPipeline definition from the OpenPipeline example to your tenant before running the agent.

Dynatrace
Documentation
By Dynatrace
Dynatrace support center
Copy to clipboard
Dynatrace Hub
Get data into DynatraceBuild your own app
Dynatrace Intelligence - Agentic Operations SystemThe Dynatrace Agentic AI ecosystem
All (917)Log Management and AnalyticsKubernetesAI and LLM ObservabilityInfrastructure ObservabilitySoftware DeliveryApplication ObservabilityApplication SecurityBusiness ObservabilityDigital Experience
Filter
Type
Built and maintained by
Deployment model
SaaS
  • SaaS
  • Managed
Partner FinderBecome a partnerDynatrace Developer

Discover recent additions to Dynatrace

Dynatrace Assist logo

Dynatrace Assist

Dynatrace Assist: Ask, analyze, and act with Dynatrace Intelligence.

Smartscape logo

Smartscape

Interactively explore and analyze topology and relationships in digital systems.

Compliance Assistant logo

Compliance Assistant

Track, manage, and automate compliance across your IT and business landscape.

Experience Vitals logo

Experience Vitals

Optimize UX with core vitals, frontend error tracking, and end-to-end visibility.

Error Inspector logo

Error Inspector

Discover, triage, and manage errors across all your frontends.

Users & Sessions logo

Users & Sessions

Discover how users and cohorts with common characteristics experience your app.

Analyze your data

Understand your data better with deep insights and clear visualizations.

Notebooks logo

Notebooks

Create powerful, data-driven documents for custom analytics and collaboration.

Dashboards logo

Dashboards

Transform complex data into clear visualizations with custom dashboards.

Investigations logo

Investigations

Fast and precise incident response on Grail data with DQL queries.

Smartscape logo

Smartscape

Interactively explore and analyze topology and relationships in digital systems.

Logs logo

Logs

Explore all your logs without writing a single query.

Problems logo

Problems

Detect, explain and triage problems automatically using Dynatrace Intelligence.

Automate your processes

Turn data and answers into actions, securely, and at scale.

Workflows logo

Workflows

Automate tasks in your IT landscape and move towards autonomous operations.

Jira logo

Jira

Open, update, and close Jira tickets automatically from Dynatrace Workflows.

Slack logo

Slack

Automate Slack messaging for security incidents, attacks, remediation, and more.

Secure your cloud application

See vulnerabilities and attacks in your environment.

Security Posture Management logo

Security Posture Management

Detect, prioritize, and remediate security and compliance findings with SPM.

Threats & Exploits logo

Threats & Exploits

Understand, triage, and investigate detection findings and alerts.

More resources

Cursor logo

Cursor

Get Real time Code-Level data directly to your Cursor IDE.

Documents logo

Documents

Manage Dashboards, Notebooks and other documents in your Dynatrace environment.

GitHub Copilot Coding Agent logo

GitHub Copilot Coding Agent

Automate vulnerability remediation and boost developer productivity.

GitHub Copilot Custom Agent logo

GitHub Copilot Custom Agent

Automate your development workflows with specialized agent definitions.

Dynatrace Live Debugger on JetBrains logo

Dynatrace Live Debugger on JetBrains

Get real-time code-level data directly to your Jetbrains IDE.

Metrics logo

Metrics

Browse, search, and manage all your metrics in one central catalog.

Pagerduty for Dynatrace Workflows logo

Pagerduty for Dynatrace Workflows

Streamline incident management with automated Pageruty workflows.

Cursor IDE logo

Cursor IDE

Boost developer productivity and get real-time, code-level insights into Cursor.

Dynatrace Live Debugger on Windsurf logo

Dynatrace Live Debugger on Windsurf

Get real-time code-level data directly to your Windsurf IDE.

Are you looking for something different?

We have hundreds of apps, extensions, and other technologies to customize your environment

Leverage our newest innovations of Dynatrace Saas

Kick-start your app creation

Kick-start your app creation

Whether you’re a beginner or a pro, Dynatrace Developer has the tools and support you need to create incredible apps with minimal effort.
Go to Dynatrace Developer

Upgrading from Dynatrace Managed to SaaS

Upgrading from Dynatrace Managed to SaaS

Drive innovation, speed, and agility in your organization by seamlessly and securely upgrading.
Learn More
Log Management and Analytics

Log Management and Analytics

Innovate faster and more efficiently with unified log management and log analytics for actionable insights and automation.
Learn more