























Kick-start your app creation
Whether you’re a beginner or a pro, Dynatrace Developer has the tools and support you need to create incredible apps with minimal effort.
Go to Dynatrace Developer
 Arista
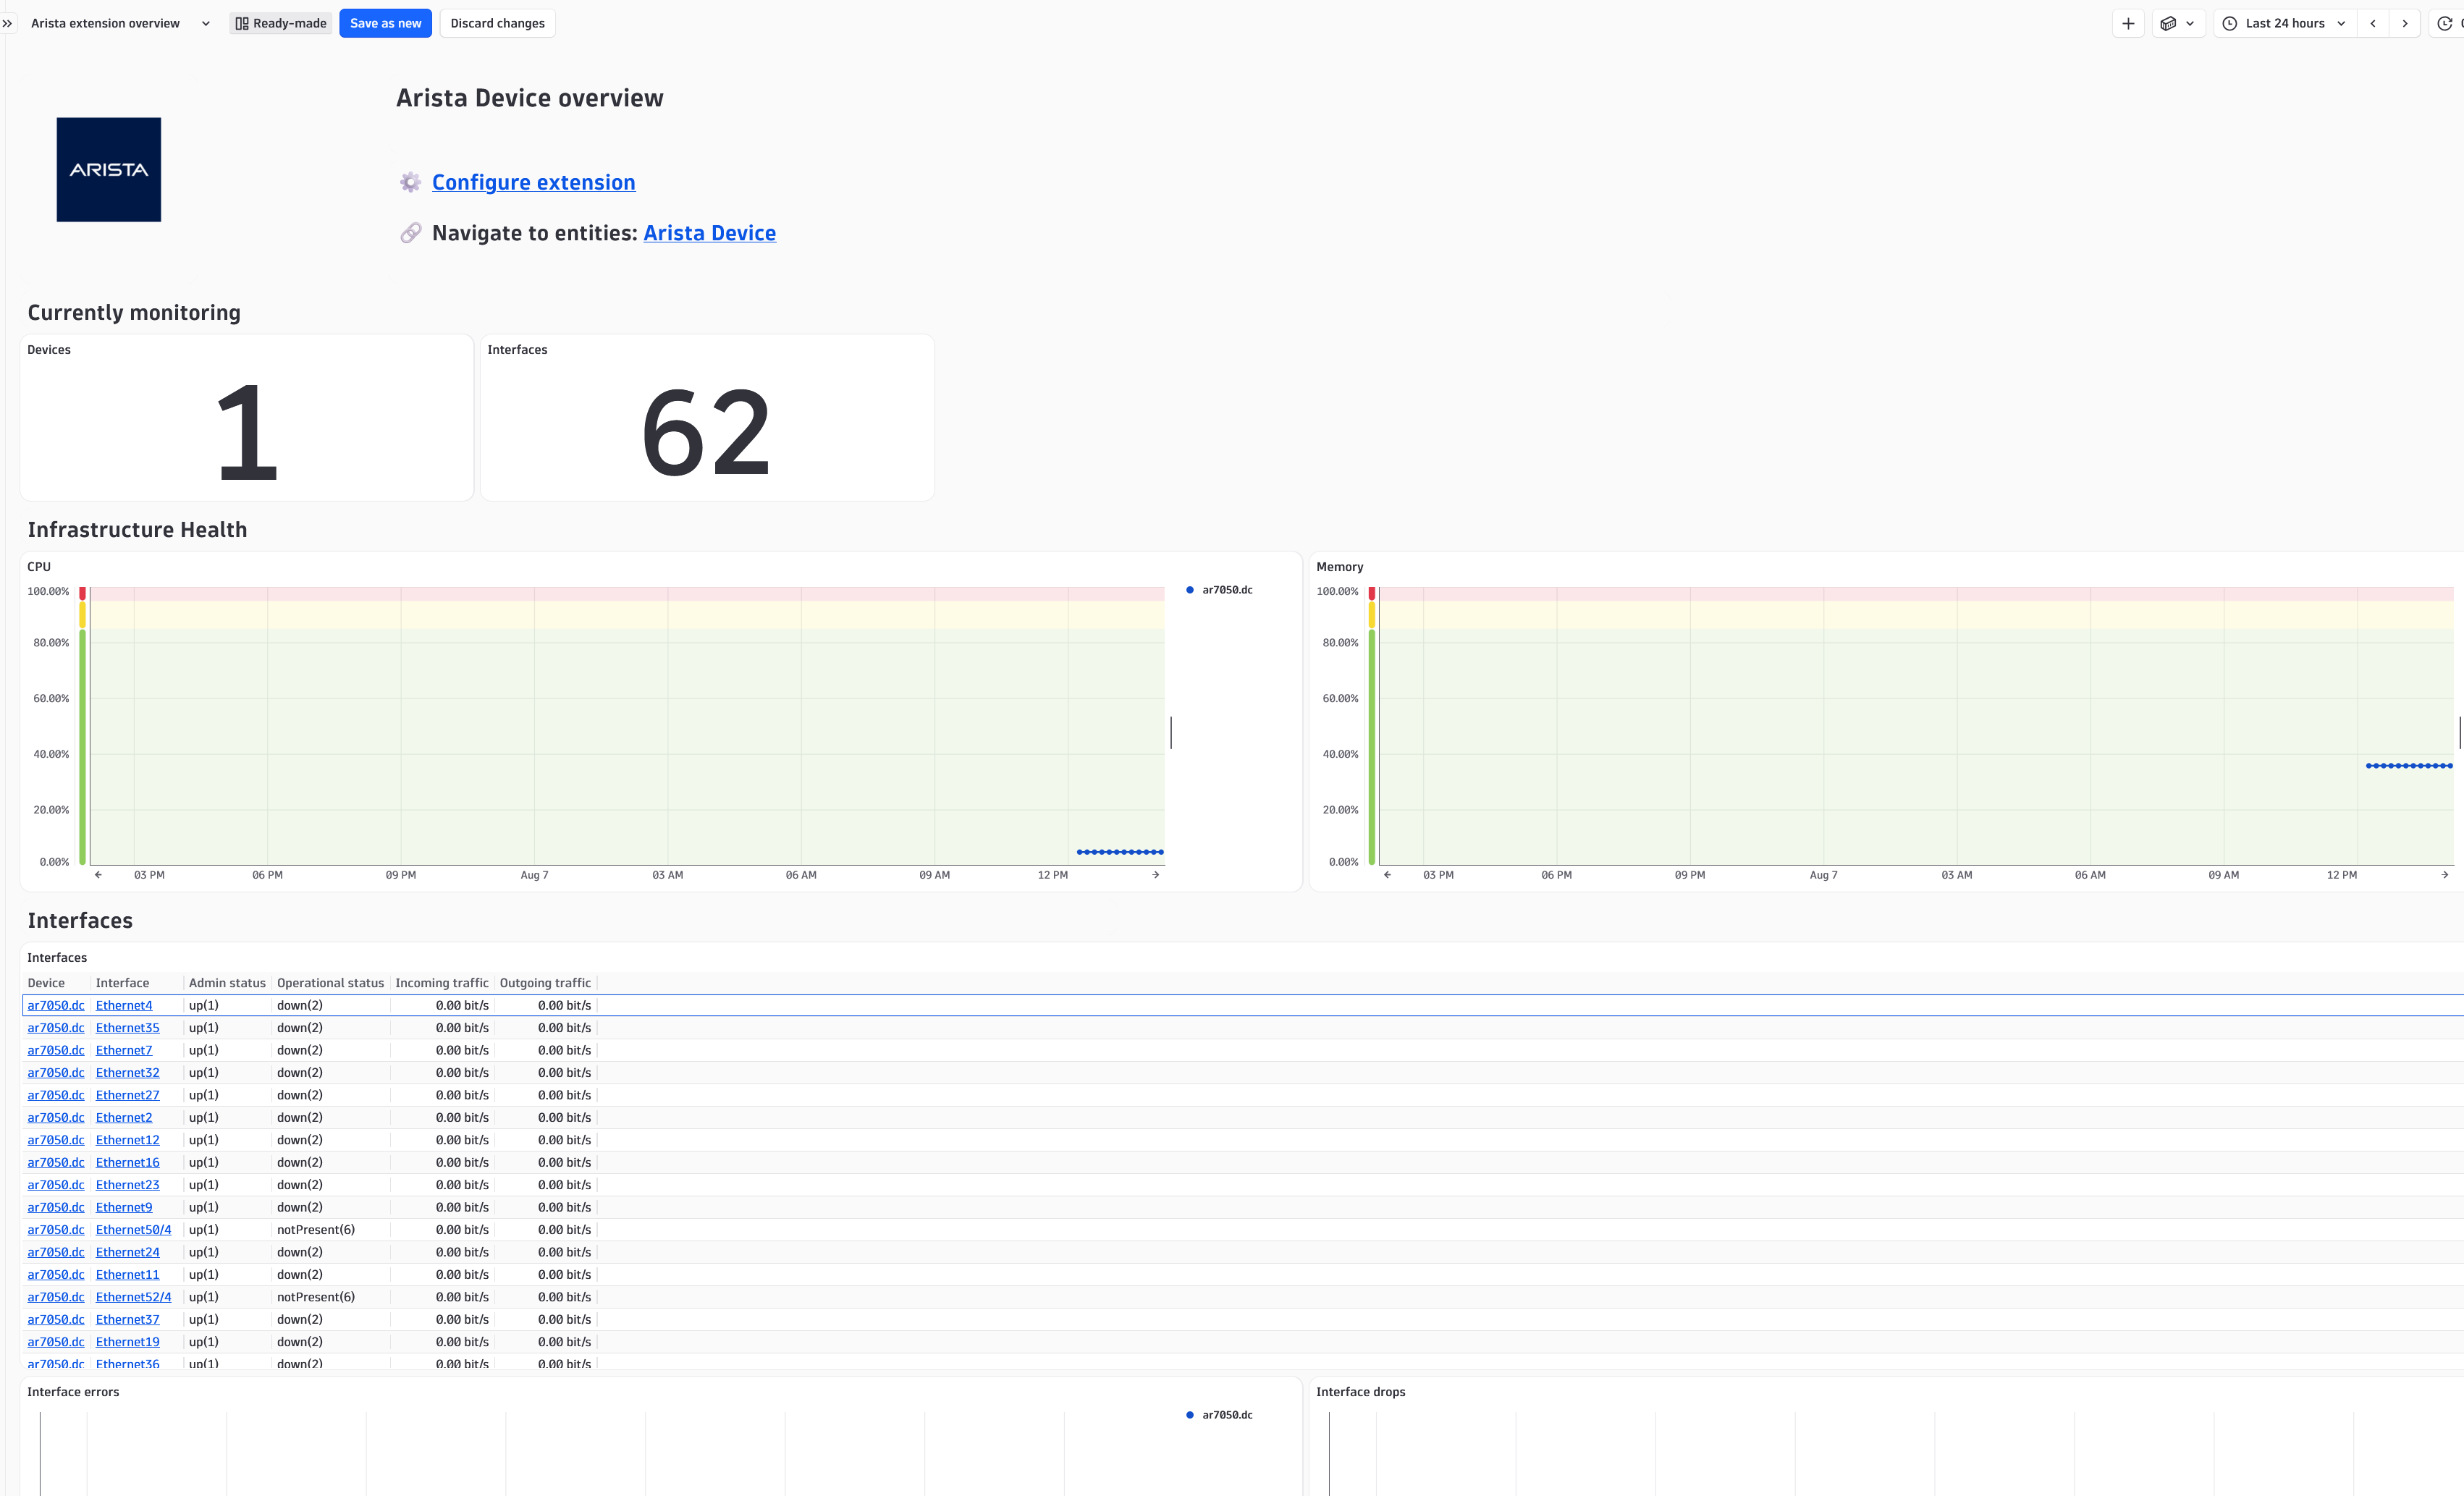
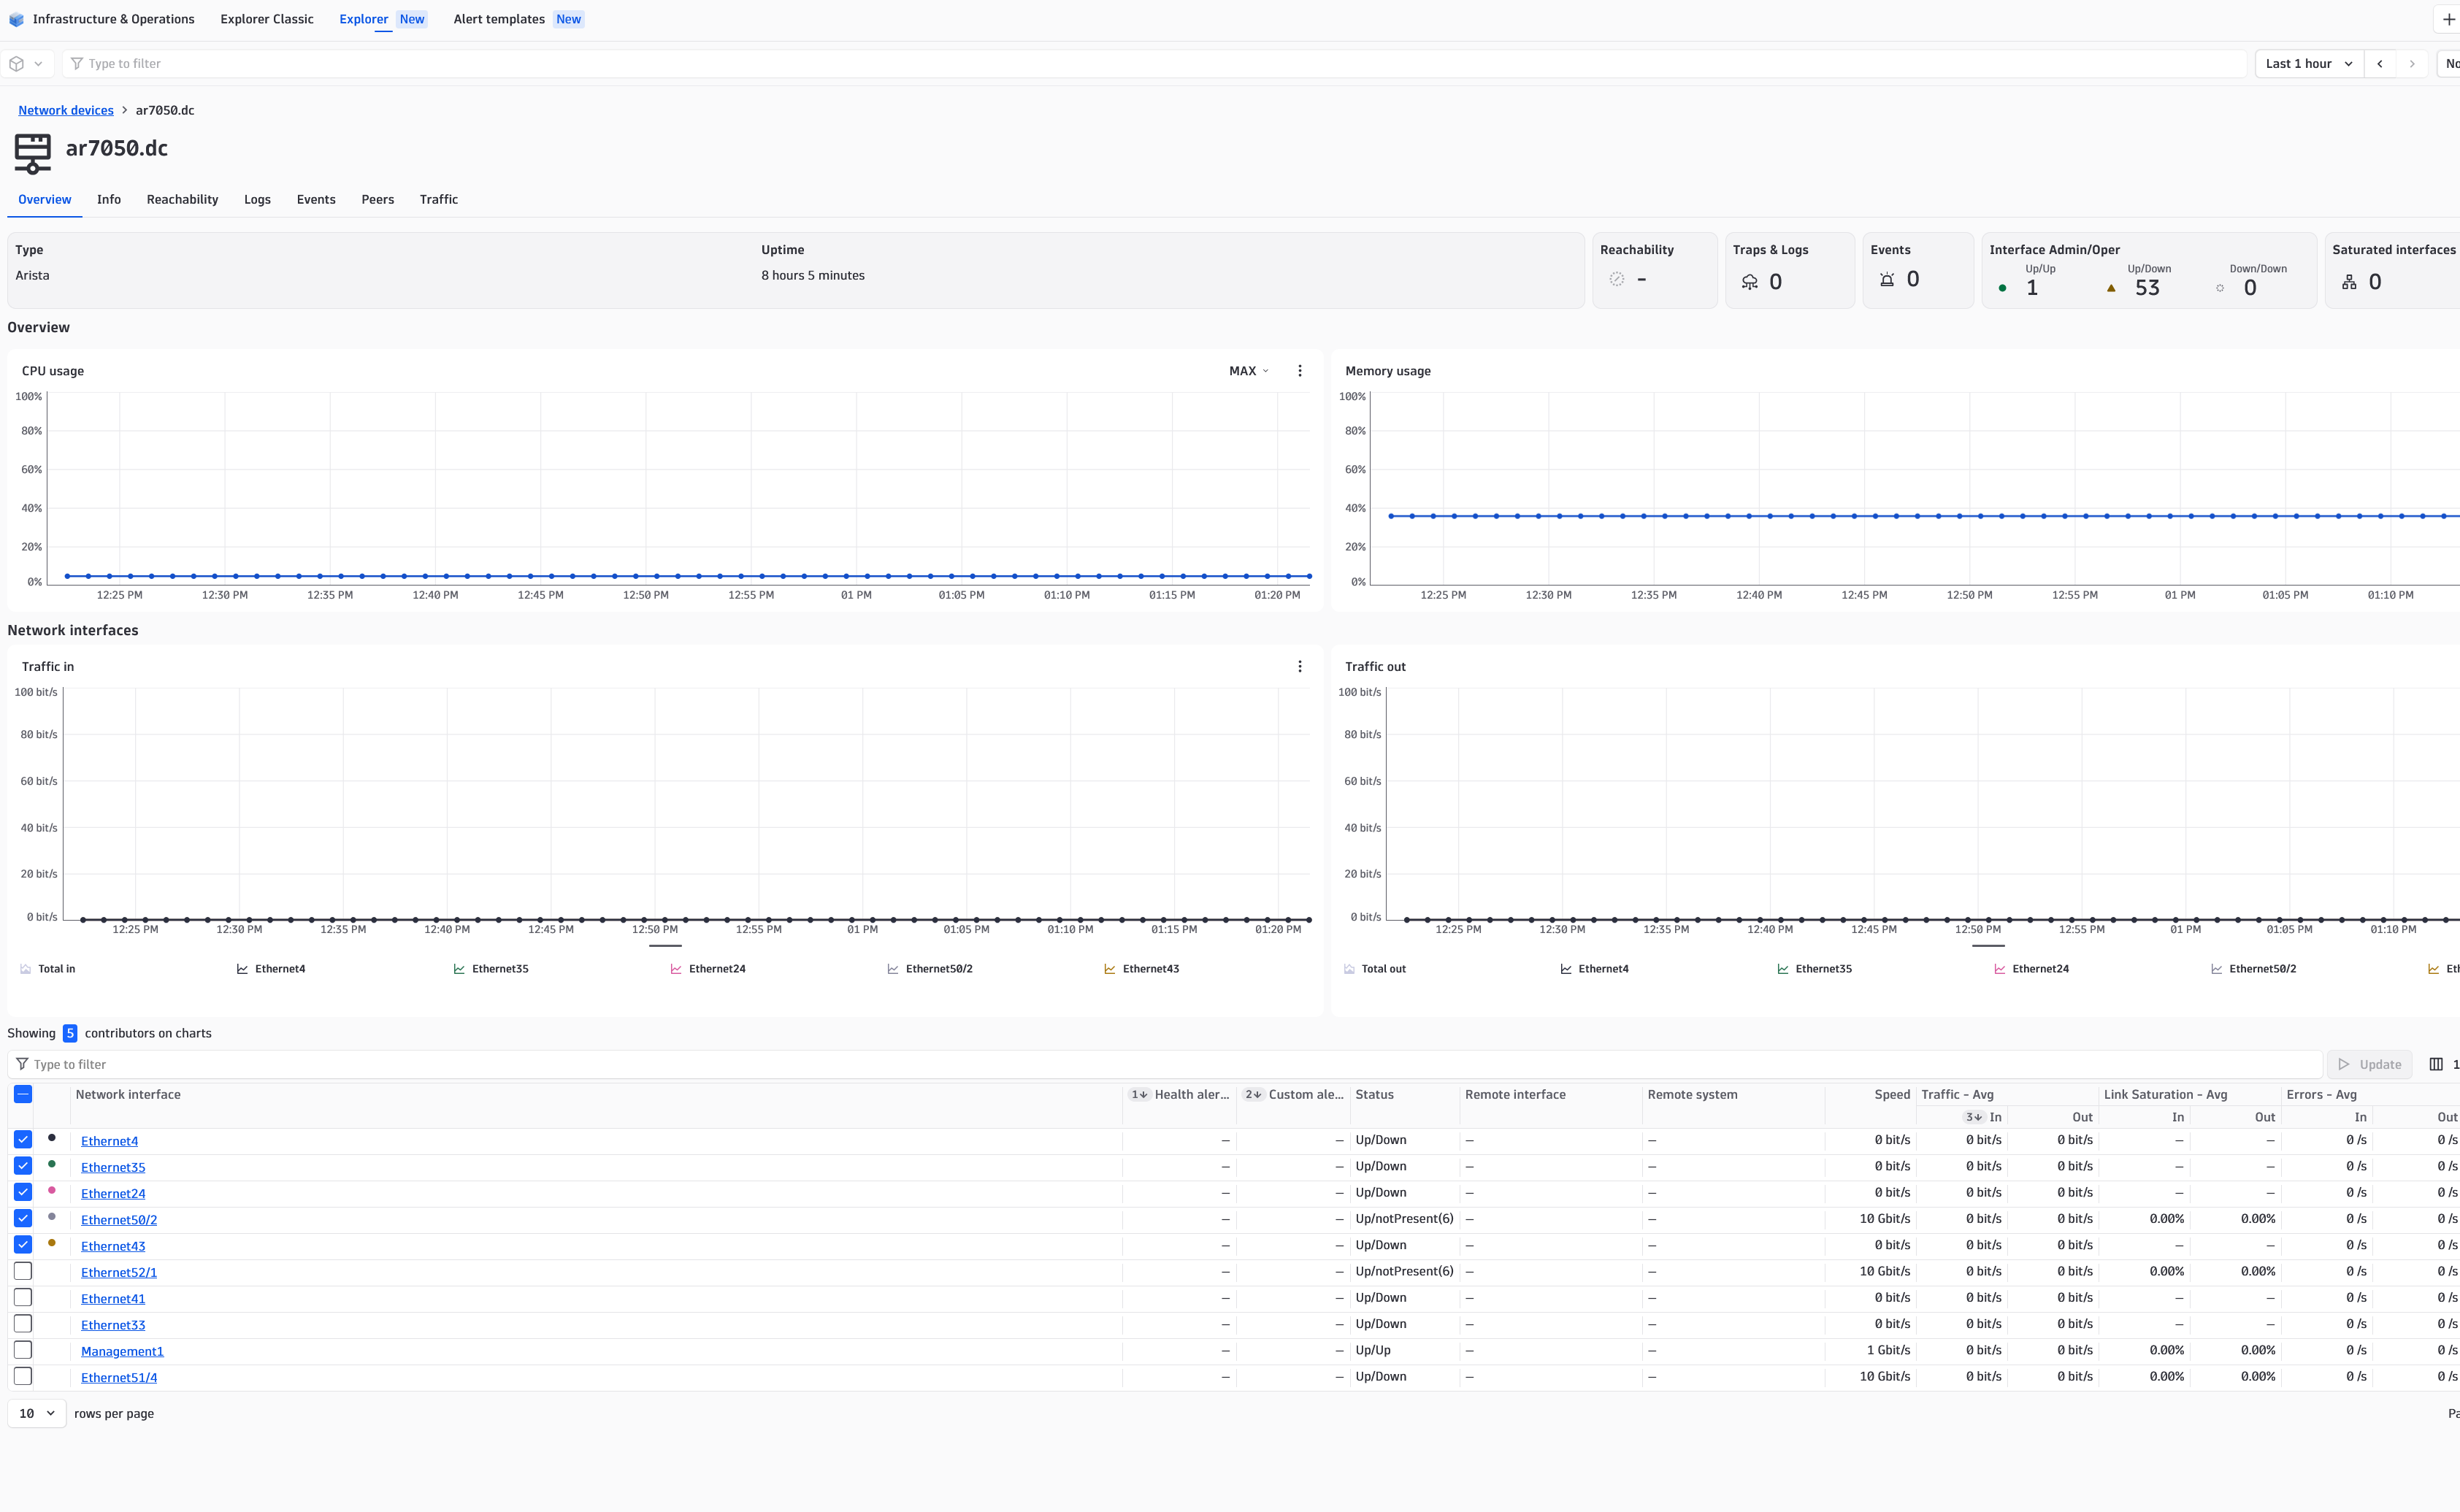
The Arista extension leverages SNMP to gather performance and health metrics from your Arista devices every minute. This data is seamlessly integrated into Dynatrace’s Infrastructure & Operations app, offering Network and Ops Administrators quick, actionable insights at a glance.
For more information on the installation and configuration, please see Arista extension in the Dynatrace Documentation.
Below is a complete list of the feature sets provided in this version. To ensure a good fit for your needs, individual feature sets can be activated and deactivated by your administrator during configuration.
| Metric name | Metric key | Description | Unit |
|---|---|---|---|
| Uptime | com.dynatrace.extension.network_device.sysuptime | The time, in system ticks (1/100 second), since the last system reboot. | Count |
| CPU usage | com.dynatrace.extension.network_device.cpu_usage | The system's CPU usage expressed as a percentage | Percent |
| Used memory | com.dynatrace.extension.network_device.memory_used | The amount of memory, in kilobytes, used by the device | KiloByte |
| Total memory | com.dynatrace.extension.network_device.memory_total | The total (used and free) amount of memory, in kilobytes, available on the device | KiloByte |
| Interface status | com.dynatrace.extension.network_device.if.status | A state metric representing a network interface, whose value is always 1 and its dimensions indicate its state details. | State |
| Metric name | Metric key | Description | Unit |
|---|---|---|---|
| SNMP Messages delivered | com.dynatrace.extension.network_device.snmp.in.pkts.count | Total number of messages delivered to the SNMP entity from the transport service | Count |
| SNMP Messages passed | com.dynatrace.extension.network_device.snmp.out.pkts.count | Total number of messages passed from the SNMP entity to the transport service | Count |
| Silently dropped SNMP PDUs | com.dynatrace.extension.network_device.snmp.silent_drops.count | Number of silently dropped SNMP PDUs due to the large reply size | Count |
| Proxy dropped SNMP PDUs | com.dynatrace.extension.network_device.snmp.proxy_drops.count | Number of silently dropped SNMP PDUs due to the other than a time-out | Count |
| Unsupported SNMP version messages | com.dynatrace.extension.network_device.snmp.in.bad_versions.count | Total number of messages delivered with an unsupported SNMP version | Count |
| Messages with bad SNMP community names | com.dynatrace.extension.network_device.snmp.in.bad_community_names.count | Number of messages with an unknown SNMP community name | Count |
| Messages not allowed for SNMP community names | com.dynatrace.extension.network_device.snmp.in.bad_community_uses.count | Number of messages not allowed for the used SNMP community name | Count |
| 'noSuchName' SNMP errors | com.dynatrace.extension.network_device.snmp.in.no_such_names.count | Number of delivered SNMP PDUs with 'noSuchName' error | Count |
| 'badValue' SNMP errors | com.dynatrace.extension.network_device.snmp.in.bad_values.count | Number of delivered SNMP PDUs with 'badValue' error | Count |
| SNMP Traps processed | com.dynatrace.extension.network_device.snmp.in.traps.count | Total number of SNMP Trap PDUs accepted and processed | Count |
| SNMP Traps generated | com.dynatrace.extension.network_device.snmp.out.traps.count | Total number of SNMP Trap PDUs generated | Count |
| Metric name | Metric key | Description | Unit |
|---|---|---|---|
| LLDP Neighbor Information | com.dynatrace.extension.network_device.lldp.info | Conveys information about the existing LLDP neighbor connections. | State |
| Metric name | Metric key | Description | Unit |
|---|---|---|---|
| Traffic in | com.dynatrace.extension.network_device.if.bytes_in.count | The volume of traffic, in bytes, inboud to the network interface. | Byte |
| Traffic out | com.dynatrace.extension.network_device.if.bytes_out.count | The volume of traffic, in bytes, outbound from the network interface. | Byte |
| Errors in | com.dynatrace.extension.network_device.if.in.errors.count | The number of errors, inboud to the network interface. | Count |
| Discards in | com.dynatrace.extension.network_device.if.in.discards.count | The number of discarded packets, inbound to the network interface. | Count |
| Errors out | com.dynatrace.extension.network_device.if.out.errors.count | The number of errors, outbound from the network interface. | Count |
| Discards out | com.dynatrace.extension.network_device.if.out.discards.count | The number of discarded packets, outbound from the network interface. | Count |
| Interface speed | com.dynatrace.extension.network_device.if.speed | The configured speed of the network interface in megabits per second. | MegaBitPerSecond |
| Last change | com.dynatrace.extension.network_device.if.lastchange | The value of sysUpTime at the time the interface entered its current operational state. | Count |
| Metric name | Metric key | Description | Unit |
|---|---|---|---|
| TCP active opens | com.dynatrace.extension.network_device.tcp.activeopens.count | Number of transitions of TCP connections from CLOSED to SYN-SENT | Count |
| TCP passive opens | com.dynatrace.extension.network_device.tcp.passiveopens.count | Number of transitions of TCP connections from CLOSED to SYN-RCVD | Count |
| TCP failed attempts | com.dynatrace.extension.network_device.tcp.attemptfails.count | Number of transitions of TCP connections from SYN-SENT/SYN-RCVD to CLOSED and from SYN-RCVD to LISTEN | Count |
| TCP resets | com.dynatrace.extension.network_device.tcp.estab.resets.count | Number of transitions of TCP connections from ESTABLISHED/CLOSE-WAIT to CLOSED | Count |
| TCP connections | com.dynatrace.extension.network_device.tcp.curr.estab | Number of TCP connections in the ESTABLISHED/CLOSE-WAIT state | Count |
| TCP segments retransmitted | com.dynatrace.extension.network_device.tcp.retrans.segs.count | Total number of segments retransmitted | Count |
| TCP segment errors | com.dynatrace.extension.network_device.tcp.in.errors.count | Total number of segments received in error | Count |
| TCP segment resets | com.dynatrace.extension.network_device.tcp.out.rsts.count | Number of TCP segments sent containing the RST flag | Count |
| UDP datagrams received without port | com.dynatrace.extension.network_device.udp.noports.count | Number of received UDP datagrams (no application at the destination port) | Count |
| UDP datagram errors | com.dynatrace.extension.network_device.udp.in.errors.count | Number of received and not delivered UDP datagrams (other than no application at the destination port) | Count |
| Metric name | Metric key | Description | Unit |
|---|---|---|---|
| Multicast packets in | com.dynatrace.extension.network_device.if.in.multicast_pkts.count | The number of multicast packets, inbound to the network interface. | Count |
| Multicast packets out | com.dynatrace.extension.network_device.if.out.multicast_pkts.count | The number of multicast packets, outbound from the network interface. | Count |
| Broadcast packets in | com.dynatrace.extension.network_device.if.in.broadcast_pkts.count | The number of broadcast packets, inbound to the network interface. | Count |
| Broadcast packets out | com.dynatrace.extension.network_device.if.out.broadcast_pkts.count | The number of broadcast packets, outbound from the network interface. | Count |
| Unicast packets in | com.dynatrace.extension.network_device.if.in.ucast_pkts.count | The number of unicast packets, inbound to the network interface. | Count |
| Unicast packets out | com.dynatrace.extension.network_device.if.out.ucast_pkts.count | The number of unicast packets, outbound from the network interface. | Count |
| Metric name | Metric key | Description | Unit |
|---|---|---|---|
| BGP Peer Connection State | com.dynatrace.extension.network_device.bgp4.state | The current state of the BGP peer connection. Possible values are idle(1), connect(2), active(3), opensent(4), openconfirm(5), established(6). | State |
| BGP Peer Admin Status | com.dynatrace.extension.network_device.bgp4.admin.status | The desired state of the BGP connection for this peer. Possible values are stop(1), start(2). | State |
| BGP Peer Established Time | com.dynatrace.extension.network_device.bgp4.established_time | The time in seconds this peer has been in the established state or how long since this peer was last in the established state. | Second |
Initial extension release including:
Warnings/action required:
1.341 and a minimum ActiveGate EEC version of 1.333