























Kick-start your app creation
Whether you’re a beginner or a pro, Dynatrace Developer has the tools and support you need to create incredible apps with minimal effort.
Go to Dynatrace Developer
 Apache Kafka
Automatic and intelligent observability with trace and metric insights.
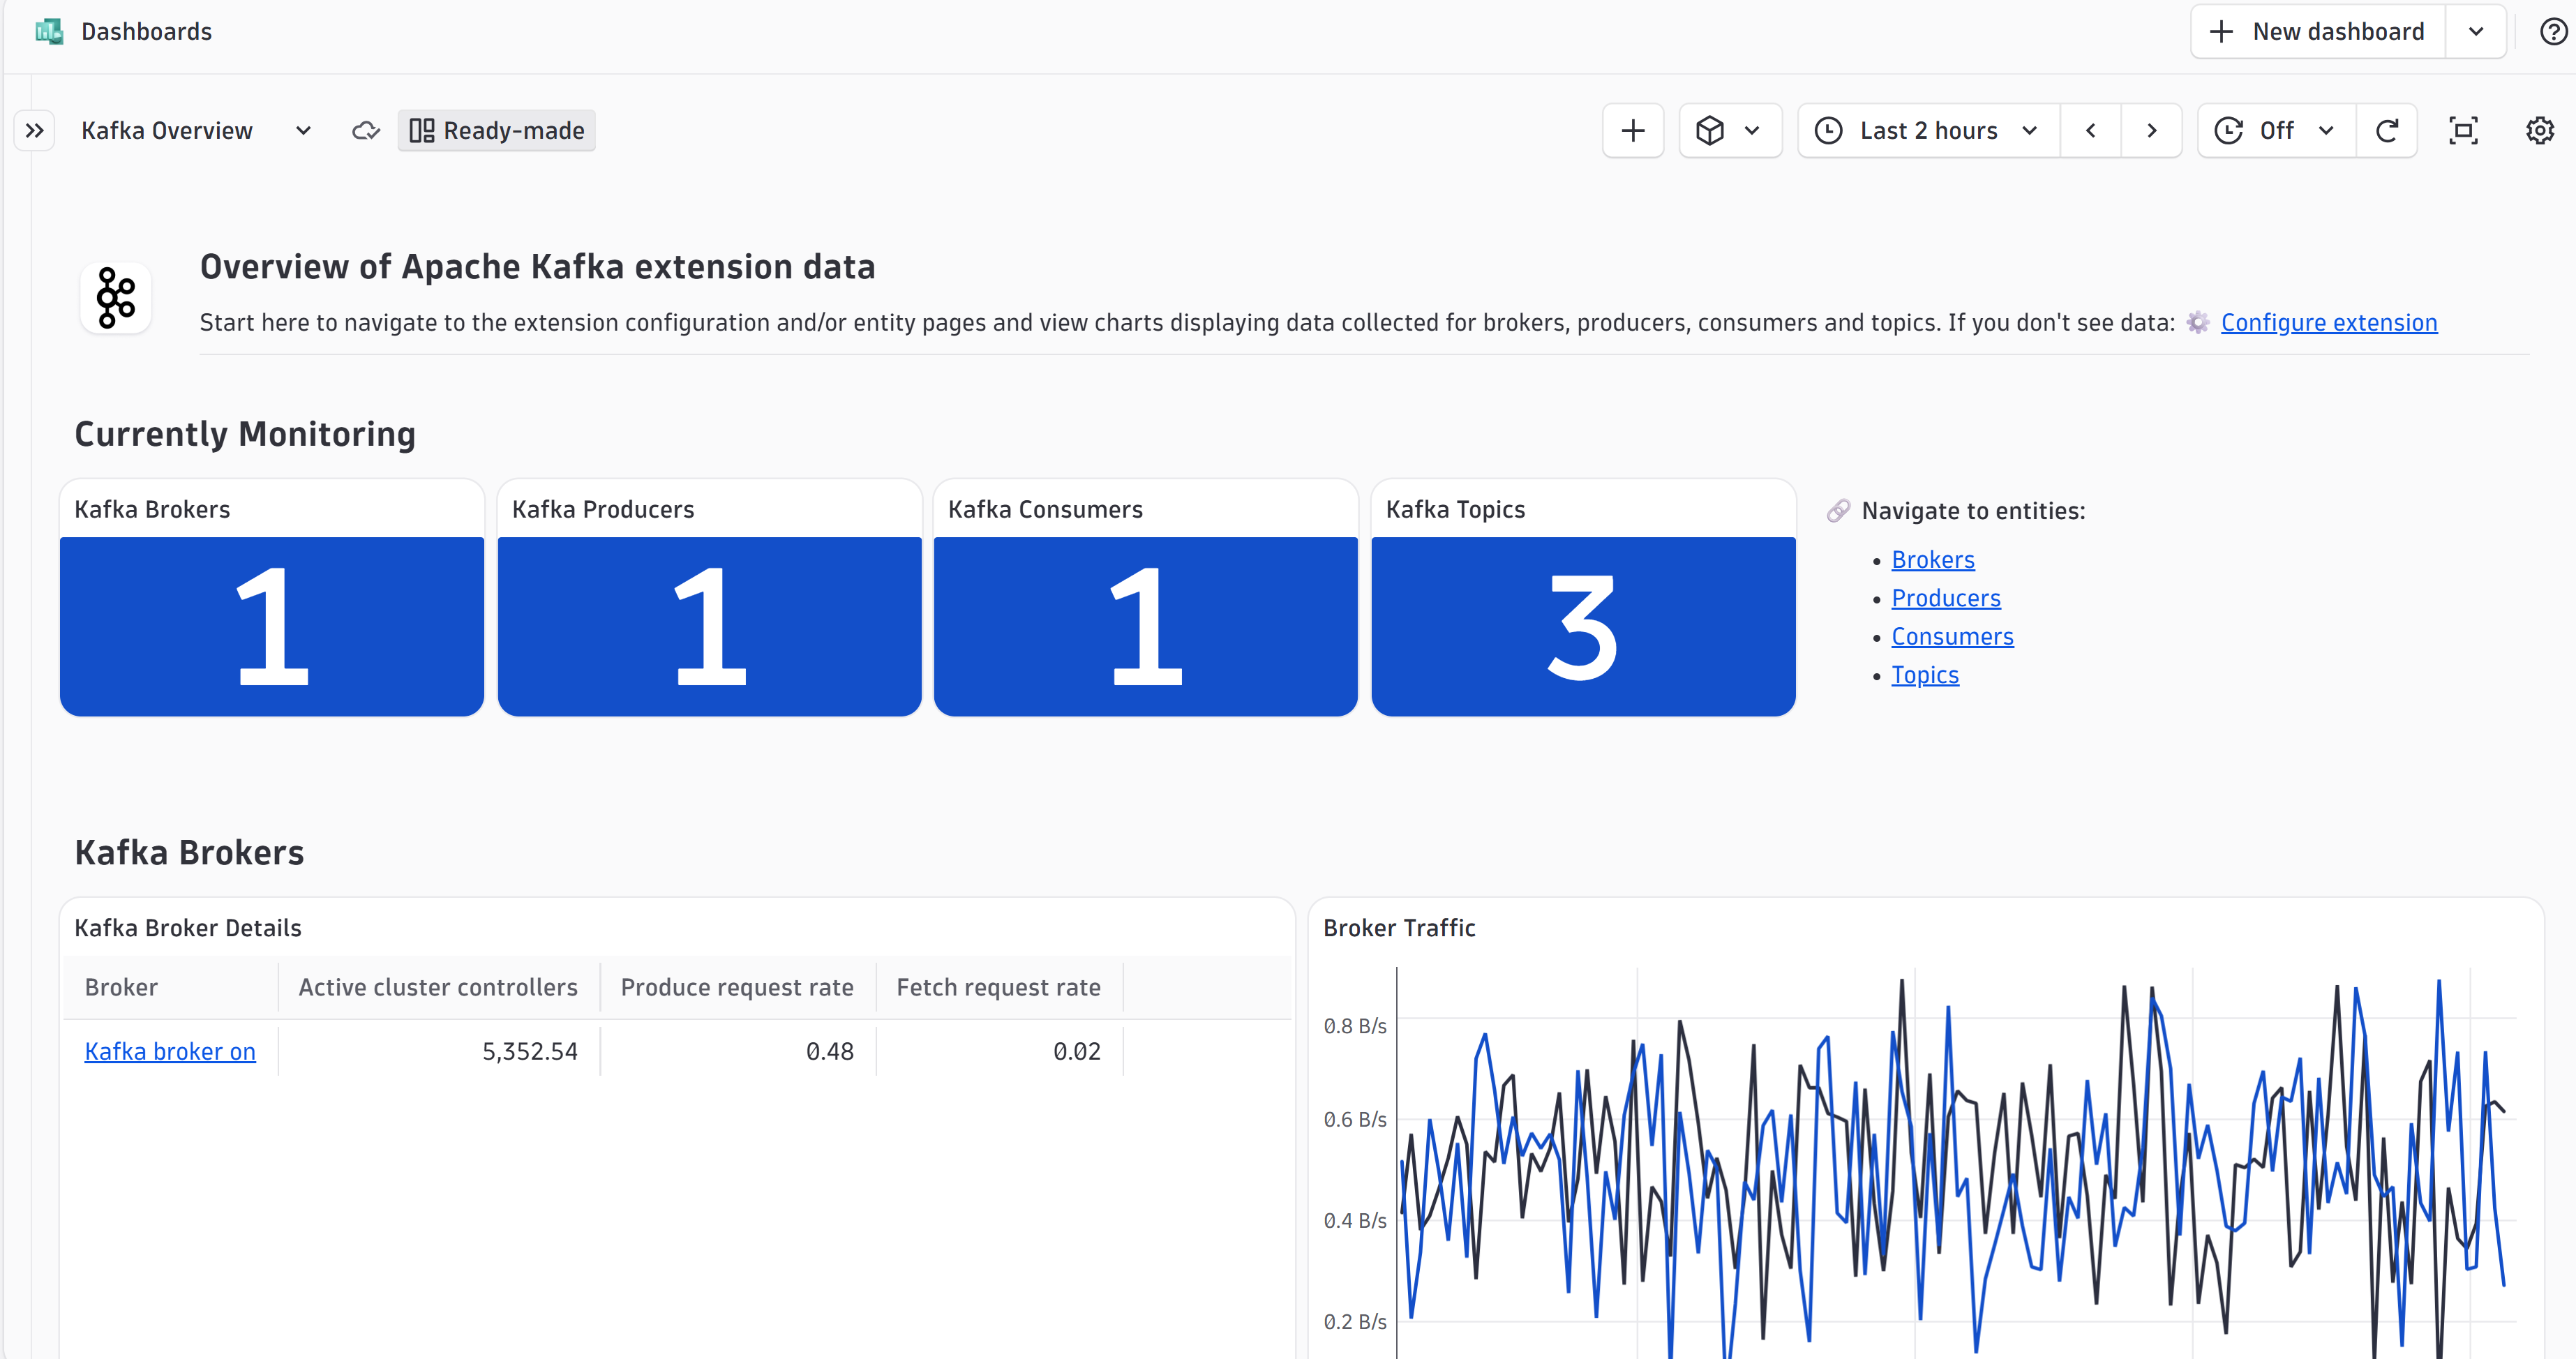
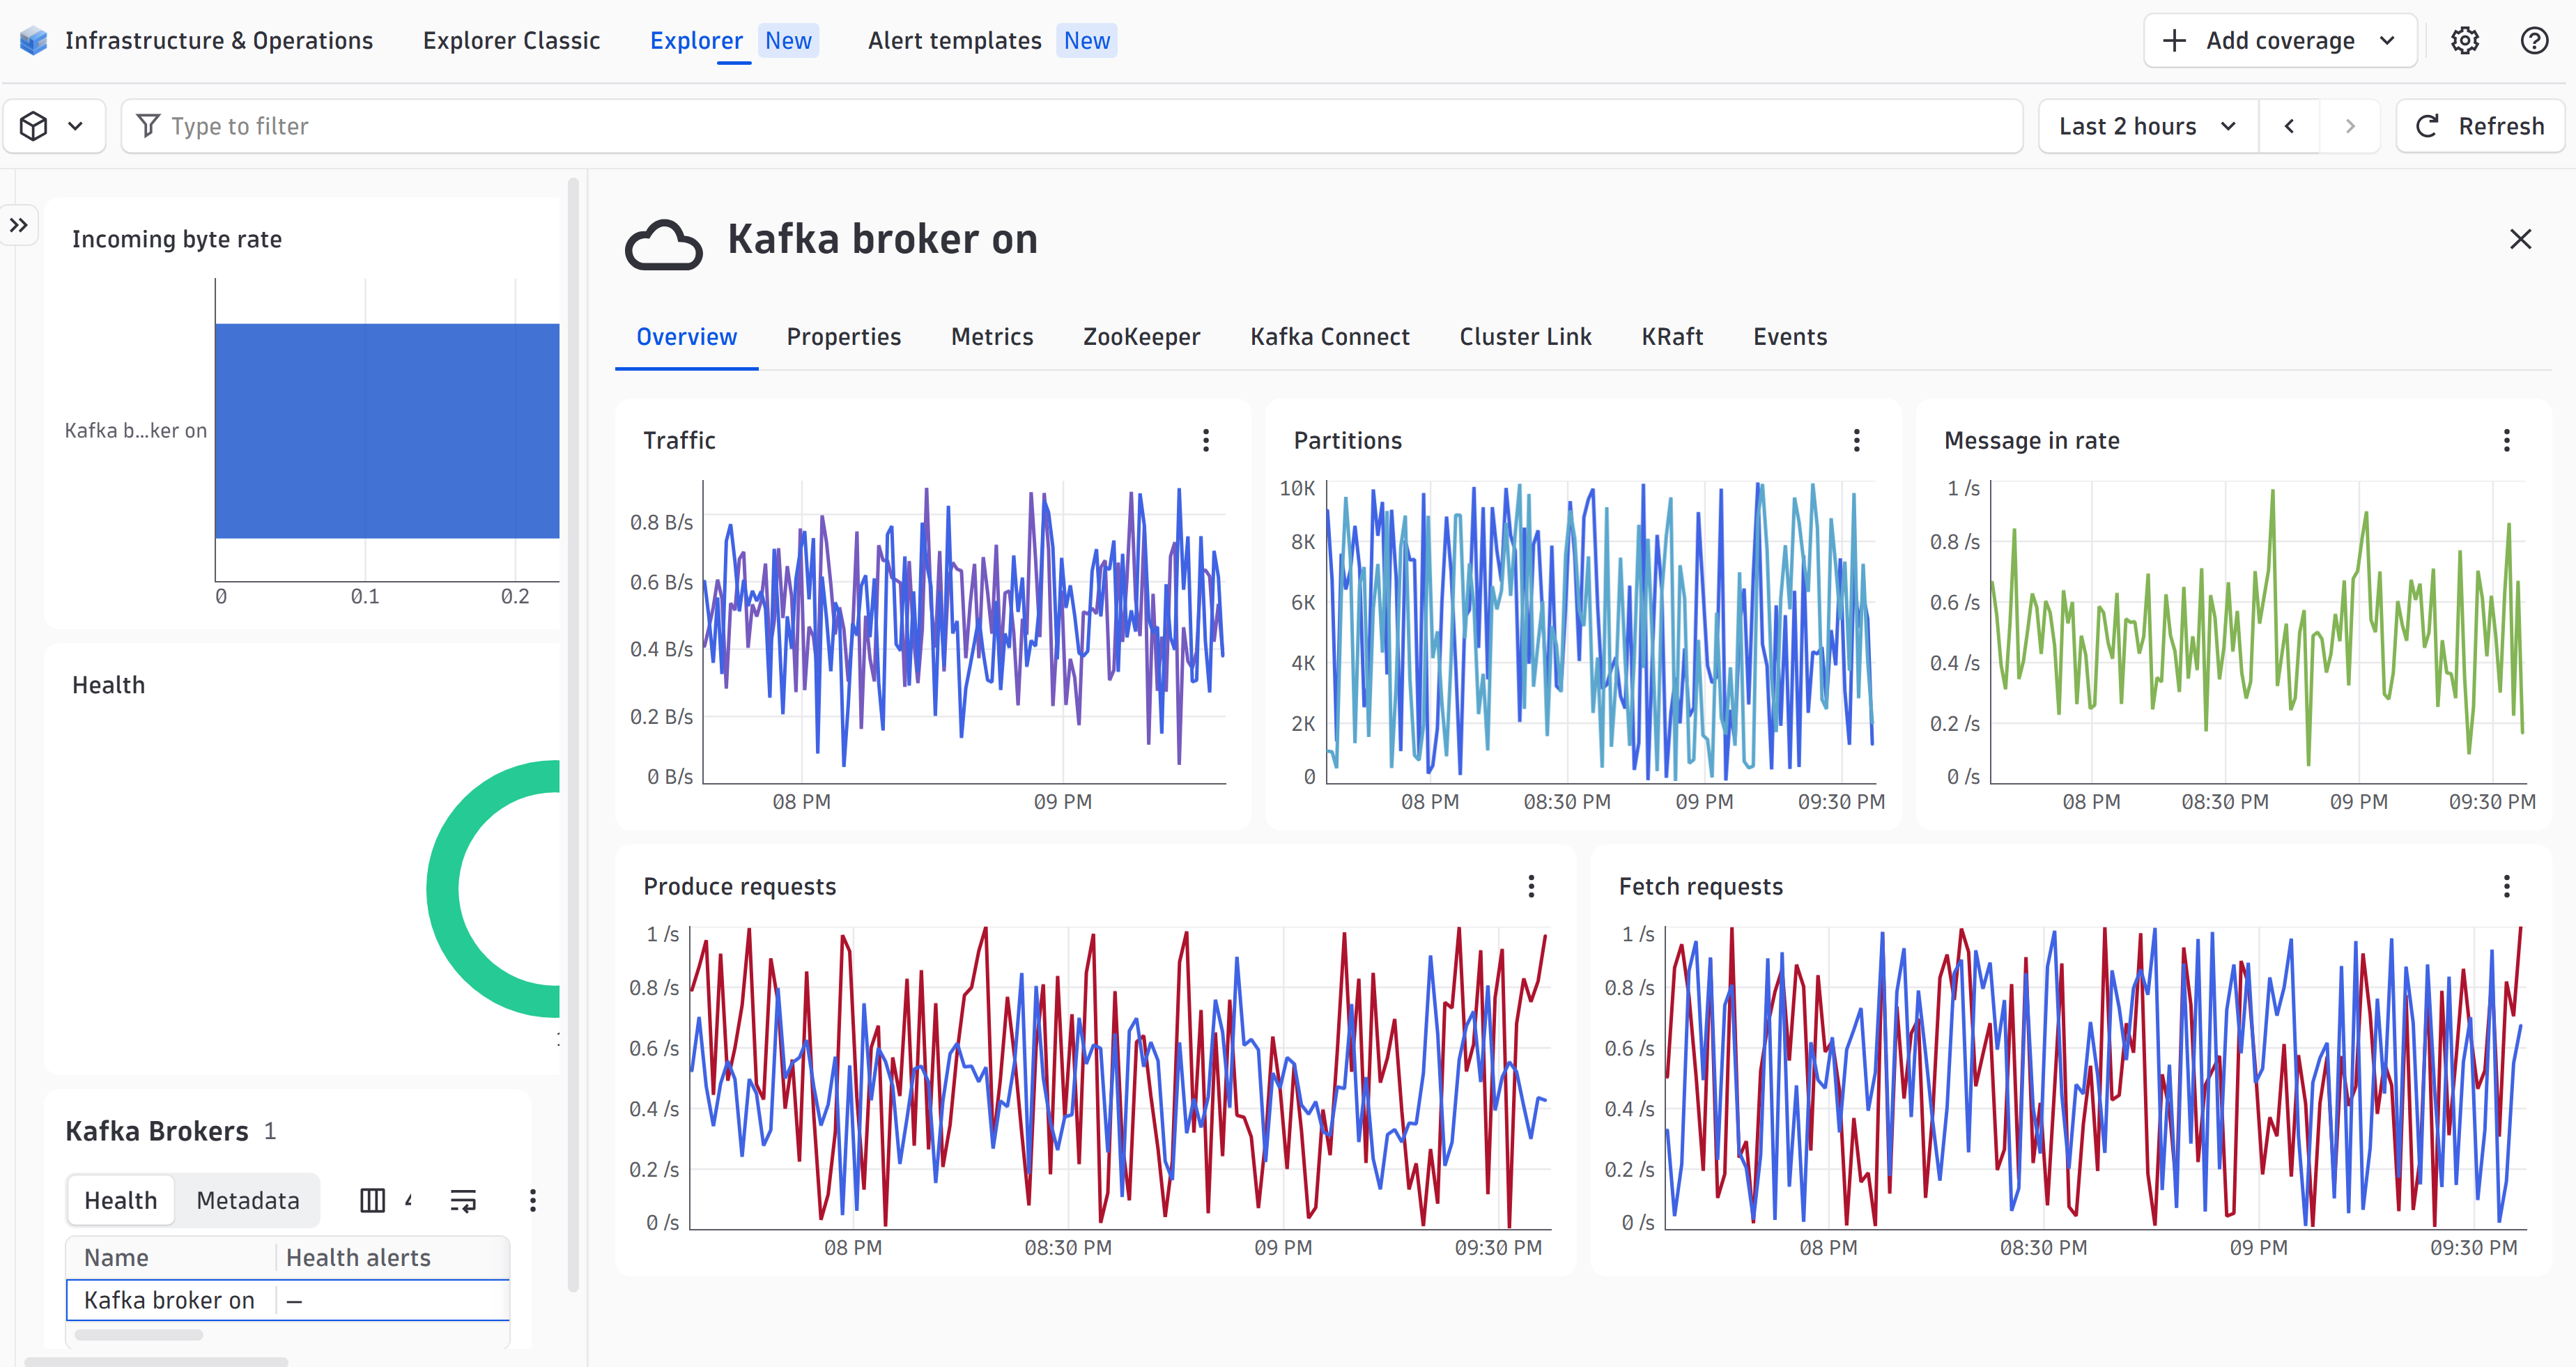
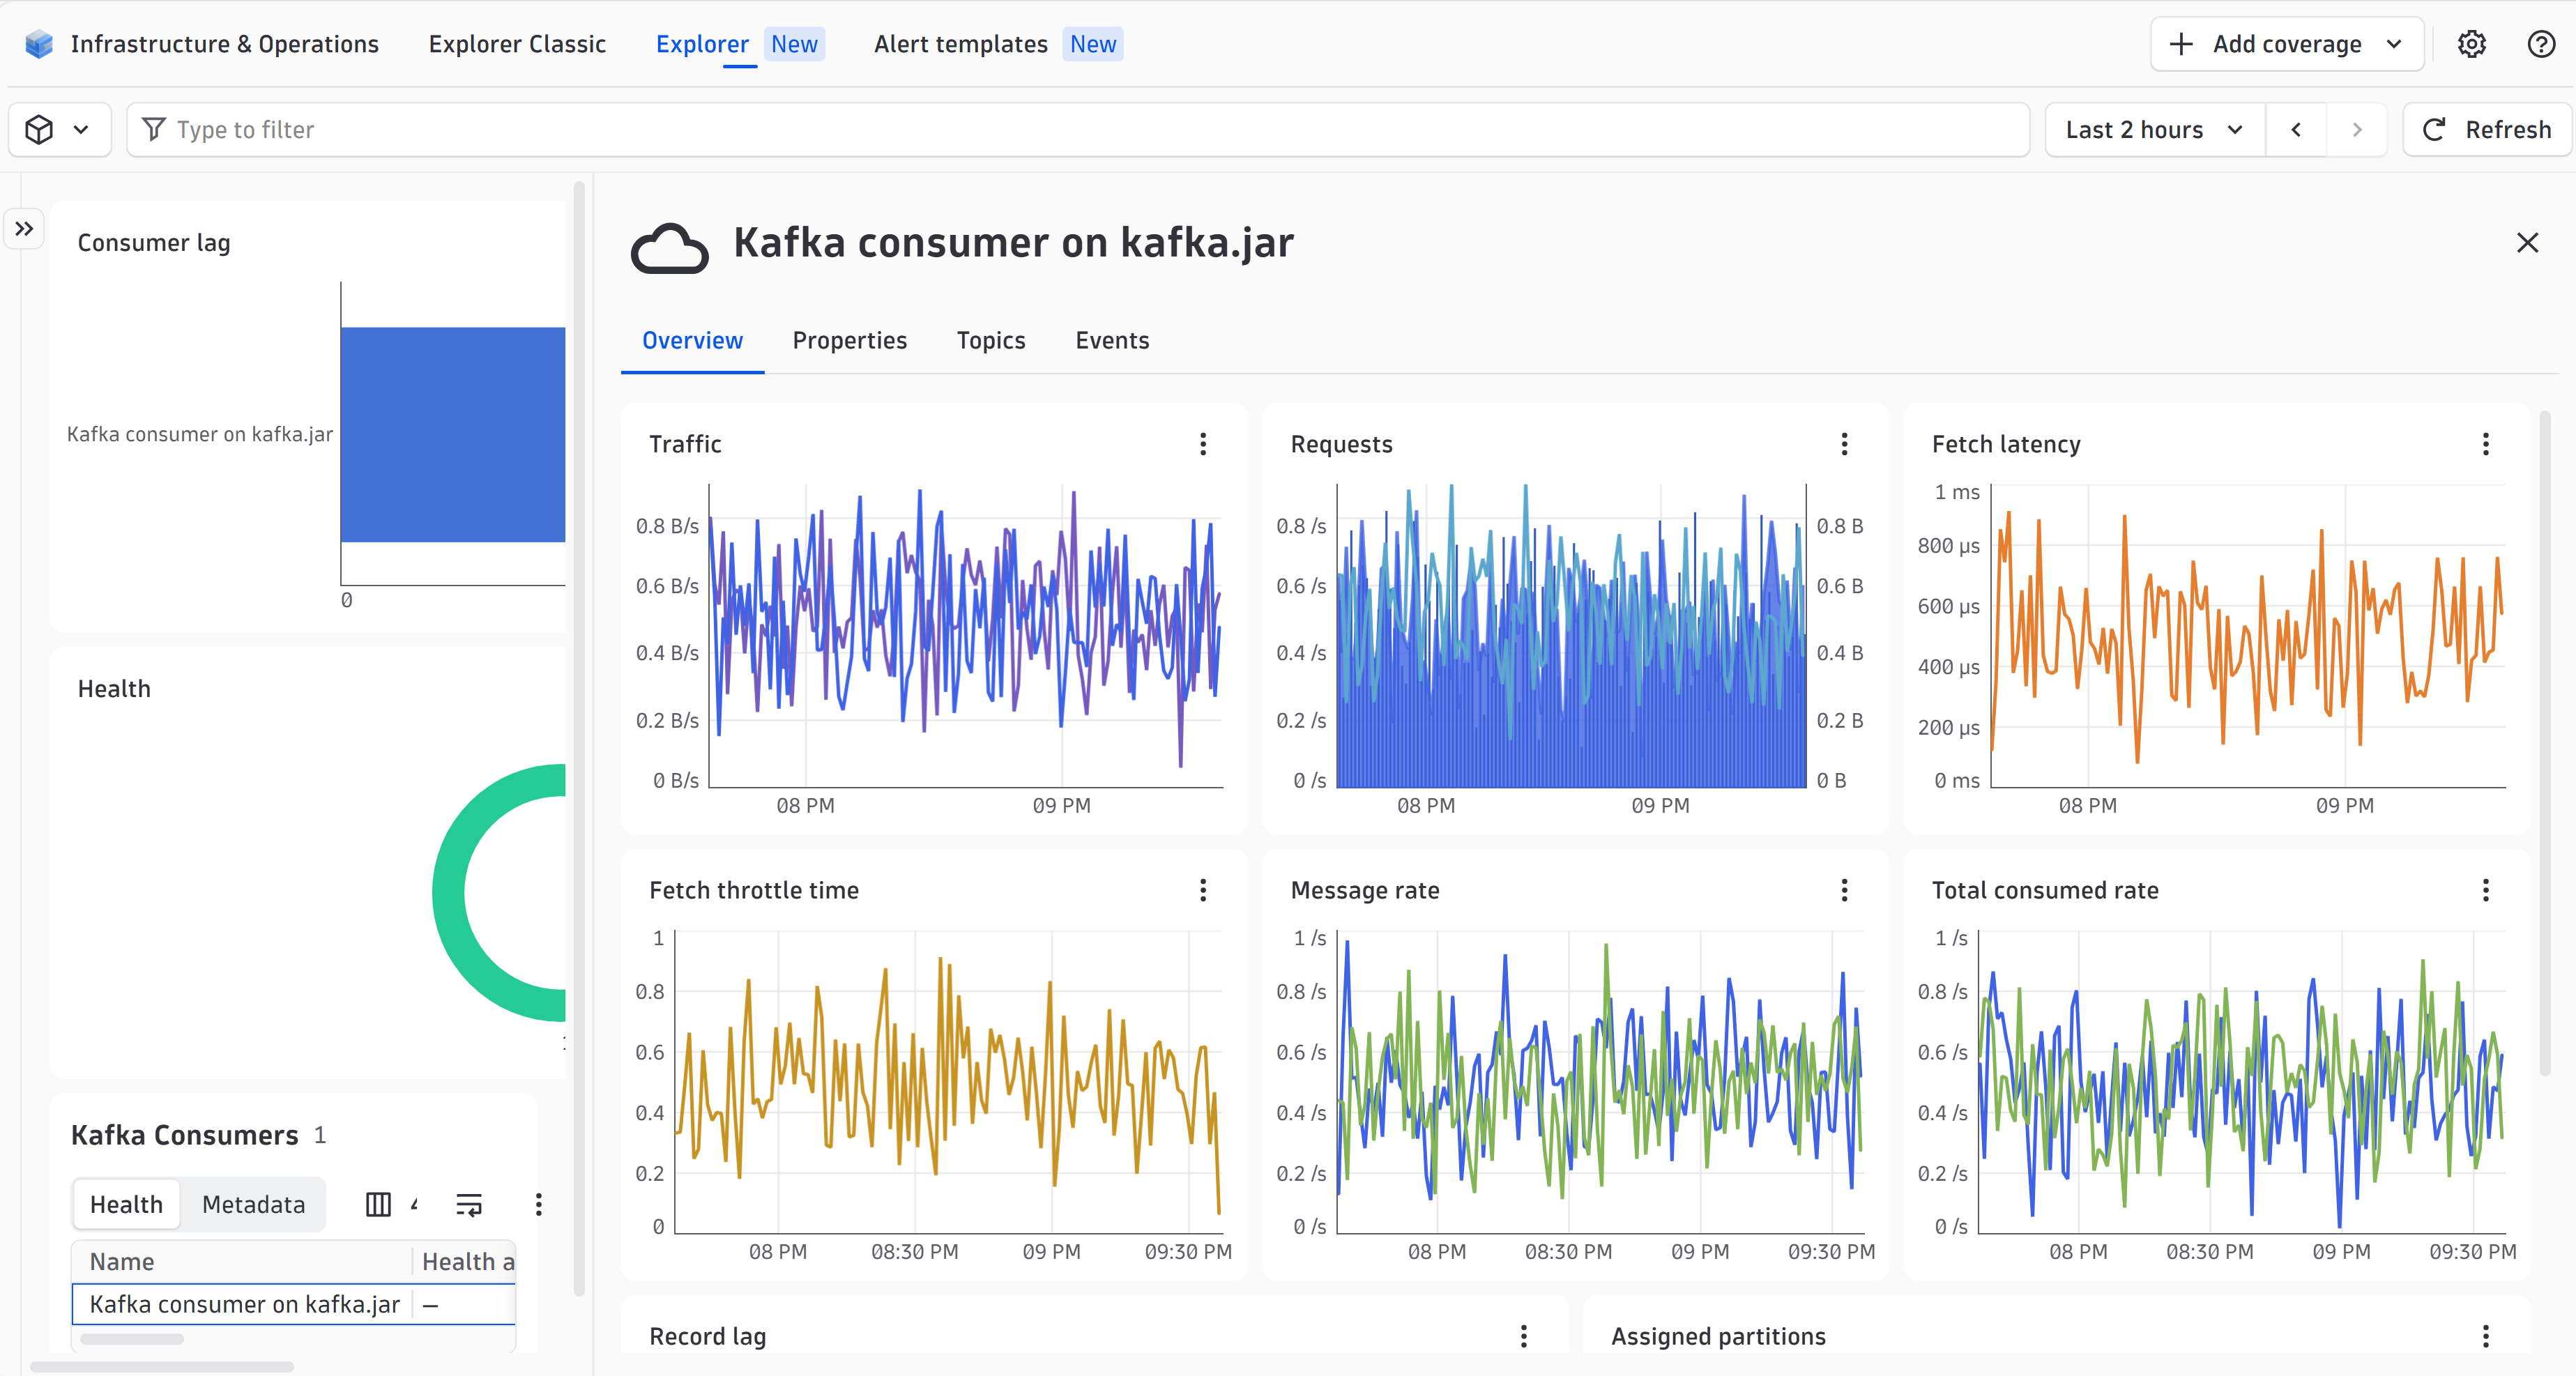
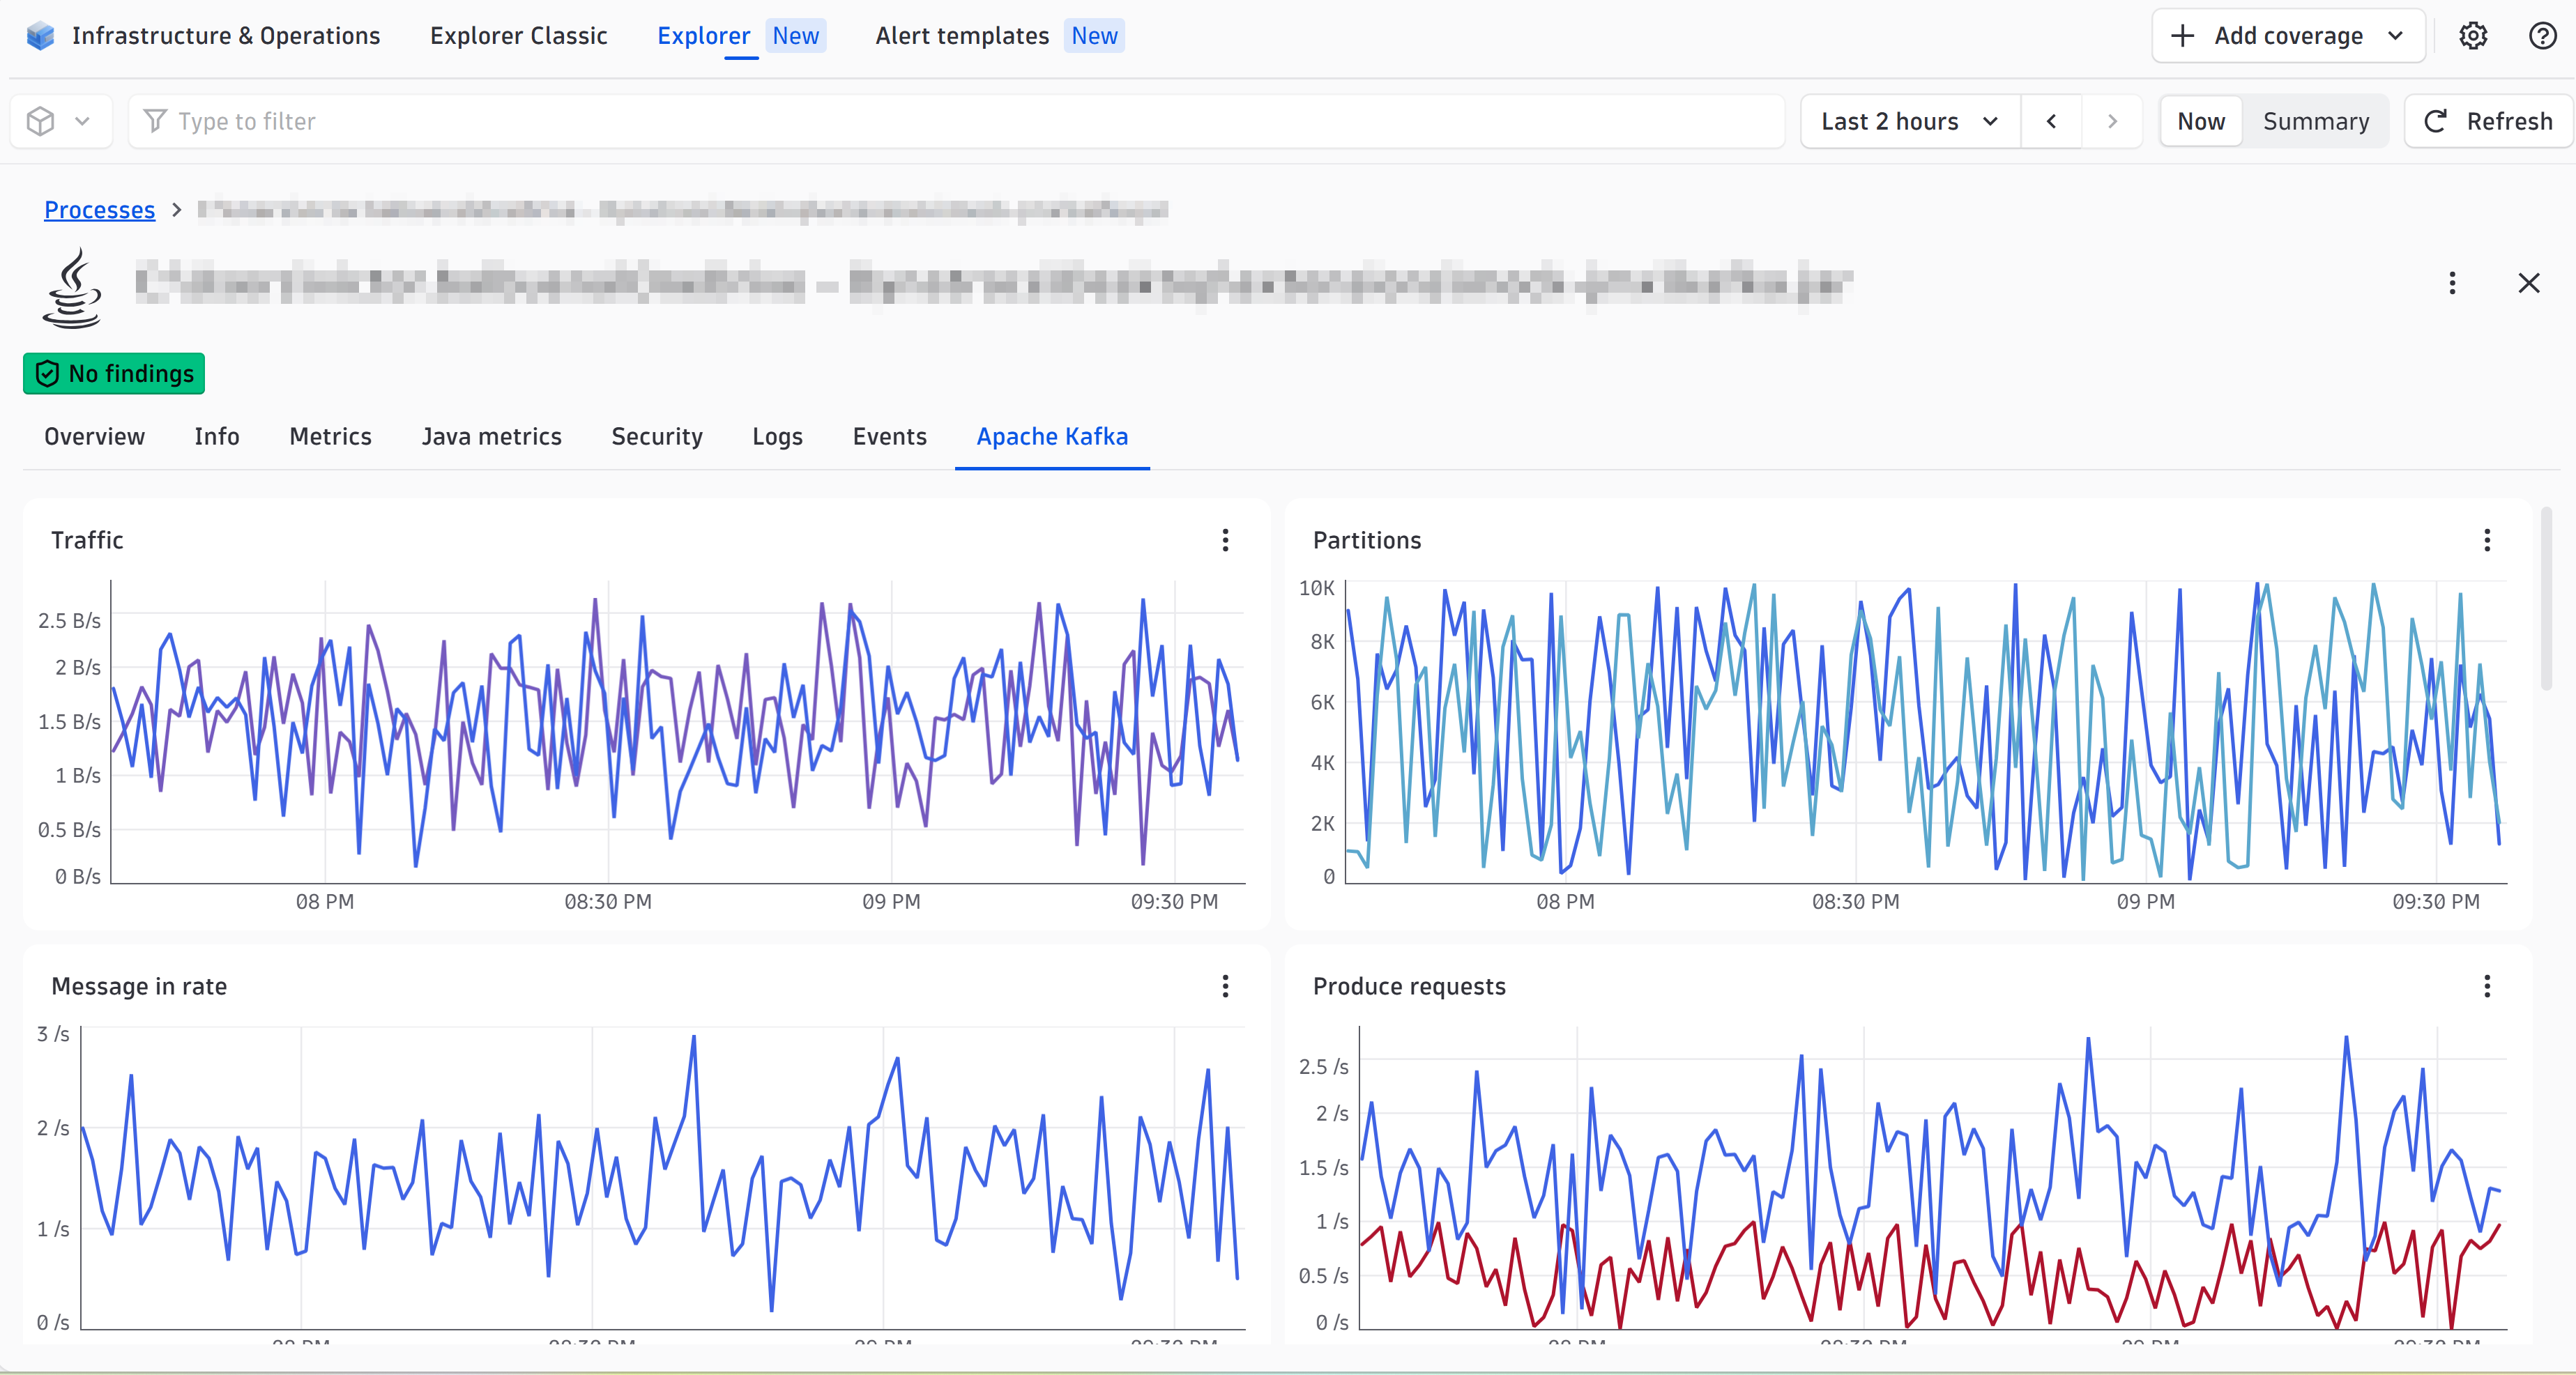
ExtensionWith Dynatrace, you can get observability for Kafka without touching any code, thanks to automatic monitoring. Seamless end-to-end traces for connected producer and consumer clients allow you to diagnose anomalies and pinpoint the root cause of the broken code before your customers are affected. Comprehensive metrics give you insight into your Kafka servers with health and performance metrics for brokers, topics, producers, and consumers. Events point you to critical anomalies, reducing the mean repair time.
For more information on the installation and configuration, please see Apache Kafka extension in the Dynatrace Documentation.
Below is a complete list of the feature sets provided in this version. To ensure a good fit for your needs, individual feature sets can be activated and deactivated by your administrator during configuration.
| Metric name | Metric key | Description | Unit |
|---|---|---|---|
| Kafka Producer - Incoming byte rate | kafka.producer.producer-metrics.incoming-byte-rate | The average number of responses received per second for a node. | BytePerSecond |
| Kafka Producer - Outgoing byte rate | kafka.producer.producer-metrics.outgoing-byte-rate | The average number of outgoing bytes sent per second to all servers. | BytePerSecond |
| Kafka Producer - I/O Wait time | kafka.producer.producer-metrics.io-wait-time-ns-avg | The average length of time the I/O thread spent waiting for a socket ready for reads or writes in nanoseconds. | NanoSecond |
| Kafka Producer - Response rate | kafka.producer.producer-metrics.response-rate | Responses received sent per second. | PerSecond |
| Kafka Producer - Request latency | kafka.producer.producer-metrics.request-latency-avg | The average request latency in ms. | MilliSecond |
| Kafka Producer - Compression rate | kafka.producer.producer-metrics.compression-rate-avg | The average compression rate of record batches, defined as the average ratio of the compressed batch size over the uncompressed size. | PerSecond |
| Kafka Producer - Request size | kafka.producer.producer-metrics.request-size-avg | The average size of all requests in the window. | Byte |
| Kafka Producer - Requests | kafka.producer.producer-metrics.request-rate | The average number of requests sent per second. | PerSecond |
| Kafka Producer - Produce throttle time avg | kafka.producer.producer-metrics.produce-throttle-time-avg | The average time in milliseconds a request was throttled by the broker. | MilliSecond |
| Kafka Producer - Byte rate | kafka.producer.producer-topic-metrics.byte-rate | The average number of bytes sent per second for a topic. | BytePerSecond |
| Kafka Producer - Compression rate | kafka.producer.producer-topic-metrics.compression-rate | The average compression rate of record batches for a topic, defined as the average ratio of the compressed batch size over the uncompressed size. | BytePerSecond |
| Kafka Producer - Failed Requests Rate | kafka.producer.producer-topic-metrics.record-error-rate | The average per-second number of record sends that resulted in errors for a topic. | PerSecond |
| Kafka Producer - Requests Sent Rate | kafka.producer.producer-topic-metrics.record-send-rate | The average number of records sent per second for a topic. | PerSecond |
| Metric name | Metric key | Description | Unit |
|---|---|---|---|
| Kafka Consumer - Requests | kafka.consumer.consumer-metrics.request-rate | The average number of requests sent per second for a node. | PerSecond |
| Kafka Consumer - Request size | kafka.consumer.consumer-metrics.request-size-avg | The average size of all requests in the window. | Byte |
| Kafka Consumer - Incoming byte rate | kafka.consumer.consumer-metrics.incoming-byte-rate | Bytes/second read off all sockets. | BytePerSecond |
| Kafka Consumer - Outgoing byte rate | kafka.consumer.consumer-metrics.outgoing-byte-rate | The average number of outgoing bytes sent per second to all servers. | BytePerSecond |
| Kafka Consumer - Request latency | kafka.consumer.consumer-metrics.request-latency-avg | The average request latency in ms for a node. | MilliSecond |
| Kafka Consumer - Assigned Partitions | kafka.consumer.consumer-metrics.assigned-partitions | The number of partitions currently assigned to the consumer. | Count |
| Kafka Consumer - Messages consumed rate | kafka.consumer.consumer-metrics.records-consumed-rate | The average number of records consumed per second for a topic. | PerSecond |
| Kafka Consumer - Bytes consumed rate | kafka.consumer.consumer-metrics.bytes-consumed-rate | The average number of bytes consumed per second for a topic. | PerSecond |
| Kafka Consumer - Messages consumed rate total | kafka.consumer.consumer-metrics.records-consumed-rate-total | The average number of records consumed per second. | PerSecond |
| Kafka Consumer - Bytes consumed rate total | kafka.consumer.consumer-metrics.bytes-consumed-rate-total | The average number of bytes consumed per second. | PerSecond |
| Kafka Consumer - Fetch latency | kafka.consumer.consumer-metrics.fetch-latency-avg | The average time taken for a fetch request. | MilliSecond |
| Kafka Consumer - Fetch throttle time avg | kafka.consumer.consumer-fetch-manager-metrics.fetch-throttle-time-avg | The average time in milliseconds a fetch request was throttled by the broker. | MilliSecond |
| Metric name | Metric key | Description | Unit |
|---|---|---|---|
| Kafka Controller - Leader election rate | kafka.controller.ControllerStats.LeaderElectionRateAndTimeMs.OneMinuteRate | The broker leader election rate and latency in milliseconds. This is non-zero when there are broker failures. | MilliSecond |
| Kafka Controller - Unclean election rate | kafka.controller.ControllerStats.UncleanLeaderElectionsPerSec.OneMinuteRate | The unclean broker leader election rate. Should be 0. | PerSecond |
| Kafka Server - Leader count | kafka.server.ReplicaManager.LeaderCount.Value | The number of replicas for which this broker is the leader. | Count |
| Metric name | Metric key | Description | Unit |
|---|---|---|---|
| Kafka Server - Handler Pool Idle Percent Rate | kafka.server.handler.average-idle-percent.rate | The average fraction of time the request handler threads are idle. Values are between 0 meaning all resources are used and 1 meaning all resources are available. | PerSecond |
| Metric name | Metric key | Description | Unit |
|---|---|---|---|
| Kafka Controller - Offline partitions | kafka.controller.KafkaController.OfflinePartitionsCount | The number of partitions that don't have an active leader and are therefore not writable or readable. | Count |
| Kafka Controller - Active cluster controllers | kafka.controller.KafkaController.ActiveControllerCount.Value | Indicates whether the broker is the controller broker. | Count |
| Metric name | Metric key | Description | Unit |
|---|---|---|---|
| Kafka Server - Disk Read Rate | kafka.server.disk.read-bytes | The total number of bytes read by the broker process, including reads from all disks. The total doesn't include reads from page cache. Available only on Linux-based systems. | PerSecond |
| Kafka Server - Disk Write Rate | kafka.server.disk.write-bytes | The total number of bytes written by the broker process, including writes from all disks. Available only on Linux-based systems. | PerSecond |
| Metric name | Metric key | Description | Unit |
|---|---|---|---|
| Kafka Server - Purgatory Produce Size | kafka.server.purgatory.produce-delay-size | Requests waiting in the produce purgatory. | Count |
| Kafka Server - Purgatory Fetch Size | kafka.server.purgatory.fetch-delay-size | Requests waiting in the fetch purgatory. | Count |
| Metric name | Metric key | Description | Unit |
|---|---|---|---|
| Kafka Connect - Requests | kafka.connect.connect-metrics.request-rate | The average number of requests sent per second. | PerSecond |
| Kafka Connect - Outgoing byte rate | kafka.connect.connect-metrics.outgoing-byte-rate | The average number of outgoing bytes sent per second to all servers. | BytePerSecond |
| Kafka Connect - Request size | kafka.connect.connect-metrics.request-size-avg | The average size of all requests in the window. | Byte |
| Kafka Connect - Incoming byte rate | kafka.connect.connect-metrics.incoming-byte-rate | Bytes/second read off all sockets. | BytePerSecond |
| Metric name | Metric key | Description | Unit |
|---|---|---|---|
| Active link count | kafka.cluster-link.link-count | Total number of links in an active state. | Count |
| Active mirror count | kafka.cluster-link.mirror-topic-count | Total number of active (healthy) mirror topics. | Count |
| Cluster link max lag | kafka.cluster-link.max-lag | Maximum lag in messages between the replicas on the destination cluster and the leader replica on the source cluster. | Count |
| Fetched bytes per second | kafka.cluster-link.bytes-per-sec.count | Rate at which data is fetched from the source cluster. Indicates amount of throughput in bytes per second on the cluster link. | BytePerSecond |
| Fetched throttle time | kafka.cluster-link.fetch-throttle-time-avg | Gives throttle times for the Cluster Linking fetchers. May indicate increases in lag on the cluster link due to throttling/quotas being enforced. | MilliSecond |
| Active task count | kafka.cluster-link.link-task-count | Monitor the state of link level tasks. | Count |
| Failed reverse connection count | kafka.cluster-link.reverse-connection-failed-total | Total count of reverse connections that failed for this cluster link. Only available for outbound connections. | Count |
| Authentication problems | kafka.cluster-link.authentication-problems | Unavailable links due to authentication. | Count |
| Unavailable link (by reason) | kafka.cluster-link.unavailable-link-count | Unavailable links due to authentication. | Count |
| Controller reverse connection count | kafka.cluster-link.controller-reverse-connection-count | Number of persistent reverse connections for this link between the local broker and the remote link coordinator. | Count |
| Controller reverse connection count | kafka.cluster-link.remote-admin-request-time | Admin request processing time. | MilliSecond |
| Background thread count | kafka.cluster-link.background-thread-usage | Background thread active usage. | Count |
| Metric name | Metric key | Description | Unit |
|---|---|---|---|
| Kafka Log - Log flush 95th percentile | kafka.log.LogFlushStats.LogFlushRateAndTimeMs.Percentile95th | Log flush rate and time in milliseconds. | MilliSecond |
| Kafka Log - Log flush mean time | kafka.log.LogFlushStats.LogFlushRateAndTimeMs.Mean | Log flush rate and time in milliseconds. | MilliSecond |
| Kafka Log - Log end offset | kafka.log.Log.LogEndOffset | The offset of the next message that will be appended to the log, by topic and partition. | Count |
| Metric name | Metric key | Description | Unit |
|---|---|---|---|
| Kafka Server - Consumer group lag offsets | kafka.server.tenant-metrics.consumer-lag-offsets | The difference between the last offset stored by the broker and the last committed offset for a specific consumer group name, client ID, member ID, partition ID, topic name, and group protocol. Confluent Platform only. | Count |
| Metric name | Metric key | Description | Unit |
|---|---|---|---|
| Kafka Connector - Status | kafka.connector.status | Equals 1 if the status is running, 0 otherwise. | Count |
| Kafka Connector - Task status | kafka.connector.task.status | Equals 1 if the status is running, 0 otherwise. | Count |
| Kafka Connector - Task pause ratio | kafka.connector.task.pause-ratio | The fraction of time this task has spent in the pause state. | Count |
| Kafka Connector - Task running ratio | kafka.connector.task.running-ratio | The fraction of time this task has spent in the running state. | Count |
| Kafka Connector - Task success ratio | kafka.connector.task.offset-commit-success-percentage | The average percentage of this task's offset commit attempts that succeeded. | Percent |
| Kafka Connector - Task commit time (max) | kafka.connector.task.offset-commit-max-time-ms | The maximum time in milliseconds taken by this task to commit offsets. | MilliSecond |
| Kafka Connector - Task failure ratio | kafka.connector.task.offset-commit-failure-percentage | The maximum time in milliseconds taken by this task to commit offsets. | Percent |
| Kafka Connector - Task commit time (avg) | kafka.connector.task.offset-commit-avg-time-ms | The average time in milliseconds taken by this task to commit offsets. | MilliSecond |
| Kafka Connector - Task batch size (max) | kafka.connector.task.batch-size-max | The maximum size of the batches processed by the connector. | Byte |
| Kafka Connector - Task batch size (avg) | kafka.connector.task.batch-size-avg | The average size of the batches processed by the connector. | Byte |
| Metric name | Metric key | Description | Unit |
|---|---|---|---|
| Kafka Broker - Incoming byte rate | kafka.server.BrokerTopicMetrics.BytesInPerSec.OneMinuteRate | The rate at which data sent from producers is consumed by the broker. | BytePerSecond |
| Kafka Broker - Mirror topic bytes in rate | kafka.server.BrokerTopicMetrics.MirrorBytesInPerSec.OneMinuteRate | The rate at which mirror bytes are received, by topic. | PerSecond |
| Kafka Broker - Outgoing byte rate | kafka.server.BrokerTopicMetrics.BytesOutPerSec.OneMinuteRate | The rate at which data sent from other brokers is consumed by the follower broker. | BytePerSecond |
| Kafka Broker - Messages in rate | kafka.server.BrokerTopicMetrics.MessagesInPerSec.OneMinuteRate | The rate at which individual messages are consumed by the broker. | PerSecond |
| Kafka Broker - Follower fetch requests rate | kafka.server.BrokerTopicMetrics.TotalFollowerFetchRequestsPerSec.OneMinuteRate | The follower fetch request rate for the broker. | PerSecond |
| Kafka Broker - Produce message conversions rate | kafka.server.BrokerTopicMetrics.ProduceMessageConversionsPerSec.OneMinuteRate | The rate at which produce messages are converted, by topic. | PerSecond |
| Kafka Broker - Partitions | kafka.server.ReplicaManager.PartitionCount | The number of partitions in the broker. | Count |
| Kafka Broker - Under replicated partitions | kafka.server.ReplicaManager.UnderReplicatedPartitions | The number of partitions that have not been fully replicated in the follower replicas. | Count |
| Kafka Broker - Under minimum in-sync replica partitions | kafka.server.ReplicaManager.UnderMinIsrPartitionCount | The number of partitions whose in-sync replicas count is less than minIsr. | Count |
| Kafka Broker - Produce request rate | kafka.server.BrokerTopicMetrics.TotalProduceRequestsPerSec.OneMinuteRate | The produce request rate per second. | PerSecond |
| Kafka Broker - Fetch request rate | kafka.server.BrokerTopicMetrics.TotalFetchRequestsPerSec.OneMinuteRate | The fetch request rate per second. | PerSecond |
| Kafka Broker - Failed produce requests | kafka.server.BrokerTopicMetrics.FailedProduceRequestsPerSec.OneMinuteRate | The produce request rate for requests that failed. | PerSecond |
| Kafka Broker - Failed fetch requests | kafka.server.BrokerTopicMetrics.FailedFetchRequestsPerSec.OneMinuteRate | The fetch request rate for requests that failed. | PerSecond |
| Kafka Server - Max follower lag | kafka.server.ReplicaFetcherManager.MaxLag.Replica.Value | The maximum lag between the time that messages are received by the leader replica and by the follower replicas. | Count |
| Kafka Server - Current follower lag | kafka.server.FetcherLagMetrics.ConsumerLag.Value | The lag in number of messages per follower replica. | Count |
| Kafka Server - Fetch Conversions Rate | kafka.server.FetchConversionsRate.OneMinuteRate | - | Count |
| Kafka Server - Produce Conversions Rate | kafka.server.ProduceConversionsRate.OneMinuteRate | - | Count |
| Metric name | Metric key | Description | Unit |
|---|---|---|---|
| Kafka Consumer - Consumer lag | kafka.consumer.consumer-metrics.records-lag | The latest lag of the partition. | Count |
| Kafka Consumer - Consumer lag average | kafka.consumer.consumer-metrics.records-lag-avg | The average lag of the partition. | Count |
| Kafka Consumer - Consumer lag maximum | kafka.consumer.consumer-metrics.records-lag-max | The max lag of the partition. | Count |
| Metric name | Metric key | Description | Unit |
|---|---|---|---|
| Kafka Partition - Observer replicas count | kafka.cluster.Partition.ObserverReplicasCount | The number of observer replicas for a partition in a Confluent Multi-Region Cluster (MRC), by topic and partition. | Count |
| Kafka Partition - Caught up replicas count | kafka.cluster.Partition.CaughtUpReplicasCount | The number of replicas considered caught up to the topic partition leader. This may be greater than the ISR size, as observers may be caught up but not part of the ISR. By topic and partition. | Count |
| Kafka Partition - Is not caught up | kafka.cluster.Partition.IsNotCaughtUp | Reports 1 (true) if not all replicas are considered caught up to the partition leader, otherwise 0. By topic and partition. | Count |
| Kafka Partition - Observers in ISR count | kafka.cluster.Partition.ObserversInIsrCount | The number of observers that are currently in the in-sync replicas (ISR) list for a partition in a Confluent Multi-Region Cluster (MRC), by topic and partition. | Count |
| Metric name | Metric key | Description | Unit |
|---|---|---|---|
| Records appended rate | kafka.raft.append-records-rate | The average number of records appended per sec by the leader of the raft quorum. | Count |
| Commit latency (avg) | kafka.raft.commit-latency-avg | The average time in milliseconds to commit an entry in the raft log. | MilliSecond |
| Commit latency (max) | kafka.raft.commit-latency-max | The maximum time in milliseconds to commit an entry in the raft log. | MilliSecond |
| Record fetch rate | kafka.raft.fetch-records-rate | The average number of records fetched from the leader of the raft quorum. | Count |
| Log end epoch | kafka.raft.log-end-epoch | The current raft log end epoch. | Count |
| Log end offset | kafka.raft.log-end-offset | The current raft log end offset. | Count |
| Current leader ID | kafka.raft.current-leader | The current quorum leader's id; -1 indicates unknown. | Count |
| Metric name | Metric key | Description | Unit |
|---|---|---|---|
| Last applied record offset | kafka.raft.last-applied-record-offset | The offset of the last record from the cluster metadata partition that was applied by the broker. | Count |
| Last applied record timestamp | kafka.raft.last-applied-record-timestamp | The timestamp of the last record from the cluster metadata partition that was applied by the broker. | Count |
| Last applied record lag | kafka.raft.last-applied-record-lag-ms | The difference between now and the timestamp of the last record from the cluster metadata partition that was applied by the broker. | MilliSecond |
| Metadata load error count | kafka.raft.metadata-load-error-count | The number of errors encountered by the BrokerMetadataListener while loading the metadata log and generating a new MetadataDelta based on it. | Count |
| Metadata apply error count | kafka.raft.metadata-apply-error-count | The number of errors encountered by the BrokerMetadataPublisher while applying a new MetadataImage based on the latest MetadataDelta. | Count |
| Metric name | Metric key | Description | Unit |
|---|---|---|---|
| Kafka Network - Produce requests per second | kafka.network.RequestMetrics.RequestsPerSec.Produce.OneMinuteRate | The total number of requests made for produce per second | PerSecond |
| Kafka Network - FetchConsumer requests per second | kafka.network.RequestMetrics.RequestsPerSec.FetchConsumer.OneMinuteRate | The total number of requests made for fetch consumer per second | PerSecond |
| Kafka Network - FetchFollower requests per second | kafka.network.RequestMetrics.RequestsPerSec.FetchFollower.OneMinuteRate | The total number of requests made for fetch follower per second | PerSecond |
| Kafka Network - Total time per Produce request | kafka.network.RequestMetrics.TotalTimeMs.Produce.Count | Total time, in milliseconds, spent processing requests, for produce. | MilliSecond |
| Kafka Network - Total time per FetchConsumer request | kafka.network.RequestMetrics.TotalTimeMs.FetchConsumer.Count | Total time, in milliseconds, spent processing requests, for fetch consumer. | MilliSecond |
| Kafka Network - Total time per FetchFollower request | kafka.network.RequestMetrics.TotalTimeMs.FetchFollower.Count | Total time, in milliseconds, spent processing requests, for pfetch follower. | MilliSecond |
| Kafka Network - Request queue size | kafka.network.RequestChannel.RequestQueueSize.Value | Size of the request queue. | Count |
| Kafka Network - Response queue size | kafka.network.RequestChannel.ResponseQueueSize.Value | Size of the response queue. | Count |
| Kafka Network - Network processor average idle percent | kafka.network.SocketServer.NetworkProcessorAvgIdlePercent | The average fraction of time the network processor threads are idle. | Percent |
| Metric name | Metric key | Description | Unit |
|---|---|---|---|
| Kafka Server - ZooKeeper disconnects | kafka.server.SessionExpireListener.ZooKeeperDisconnectsPerSec.OneMinuteRate | A meter that provides the number of recent ZooKeeper client disconnects. | PerSecond |
| Kafka Server - ZooKeeper expires | kafka.server.SessionExpireListener.ZooKeeperExpiresPerSec.OneMinuteRate | The number of ZooKeeper sessions that have expired. | PerSecond |
| Kafka Server - Zookeeper Active Connections | kafka.server.active-connections | The number of currently open connections to the broker. | Count |
Messaging instead of Application.1.343.0.kafka.consumer.consumer-metrics.records-lag, kafka.consumer.consumer-metrics.records-lag-avg and kafka.consumer.consumer-metrics.records-lag-max now belong to the new consumer-records-lag feature set.kafka.consumer.consumer-metrics.records-consumed-rate and kafka.consumer.consumer-metrics.bytes-consumed-rate now always split by topic, and new metrics kafka.consumer.consumer-metrics.records-consumed-rate-total and kafka.consumer.consumer-metrics.bytes-consumed-rate-total, which do not split by topic, have been added.kafka.server.tenant-metrics.consumer-lag-offsetskafka.log.Log.LogEndOffsetkafka.cluster.Partition.ObserversInIsrCountkafka.cluster.Partition.IsNotCaughtUpkafka.cluster.Partition.CaughtUpReplicasCountkafka.cluster.Partition.ObserverReplicasCountkafka.consumer.consumer-fetch-manager-metrics.fetch-throttle-time-avgkafka.producer.producer-metrics.produce-throttle-time-avgkafka.consumer.consumer-metrics.assigned-partitions to monitor Kafka partitions unassigned to consumers.1.318.0 or higher.broker-metrics feature set
kafka.server.ReplicaManager.UnderMinIsrPartitionCountnetwork-metrics feature set
kafka.network.RequestChannel.ResponseQueueSize.Valuekafka.network.SocketServer.NetworkProcessorAvgIdlePercentMirror topic bytes in ratestatus dimension.Topic name filter which can be used to filter out the topics that will be monitored.client-id is no longer used to generate these entities but only the process_group_instanceand the host will be considered. This will generate new entity IDs for all your existing consumers and producers, which will break any configuration (metric events, dashboards, etc.) that use those individual IDs. The name of these entities will also change, as it was based on the client-idpreviously.client-id, instead of per entity.client-id is no longer used for generating consumer and producer entities, we no longer run into the entity dimension limitation that prevented new data from being ingested.No release notes