
As organizations embrace cloud-native technologies, system architectures have dramatically increased in complexity and scale. Customer experiences are more important than ever, and as a result, IT teams face mounting pressure to track and respond to issues much faster. To address these challenges, teams are turning to observability solutions so they can proactively identify and resolve issues and automate workflows in their highly distributed and complex computing environments. But what is observability, and what do teams need to do it right?
What is observability?
In IT and cloud computing, observability is the ability to measure a system’s current state based on the data it generates, recorded as logs, metrics, and traces:
- Logs record the details of an event
- Metrics capture the numeric measurements used to quantify the performance and health of services
- Traces track how services connect from end to end in response to requests
Observability has become more critical in recent years as cloud-native environments have gotten more complex, and the potential root causes for a failure or anomaly have become more difficult to pinpoint.
Because cloud services rely on a distributed and dynamic architecture, observability may also refer to the specific software tools and practices organizations use to interpret cloud performance data.
How observability works
Observability relies on telemetry derived from instrumentation that comes from the endpoints and services in your multicloud computing environments. In these modern environments, every hardware, software, and cloud infrastructure component and every container, open source tool, and microservice generates records of every activity. The goal of observability is to understand what’s happening across all these environments and among the technologies, so you can detect and resolve issues to keep your systems efficient and reliable and your customers happy.
Implementing observability
Organizations usually implement observability using a combination of instrumentation methods, including open source instrumentation tools, such as OpenTelemetry.
Many organizations also adopt an observability solution to help them detect and analyze the significance of events to their operations, software development life cycles, application security, and end-user experiences.
As teams begin collecting and working with observability data, they are also realizing its benefits to the business, not just IT.
Although some people may think of observability as a buzzword for sophisticated application performance monitoring (APM), there are a few key distinctions to keep in mind when comparing observability and monitoring.
Monitoring vs. observability: What’s the difference between monitoring and observability?
Is observability really monitoring by another name? In short, no. While observability and monitoring are related—and can complement one another—they are actually different concepts.
Monitoring
In a monitoring scenario, you typically preconfigure dashboards to alert you about performance issues you expect to see later. However, these dashboards rely on the key assumption that you’re able to predict what kinds of problems you’ll encounter before they occur.
Cloud-native environments don’t lend themselves well to this type of monitoring because they are dynamic and complex, which means you cannot predict what problems might arise in advance.
Observability
In an observability scenario, where teams have fully instrumented an environment to provide complete observability data, you can flexibly explore what’s going on and quickly figure out the root cause of issues you may not have been able to anticipate.
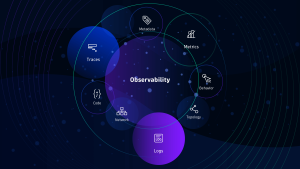
Traditionally, the industry defines observability as logs, metrics, and traces. In more complex cloud environments, however, observability must encompass more, including metadata, user behavior, topology and network mapping, and access to code-level details.
Why is observability important?
In enterprise environments, observability helps cross-functional teams understand and answer specific questions about what’s happening in highly distributed systems. Observability enables you to understand what is slow or broken and what you need to do to improve performance. With an observability solution in place, teams can receive alerts about issues and proactively resolve them before they impact users.
Understanding “unknown unknowns”
Because modern cloud environments are dynamic and constantly changing in scale and complexity, teams neither know about nor can monitor most problems. Observability addresses this common issue of “unknown unknowns,” enabling you to continuously and automatically understand new types of problems as they arise.
Automating AIOps and DevSecOps
Observability is also a critical capability of artificial intelligence for IT operations (AIOps). As more organizations adopt cloud-native architectures, they are also looking for ways to implement AIOps, harnessing AI as a way to automate more processes throughout the DevSecOps lifecycle. By bringing AI to everything—from gathering telemetry to analyzing what’s happening across the full technology stack—your organization can have the reliable answers essential for automating application monitoring, testing, measuring service level objectives (SLOs), continuous delivery, application security, and incident response.
Optimizing user experiences
The value of observability doesn’t stop at IT use cases. Once you begin collecting and analyzing observability data, you have an invaluable window into the business impact of your digital services. This visibility enables you to optimize conversions, validate that software releases meet business goals, and prioritize business decisions based on what matters most.
When an observability solution also analyzes user experience data using synthetic and real-user monitoring, you can discover problems before your users do and design better user experiences based on real, immediate feedback.
Benefits of observability
Observability delivers powerful benefits to IT teams, organizations, and end users alike. Following are some of the use cases observability facilitates.
1 Application performance monitoring
Full end-to-end observability enables organizations to get to the bottom of application performance issues much faster, including issues that arise from cloud-native and microservices environments. Teams can also use an advanced observability solution to automate more processes, which increases efficiency and innovation among Ops and Apps teams.
2 DevSecOps and SRE
Observability is not just the result of implementing advanced tools but a foundational property of an application and its supporting infrastructure. The architects and developers who create the software must design it to be observed. Then DevSecOps and SRE teams can leverage and interpret the observable data during the software delivery lifecycle to build better, more secure, and more resilient applications.
3 Monitoring infrastructure, cloud, and Kubernetes environments
Infrastructure and operations (I&O) teams can leverage the enhanced context an observability solution offers for monitoring on-premises and cloud infrastructure and Kubernetes environments. This unified observability-based approach can improve application uptime and performance, cut down the time required to pinpoint and resolve issues, detect cloud latency issues, optimize cloud resource utilization, and improve administration of their Kubernetes environments and modern cloud architectures.
4 End-user experience
A good user experience can enhance a company’s reputation and increase revenue, delivering an enviable edge over the competition. By spotting and resolving issues well before the end-user notices and making an improvement before it’s even requested, an organization can boost customer satisfaction and retention. It’s also possible to optimize the user experience through real-time playback, gaining a window directly into the end-user’s experience exactly as they see it, so everyone can quickly agree on where to make improvements.
5 Business analytics
Business analytics enable organizations to combine business context with full stack application analytics and performance to understand real-time business impact, improve conversion optimization, ensure that software releases meet expected business goals, and confirm that the organization is adhering to internal and external SLAs.
6 DevOps and DevSecOps automation
DevSecOps teams can tap observability to get more insights into the apps they develop, and automate testing and CI/CD processes so they can release better quality code faster. This means organizations waste less time on war rooms and finger-pointing. Not only is this a benefit from a productivity standpoint, but it also strengthens the positive working relationships that are essential for effective collaboration.
These organizational improvements open the door to further innovation and digital transformation. And more importantly, the end-user ultimately benefits in the form of a high-quality user experience.
How do you make a system observable?
If you’ve read about observability, you likely know that collecting the measurements of logs, metrics, and distributed traces are the three key pillars to achieving success. However, observing raw telemetry from back-end applications alone does not provide the full picture of how your systems are behaving.
Neglecting the front-end perspective potentially skews or even misrepresents the full picture of how your applications and infrastructure are performing in the real world for real users. Extending the three-pillars approach, IT teams must augment telemetry collection with user-experience data to eliminate blind spots:
- Logs: Logs are structured or unstructured text records of discreet events that occurred at a specific time.
- Metrics: Metrics are the values represented as counts or measures that are often calculated or aggregated over a period of time. Metrics can originate from a variety of sources, including infrastructure, hosts, services, cloud platforms, and external sources.
- Distributed tracing: Tracing follows the activity of a transaction or request as it flows through applications and shows how services connect, including code-level details.
- User experience: User experience data extends traditional observability telemetry by adding the outside-in user perspective of a specific digital experience on an application, even in pre-production environments.
Why the three pillars of observability aren’t enough
Obviously, data collection is only the start. Simply having access to the right logs, metrics, and traces isn’t enough to gain true observability of your environment. Once you’re able to use that telemetry data to achieve the end goals of improving end-user experience and business outcomes, only then can you really say you’ve achieved the purpose of observability.
The importance of open source solutions
There are other observability capabilities organizations can use to observe their environments. Open source solutions, such as OpenTelemetry, provide a de facto standard for collecting telemetry data in cloud settings. These open source solutions enhance observability for cloud-native applications and make it easier for developers and operations teams to achieve a consistent understanding of application health across multiple environments.
The role of real-user monitoring (RUM) and synthetic testing
Organizations can also use real user monitoring to gain real-time visibility into the user experience, tracking the path of a single request and gaining insight into every interaction it has with every service along the way. Teams can observe this experience using synthetic monitoring or even view a recording of the actual session. These capabilities extend telemetry by adding in data for APIs, third-party services, errors occurring in the browser, user demographics, and application performance from the user’s perspective.
With real-user monitoring IT, DevSecOps, and SRE teams can not only see the complete end-to-end journey of a request but also access real-time insight into system health. From there, they can proactively troubleshoot areas of degrading health before they impact application performance. They can also more easily recover from failures and gain a more granular understanding of the user experience.
Don’t forget over-burdened teams
While IT organizations have the best of intentions and strategy, they often overestimate the ability of already overburdened teams to constantly observe, understand, and act upon an impossibly overwhelming amount of data and insights. Although there are many complex challenges associated with observability, the organizations that overcome these challenges will find it worth their while.
What are the challenges of observability?
Observability has always been a challenge, but cloud complexity and the rapid pace of change have made it an urgent issue. Cloud environments generate a far greater volume of telemetry data, particularly in microservices and containerized application environments. They also create a far greater variety of telemetry data than teams have ever had to interpret in the past. Lastly, the velocity with which all this data arrives makes it that much harder to keep up with the flow of information, let alone accurately interpret it in time to troubleshoot a performance issue.
Organizations also frequently run into the following challenges with observability.
1 Data silos
Multiple agents, disparate data sources, and siloed monitoring tools make it hard to understand interdependencies across applications, multiple clouds, and digital channels, such as web, mobile, and IoT.
2 Volume, velocity, variety, and complexity
It’s nearly impossible to get answers from the sheer amount of raw data collected from every component in ever-changing modern cloud environments, such as AWS, Azure, and Google Cloud Platform (GCP). This is also true for Kubernetes and containers that can spin up and down in seconds.
3 Manual instrumentation and configuration
When IT resources are forced to manually instrument and change code for every new type of component or agent, they spend most of their time trying to set up observability rather than innovating based on insights from observability data.
4 Lack of pre-production
Even with load testing in pre-production, developers still don’t have a way to observe or understand how real users will impact applications and infrastructure before they push code into production.
5 Wasting time troubleshooting
Application, operations, infrastructure, development, and digital experience teams are pulled in to troubleshoot and try to identify the root cause of problems, wasting valuable time guessing and trying to make sense of telemetry and come up with answers.
6 Multiple tools and vendors
While a single tool may give an organization observability of one specific area of their application architecture, that one tool may not provide complete observability across all the applications and systems that can affect application performance.
7 Inability to determine root-causes
Also, not all types of telemetry data is equally useful for determining the root cause of a problem or understanding its impact on the user experience. As a result, teams waste time digging for answers across multiple solutions and painstakingly interpreting the telemetry data when they could be applying their expertise toward fixing the problem right away.
However, with a single source of truth, teams can get answers and troubleshoot issues much faster.
The importance of a single source of truth
Organizations need a single source of truth to gain complete observability across their application infrastructure and accurately pinpoint the root causes of performance issues. When organizations have a single platform that can tame cloud complexity, capture all the relevant data, and analyze it with AI, teams can instantly identify the root cause of any problem, whether it lies in the application itself or the supporting architecture.
A single source of truth enables teams to do the following:
- Turn terabytes of telemetry data into real answers rather than asking IT teams to cobble together an understanding of what has happened using snippets of data from disparate sources
- Gain crucial contextual insights into areas of the infrastructure they might not have otherwise been able to see
- Work collaboratively and accelerate the troubleshooting process further, which empowers the organization to act faster than it could by using traditional monitoring tools thanks to enhanced awareness
Making observability actionable and scalable for IT teams
To achieve observability, resource-constrained teams need to be able to collect and act upon a deluge of telemetry data in real time. Responding in real time enables teams to prevent business-impacting issues from propagating further or even occurring in the first place. Following are some ways teams can make observability actionable and scalable.
1 Understand the context and the topology
Understanding the context and topology of an IT environment involves instrumenting applications and infrastructure in a way that identifies relationships between every entity and interdependency among potentially billions of interconnected components. Rich context metadata enables real-time topology maps, providing an understanding of causal dependencies both vertically throughout the stack and horizontally across services, processes, and hosts.
2 Implement continuous automation
Automatic discovery, instrumentation, and baselining of every system component on a continuous basis shifts IT effort away from manual configuration work to value-add innovation projects that can prioritize understanding of the things that matter. Observability becomes “always-on” and scalable, so constrained teams can do more with less.
3 Establish true AIOps
Exhaustive AI-driven fault-tree analysis combined with code-level visibility enables teams to automatically pinpoint the root cause of anomalies without having to rely on time-consuming human trial and error. Additionally, causation-based AI can automatically detect any unusual change points to discover “unknown unknowns” that teams are not aware of or monitoring. These actionable insights drive the faster and more accurate responses that DevOps and SRE teams require.
4 Foster an open ecosystem
An open ecosystem extends observability to include external data sources, such as OpenTelemetry, which is an open-source project led by vendors such as Dynatrace, Google, and Microsoft. OpenTelemetry expands telemetry collection and ingestion for platforms that provide topology mapping, automated discovery and instrumentation, and actionable answers required for observability at scale.
5 Utilize AI
An AI-driven solution-based approach makes observability truly actionable by solving the challenges associated with cloud complexity. An observability solution makes it easier to interpret the vast stream of telemetry data arising from multiple sources at increasingly greater velocities. With a single source of truth, teams can quickly and accurately pinpoint root causes of issues before they result in degraded application performance or, in the event a failure has already occurred, accelerate their time to recovery.
Advanced observability also improves application availability through end-to-end distributed tracing across serverless platforms, Kubernetes environments, microservices, and open-source solutions. By gaining visibility into the complete journey of a request from start to finish, teams can proactively identify application performance issues and gain crucial insight into the end-user experience. This way, IT teams can quickly act on issues of concern, even as the organization scales its application infrastructure to support future growth.
Bring observability to everything
You can’t waste months or years trying to build your own tools or test out multiple vendors that only enable you to solve one piece of the observability puzzle. Instead, you need a solution that can help make all your systems and applications observable, give you actionable answers, and provide technical and business value as fast as possible.
Advanced observability from Dynatrace provides all these capabilities in a single platform, empowering your organization to tame modern cloud complexity and transform faster. Now, more than ever, it’s critical to make comprehensive observability part of every cloud migration. At Dynatrace, we call that approach cloud done right.
Read our free eBook, Upgrade to advanced observability for answers in cloud-native environments, to learn how advanced observability gives you actionable answers in cloud-native environments.


Looking for answers?
Start a new discussion or ask for help in our Q&A forum.
Go to forum