
Kubernetes simplifies the operation and development of distributed applications by streamlining the deployment of containerized workloads and distributing them over a set of nodes. To provide its convenient features, Kubernetes relies on significant amounts of background automation and abstraction, which can lead to errors that are difficult to find, troubleshoot, and prevent.
Observability and monitoring as a source of truth
Kubernetes can keep track of applications using health checks and restart failed applications, however, the Kubernetes platform has no insight into the internal state of your applications. When operating an application, it’s helpful to have deeper insights that show you what’s really going on. To make this possible, the application code should be instrumented with telemetry data for deep insights, including:
- Metrics to find out how the behavior of a system has changed over time
- Logs represent event data in plain-text, structured or binary format
- Traces help find the flow of a request through a distributed system
This type of data can be extended by adding additional meta-information, like real user experience data and topology details.
To provide actionable answers monitoring systems store, baseline, and analyze telemetry data. Based on this analysis, these systems can take actions such as alerting or remediation. While many systems follow a declarative approach (where hosts and services are specified explicitly), Dynatrace discovers your whole application landscape automatically simply by installing Dynatrace OneAgent into your Kubernetes cluster and then adding the Kubernetes cluster for monitoring in Dynatrace.
There are several tools you can use to show the overall state of a cluster and alert you when anomalies occur, and installing a monitoring agent on Kubernetes nodes can provide even more valuable information about the status of the nodes. But there are other related components and processes (for example, cloud provider infrastructure) that can cause problems in applications running on Kubernetes. Dynatrace is the only monitoring solution that provides observability (with no code changes) into every layer of your Kubernetes deployment, including your cloud infrastructure provider.
Monitoring your infrastructure
Dynatrace AWS monitoring gives you an overview of the resources that are used in your AWS infrastructure along with their historical usage. Based on this information, alerting rules can be defined to notify you of any sudden increases in usage. And because Dynatrace can consume CloudWatch metrics, almost all your AWS usage information is available to you within Dynatrace.
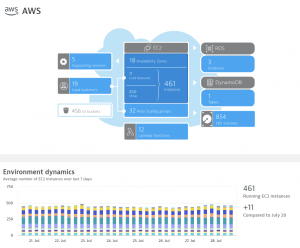
Similarly, integrations for Azure and VMware are available to help you monitor your infrastructure both in the cloud and on-premises.
Further reading about infrastructure monitoring:
- Explore and analyze Amazon CloudWatch synthetics data in Dynatrace
- Dynatrace VMware and virtualization documentation
OneAgent and its Operator
Dynatrace supports full-stack monitoring from the application to the operating system layer using OneAgent. When OneAgent is installed on the host operating system, it automatically collects all relevant monitoring data, including load metrics, memory consumption, and logs—with no configuration required. Additionally, it discovers all processes running on the host and automatically activates instrumentation throughout the application stack.
Using OneAgent Operator, OneAgent can be automatically installed on every Kubernetes Node (DaemonSet), thereby ensuring all nodes are monitored when they join your cluster. While OneAgent Operator can be installed on most managed Kubernetes infrastructures, there may be cases where you don’t have access to the operating system layer. In this case, OneAgent Operator can be used to inject instrumentation into the pod (otherwise known as “application-only monitoring”).
Further reading about OneAgent Operator:
- Address Kubernetes observability configuration chaos with unparalleled automation
- Dynatrace Kubernetes documentation
- Dynatrace OneAgent documentation
Kubernetes integration
By providing Dynatrace access to the Kubernetes API, many additional insights are possible, for example, event tracking and over-commitment rate (resource requests vs. resources available).
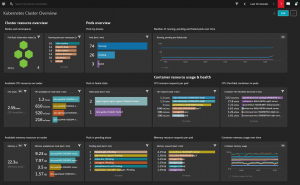
There are many reasons why a Kubernetes Pods might not be scheduled and therefore be in a “pending” state. The Dynatrace Kubernetes integration helps you find the root cause of such errors and resolve them quickly.
Further reading about Kubernetes cluster monitoring:
- Get deep Kubernetes observability with cloud application view
- Monitoring of Kubernetes infrastructure for “Day 2” operations
Observing your application
As mentioned, OneAgent automatically instruments your applications. Using this information, Dynatrace can detect dependencies between services and visualize those dependencies in the Smartscape topology view. Plus, using PurePath, the flow of a single request, starting with the request that was sent via the executed method and extending all the way down to the line of code that was called, can be analyzed (see example below).
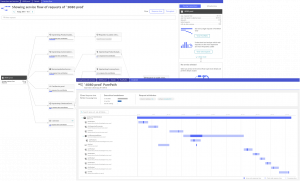
All the monitoring data that’s captured by Dynatrace is analyzed by the Dynatrace AI engine, Davis®, which has a full picture of your application and able to find the root cause of application problems, all the way down to the code-level.
Dynatrace provides two technologies for Digital Experience Monitoring (DEM): Synthetic Monitoring and Real User Monitoring (RUM). Synthetic Monitoring is used to simulate defined customer behavior, for example when opening a website and clicking a certain button. RUM tracks the behavior of real users and gives you valuable insights into errors and usability issues they experience (for example, customers who leave your site one click before checking out).
Further reading about Application Monitoring:
- Monitor your whole infrastructure using synthetic monitors
- Dynatrace SaaS-vendor real user monitoring
- Dynatrace root cause analysis documentation
Dashboards for business insights
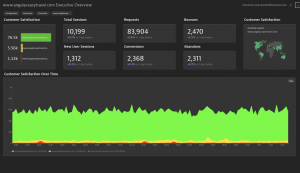
Even when the best technologies and features are used, your application won’t be successful if it doesn’t enable your customers to complete transactions or achieve their objectives. Fully customizable Dynatrace dashboards can serve as a bridge between technical considerations, like application deployment health, and business goals related to revenue and conversion rates.
With this information, the negative impact of a new feature on customer satisfaction can be visualized in charts and countermeasures, for example, rolling back to the last successful version and refactoring the feature, can be implemented.
Further reading about Business Analytics:
- Business Observability
- Digital Business Analytics: Let’s get started
- Digital Business Analytics: Accelerate your dashboard journey
Conclusion
Kubernetes components like nodes and Pods come and go quickly. As this dynamic containerized world can cause errors and additional challenges for applications and their developers, Dynatrace is a monitoring system that’s designed to handle such dynamic infrastructure out-of-the-box. Regardless of if your infrastructure is deployed on-premises or managed on a public cloud, your infrastructure still relies on conventional components, like servers, networks, and storages that should be included in your monitoring strategy. When using autoscaling-mechanisms and having a lot of application containers, tracing requests through the network is a challenging task. By instrumenting the application automatically, Dynatrace supports you by finding errors and their causes instantly.
At last, DEM and the correlation of technical considerations with economic performance indicators are available to help you identify problems and features that have a negative impact on the experience of your customers.
Enhance your Kubernetes monitoring experience today!
Check out the Dynatrace Free Trial.

Looking for answers?
Start a new discussion or ask for help in our Q&A forum.
Go to forum