
Our friends Nestor and Abeer gave a great presentation at Dynatrace Perform 2018, titled “The transformation from waterfall to agile operations at Citrix.” They clearly hit the point that the biggest challenge in transforming an organization is not the technology. It’s the people, culture and learning how to leverage technology to ultimately achieve the goal of delivering better services to your end users. I encourage you to view the recording, once available on the Dynatrace Community and learn more about their phased approach on introducing Scrum and Kanban, what their day-2-day agile operations looks like now, how they automated Dynatrace into their continuous improvement process and why their IT Ops team would never want to go back to the old and manual way of doing things!
Citrix is a large organization and they are using – like any large and growing organizations – pretty much every technology under the sun. My personal interest when talking with Nestor and Abeer, was their adoption of cloud and container technology and how that enables them to transform the organization. Citrix moved several services, such as docs.citrix.com and sharefile.com, over to AWS. Why AWS? First – it gives them more flexibility with dynamic scaling, depending on global demand, at certain times during the day. Second – it enables them to deliver a consistent end-user experience for their global user base because of AWS global available infrastructure! Citrix also leverages Docker. Why Docker? It allowed them to build a self-service automation platform for their configuration management activities using Ansible. This service eliminates the manual effort of standing up environments in production and non-production environments. All of this adds to achieving one goal towards more automation and less manual repetitive work.
Nestor was kind enough to send me a couple of screenshots from their Dynatrace SaaS environment. The screenshots should speak for themselves, but let me highlight how Dynatrace, the OneAgent and the Dynatrace AI support them in these environments based on a couple of use cases:
Use Case #1: Usage & Cost Control of AWS Cloud Services
Dynatrace OneAgent can be installed on EC2 instances, which gives you full visibility into what software and services are running, how long they run and how many resources are consumed. The OneAgent can also be installed on an ECS host, which gives you immediate visibility into every container that is launched by ECS. For other services such as Fargate, you can inject the OneAgent as explained by Dirk Wallerstorfer, in his blog post First Steps with AWS Fargate. The same holds true if you try to monitor AWS Beanstalk (check out Alois Mayr’s blog post on Monitoring AWS Beanstalk with Dynatrace) or AWS Lambda (follow Daniel Khan’s blog on AWS Lambda Monitoring Done Right). As a OneAgent cannot be installed on every AWS Service, Dynatrace provides native support to pull additional metrics from AWS CloudWatch. I show how to set this up in my AWS Monitoring Tutorial for Dynatrace (GitHub) and on YouTube!
The following screenshot shows Nestor’s Dynatrace AWS Overview Dashboard. Besides getting current usage numbers in the infographic, you also get to see a historical overview of all resources consumed over time, e.g: how many EC2 instances did they use over the course of the last 7 days? Are there any peaks during certain time periods? Does it seem to grow constantly? In which region are these EC2 instances running?
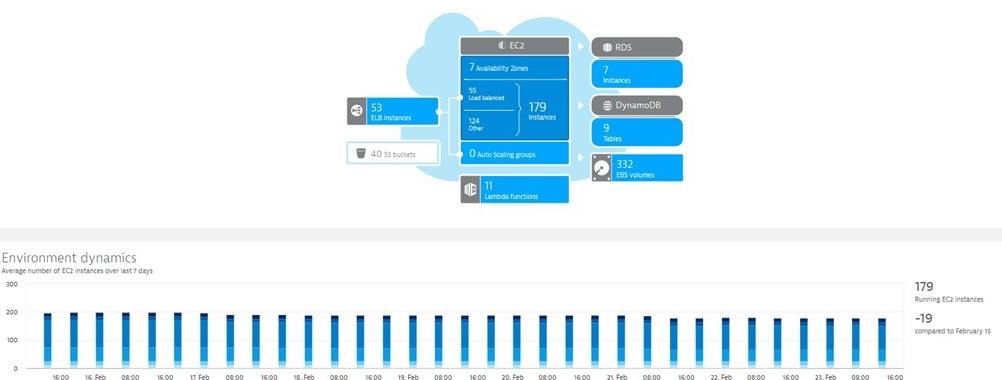
The benefit of Dynatrace is that this information is automatically collected for key AWS services such as EC2, RDS, DynamoDB, … and it is done across all your AWS regions – giving you a great overview of all your AWS service consumption. On top of that – you also get the information collected by the OneAgent – telling you exactly which processes or containers are running on these virtual machines and are consuming how many resources. And as this data is also exposed to you via the Dynatrace REST API it can serve you for automatically finding e.g.: EC2 instances that
- are over provisioned: low usage of disk, memory or CPU
- have been forgotten: no deployments, change or traffic for a certain timeframe
- are getting exploit: suspicious incoming and outgoing traffic to external machines
Use Case #2: Managing Container Usage and Resource Consumption
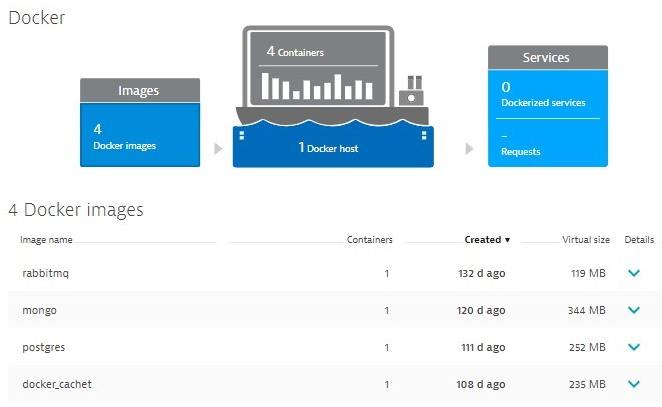
Nestor told me that Citrix is exploring different options to better leverage containers. As mentioned in the initial paragraph they built an automation platform to provide a self-service facility for teams to easily stand up environments using a central repository of Ansible scripts. This project uses Docker to host RabbitMQ, MongoDB, PostgreSQL & Cachet. As they have also installed a Dynatrace OneAgent on that Docker host, they get full visibility into those images and are able to see how many containers they have actively running. All accessible through the Dynatrace Docker dashboard:
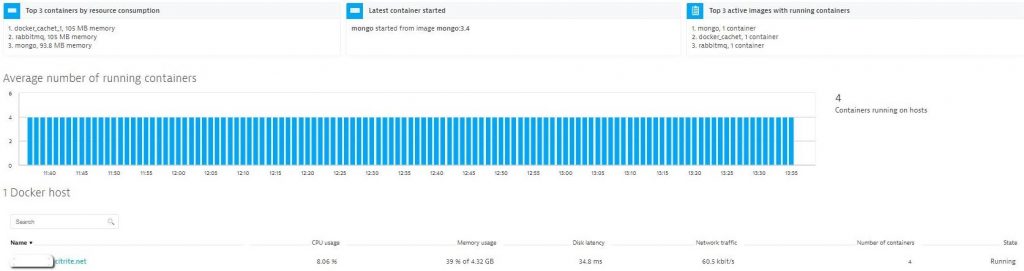
A click on the Docker host reveals historical data about running images and resource consumption on the docker host! This is a good way to identify whether the running Docker containers are exhausting the physical limits of the underlying hardware:
Details on every process and every container running on each docker host can also be seen in the Dynatrace host dashboard or accessed through the Dynatrace Timeseries and Smartscape API for automation purposes:
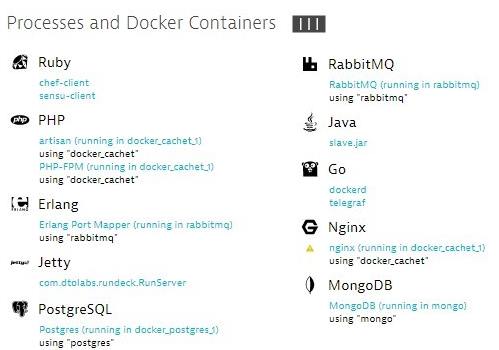
The benefit of Dynatrace is that all this information is automatically collected for you once a OneAgent gets deployed on the Docker host and Dynatrace AI automatically starts detecting anomalies on the hosts, the containers and the services hosted in the containers!
To learn more about deploying Dynatrace for container monitoring take a closer look at the different OneAgent deployment options. Whether it is installing the OneAgent on the Docker host, or running it as an OpenShift DaemonSet or installing it into the container itself – you will always get the visibility you need! For information on k8s, Mesos, GKE, Fargate, ECS, make sure to check the latest documentation on container monitoring.
Use Case #3: Dynatrace AI to improve Service Quality!
If you haven’t yet seen the Dynatrace AI in action, check out some of my previous blog posts: Applying AI into your Digital Performance Life, Dynatrace AI to identify RabbitMQ, Cassandra and JVM Memory issue or Rogue Python Script Impacting Atlassian DevOps Tools.
Nestor shared two problems with me where Dynatrace AI automatically detected problems on their docs.citrix.com and sharefile.com websites – both hosted on AWS. Without the Dynatrace AI, the question would have been whether any of these problems would have ever surfaced to the operations team and how much longer it would have taken to fix these issues:
#1: High Failure Rate on docs.citrix.com
Dynatrace problem ticket 465 was opened because of a 100% failure rate on /content/docs/en-us.html serviced by the AEM_calls service which is hosted on 19 different Jetty instances across different EC2 instances. Dynatrace also shows us that this problem impacts one end user facing application and 17 other backend services that are depending on this AEM_calls service:
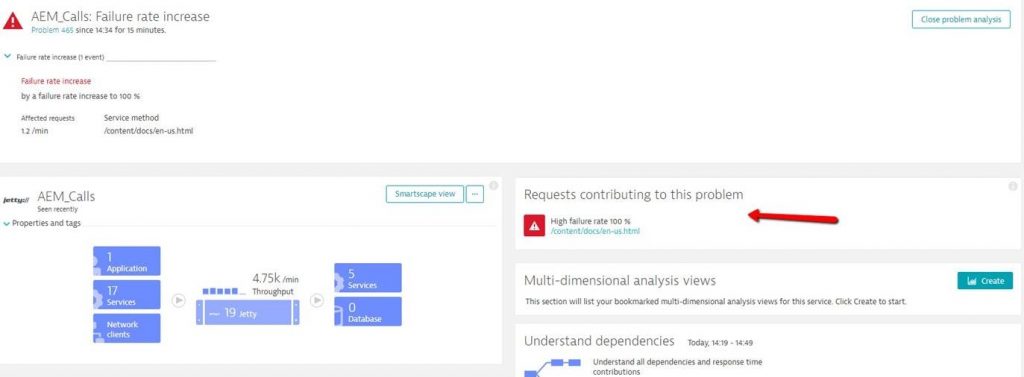
The problem was detected at 14:34 and thanks to the automatic problem notifications Dynatrace can send to either external tools for auto-remediation (Ansible Tower, StackStorm, Lambdas …) or human beings (via email, Slack, ServiceNow ticket, …), the problem could be fixed within minutes.
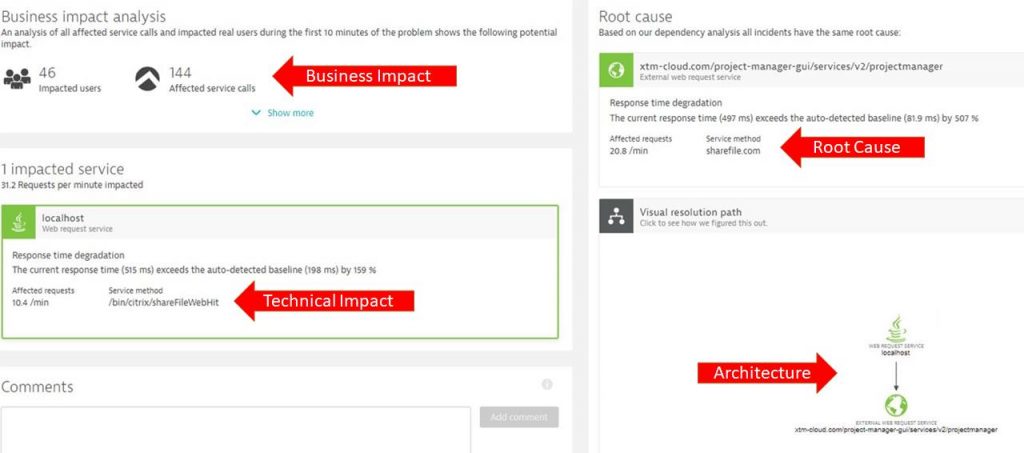
#2: Slow external service sharefile.com
This Dynatrace problem ticket reveals a couple of interesting aspects of the Dynatrace AI and shows that it not only serves to speed up MTTR (Mean Time to Recover) but also helps to ensure business success (Ensuring SLAs, keeping users happy):
- Business Impact: 46 end users are impacted by this problem! Defines your priority!
- Technical Impact: 159% slowdown on end user facing endpoint! Does this violate an SLA?
- Root Cause: 507% slowdown of the external service sharefile.com! Do they violate an SLA?
- Architecture: Which components are involved in handling these service requests?
Dynatrace can not only notify a single team, but multiple teams, so that they are aware of a current problem. Like in the above use case, it would be advisable to alert the business owner as well as the technical owner of this service. The number of impacted users and service calls can be used to automatically prioritize this problem and set different workflows in action, e.g:
- Tweet about a currently known issue with this service and let the world know you are working on it
- Send a message to your technical support team and warn them about potential complaining users
- Escalate this problem to the sharefile.com team and make them aware of the impact they are having
If you want to learn more, check out the available problem notification options as well as our Problem Rest API in case you want to automate remediation or problem response.
Transformation comes from within …
I have really enjoyed working with both Nestor and Abeer to bring their Agile Operations Transformation story to PERFORM 2018. If you wanted to meet and them for yourself, they’re presenting at Perform Europe 2018 in Barcelona. If you can’t make it or prefer listening to a podcast, make sure to check out Episode 49 of our PurePerformance Podcast, where both Abeer and Nestor talk about their transformation.
Transformation – as both put it – must start from within the organization. It needs a clear vision and a couple of change agents to do it. Besides their presentation, I also hope that this blog shows you that technology – while it only plays a small part in transformations – can be leveraged to our advantage. Using the example of Citrix, we can see how powerful AWS, Docker and Dynatrace can be if you leverage them in combination. Integrated in the right way, it allows you to become more agile, and in the end, to deliver better quality of service to your end users!


Looking for answers?
Start a new discussion or ask for help in our Q&A forum.
Go to forum