
Kubernetes monitoring
Manage the health and performance of containerized applications and multi-cloud infrastructure with metrics, traces, and logs in one place.


Kubernetes monitoring and beyond. Way, way beyond.
Easily run and monitor your entire Kubernetes environment in one observability, analytics, and security platform.
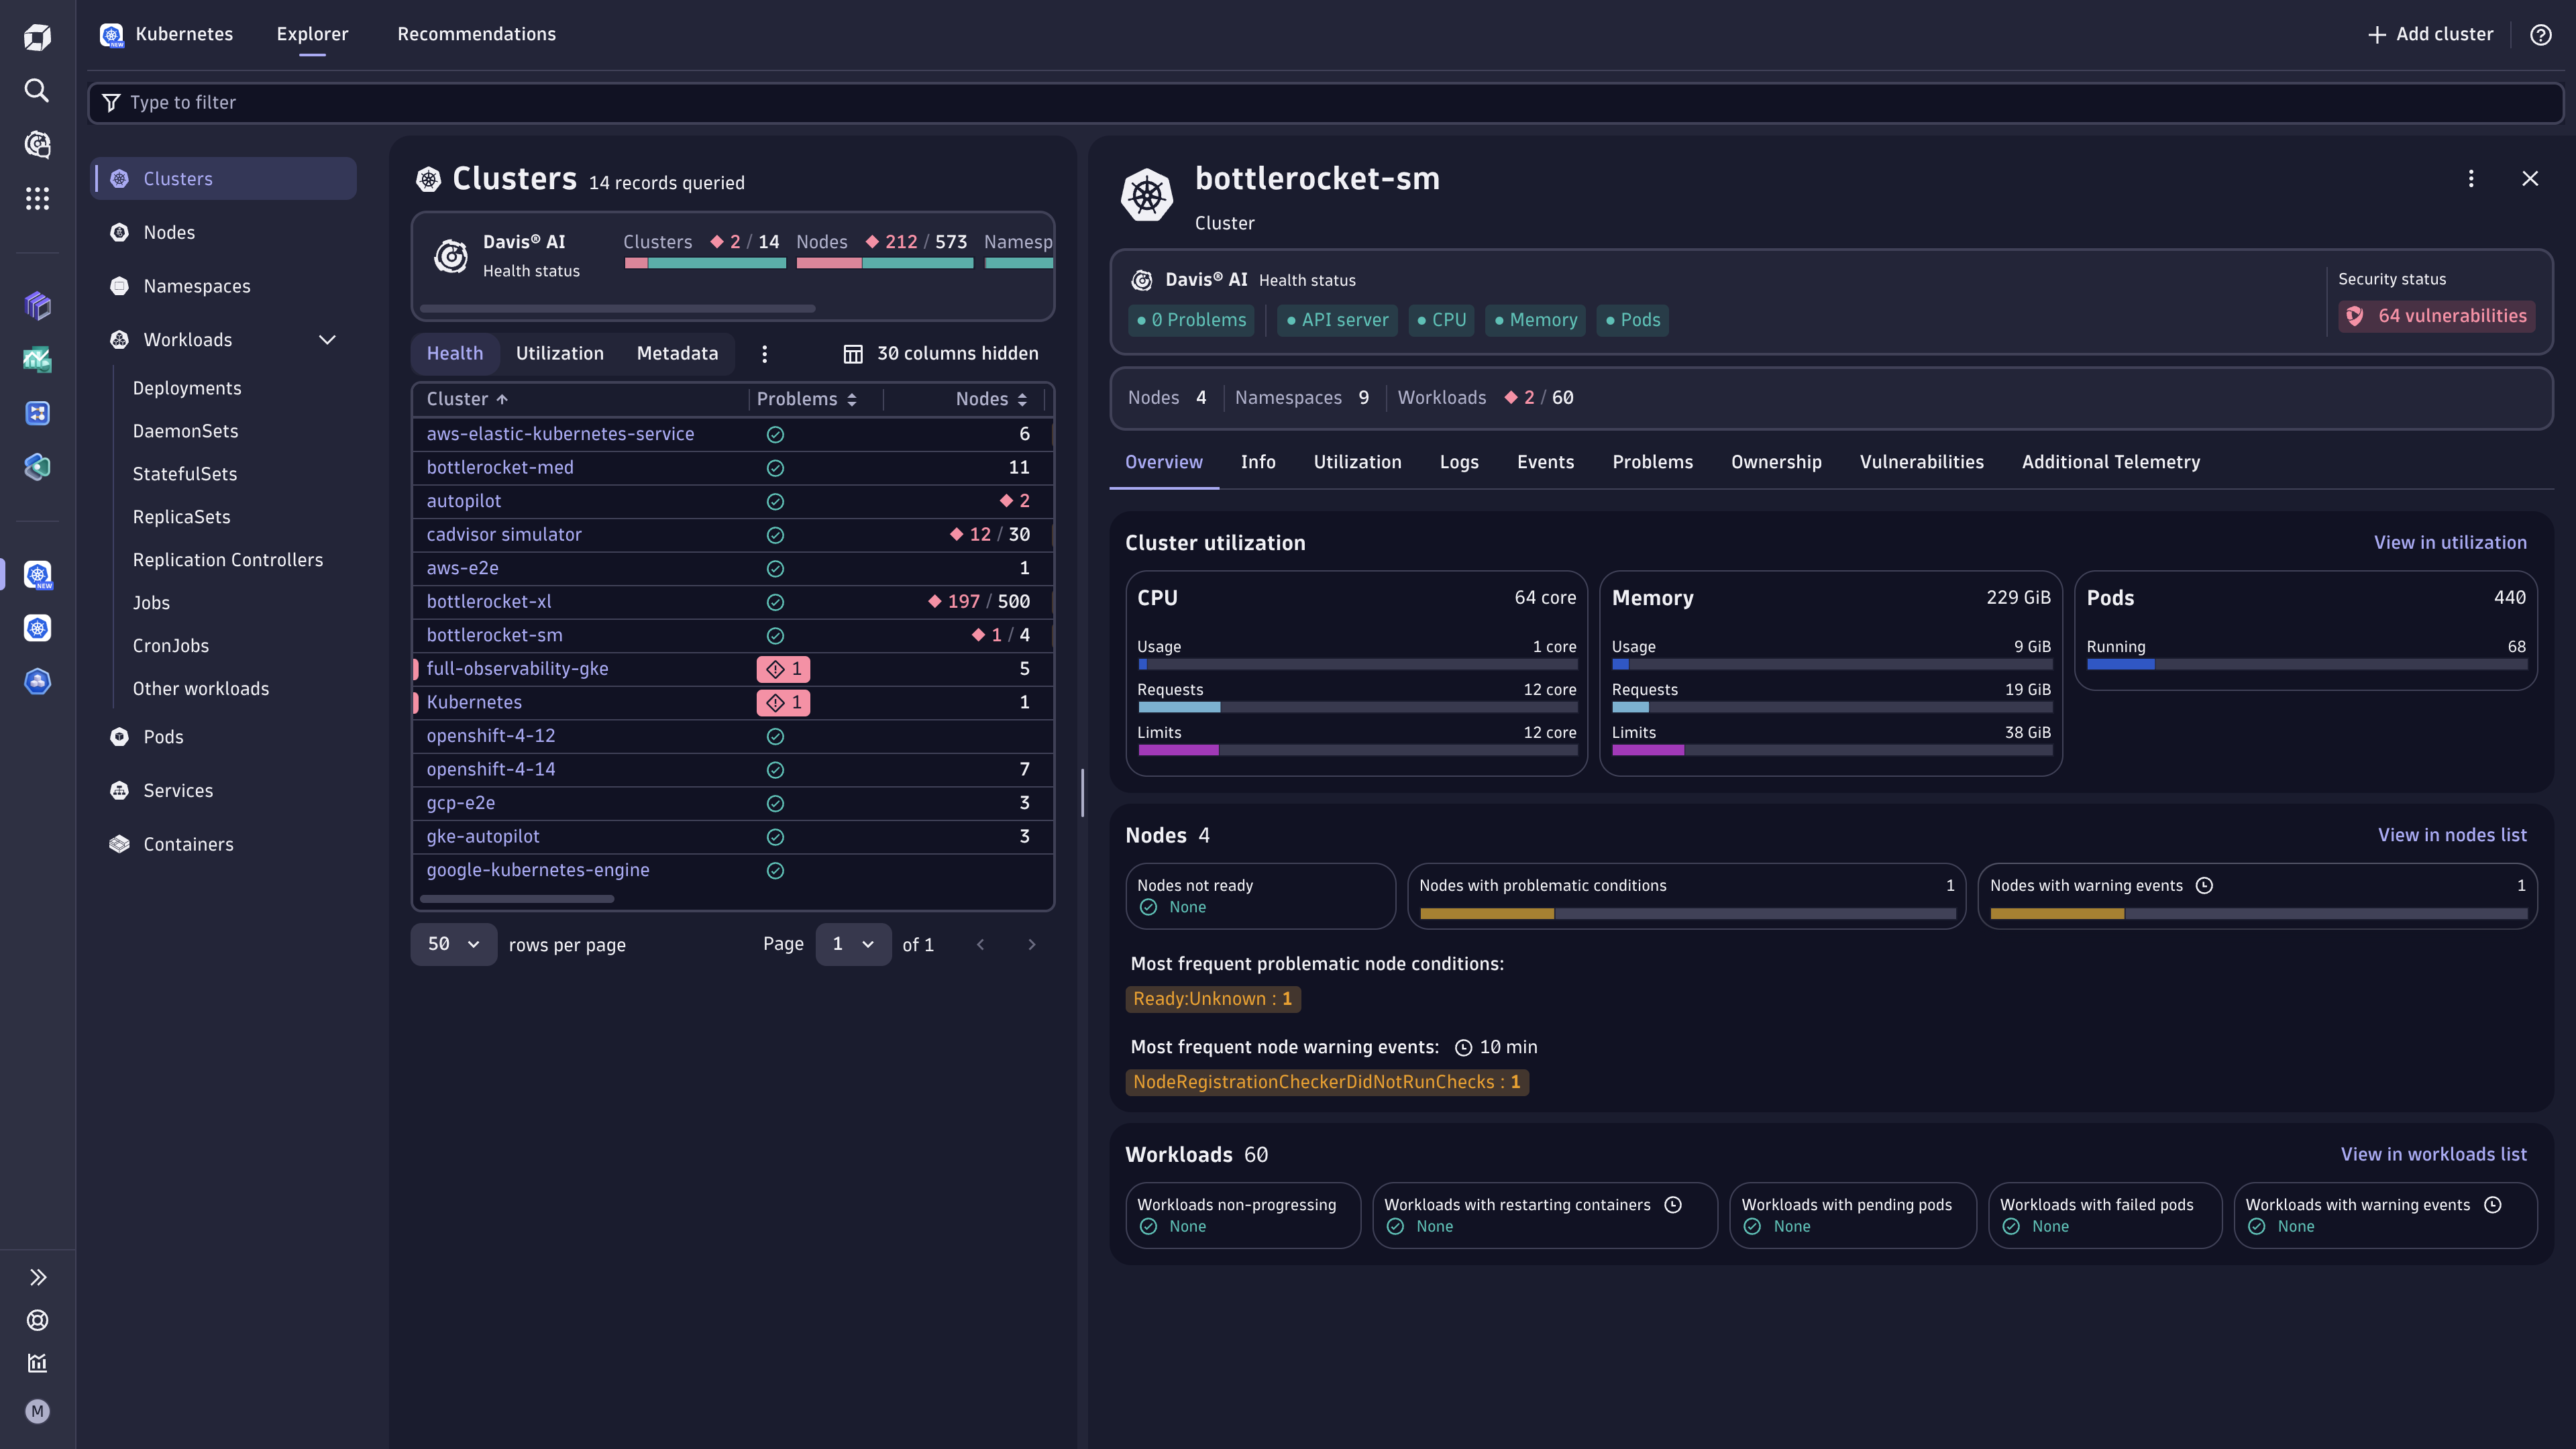
Manage platform health and performance
Gain full, ongoing visibility into cluster health and:
- Continuously discover and monitor Kubernetes nodes and pods
- See metrics, events, and logs from Kubernetes pods and nodes in one view
- Leverage log analytics to gain container workload insights
- Enjoy support of GitOps with Monitoring as code
- Get automatic, out-of-the-box alerting for Kubernetes
Optimize resource utilization across workloads
Improve performance and better leverage resources with exploratory and predictive analyses, so you can:
- Understand overall cluster resource utilization
- Identify workloads consuming the most resources
- Determine workloads not getting enough resources and reallocate.
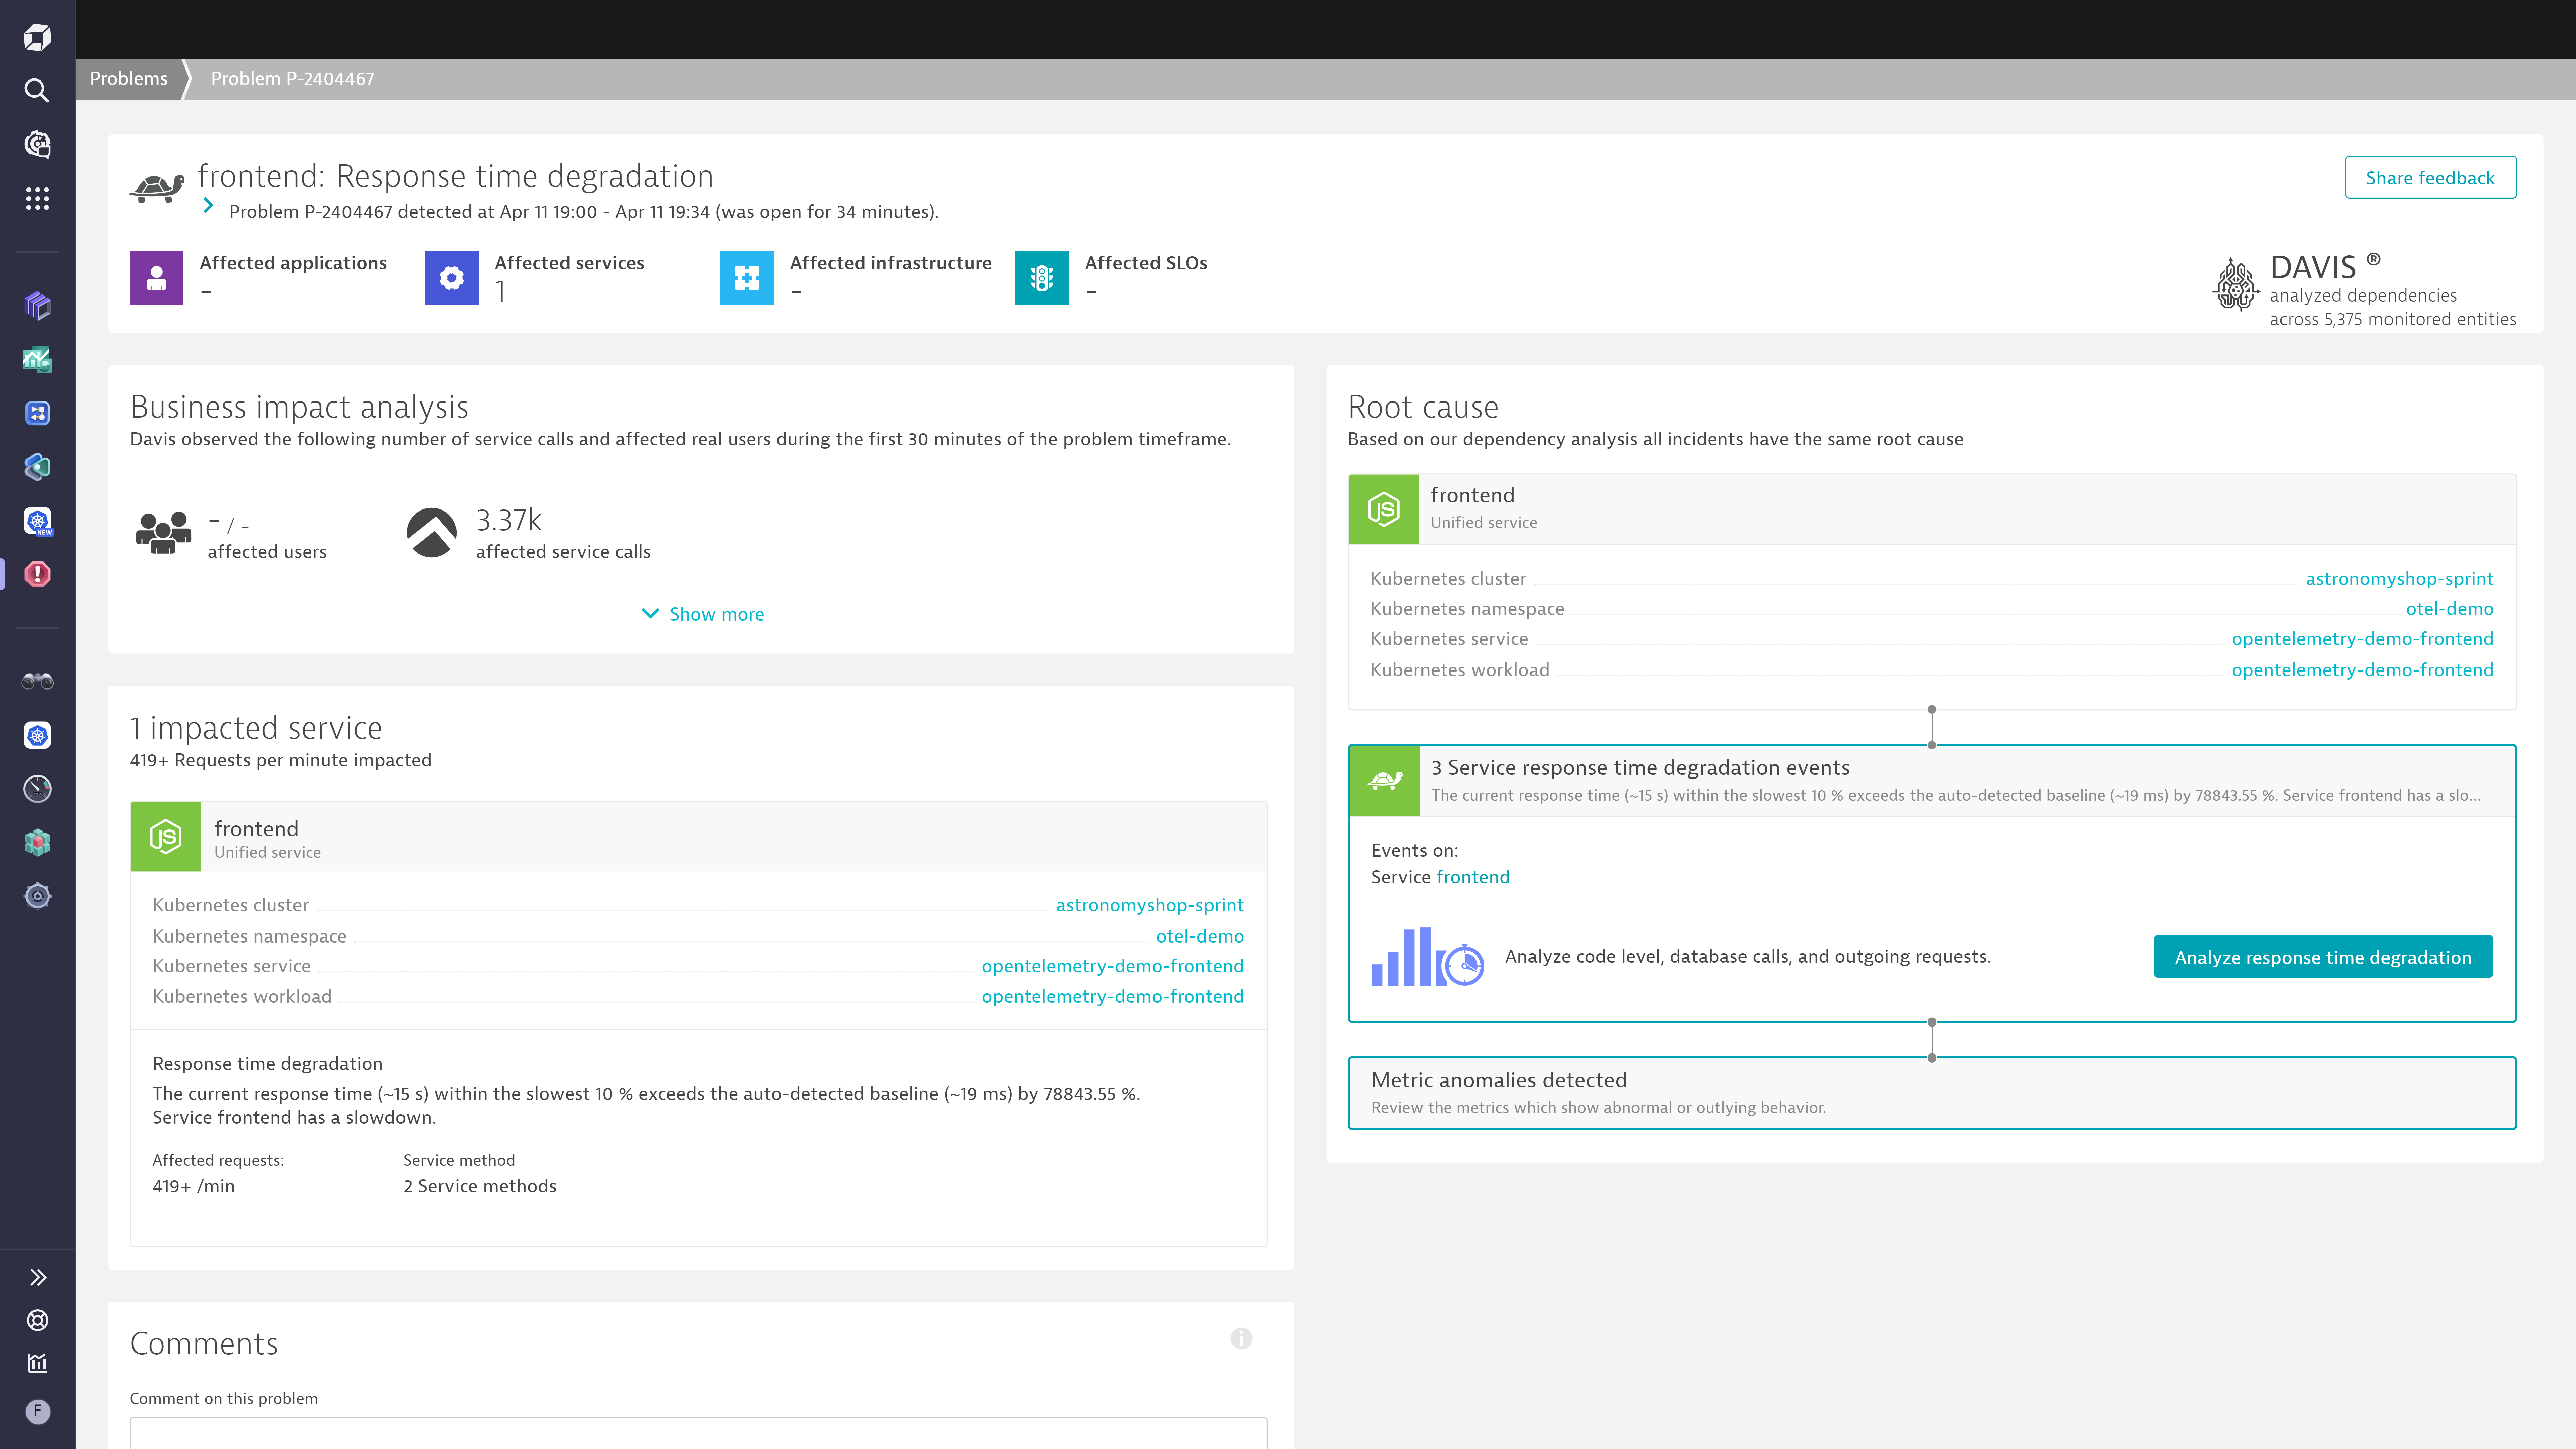
Deliver excellent customer experience and application performance
Solve complex interactions between microservices and your Kubernetes platform, and:
- Automatically identify root cause and impact with Davis Causal AI
- Continuously discover microservices, end user experience, and Kubernetes workload health.
- Visualize requests end-to-end with distributed tracing and code-level profiling
- Test the impact of changes with automatic deployment validation
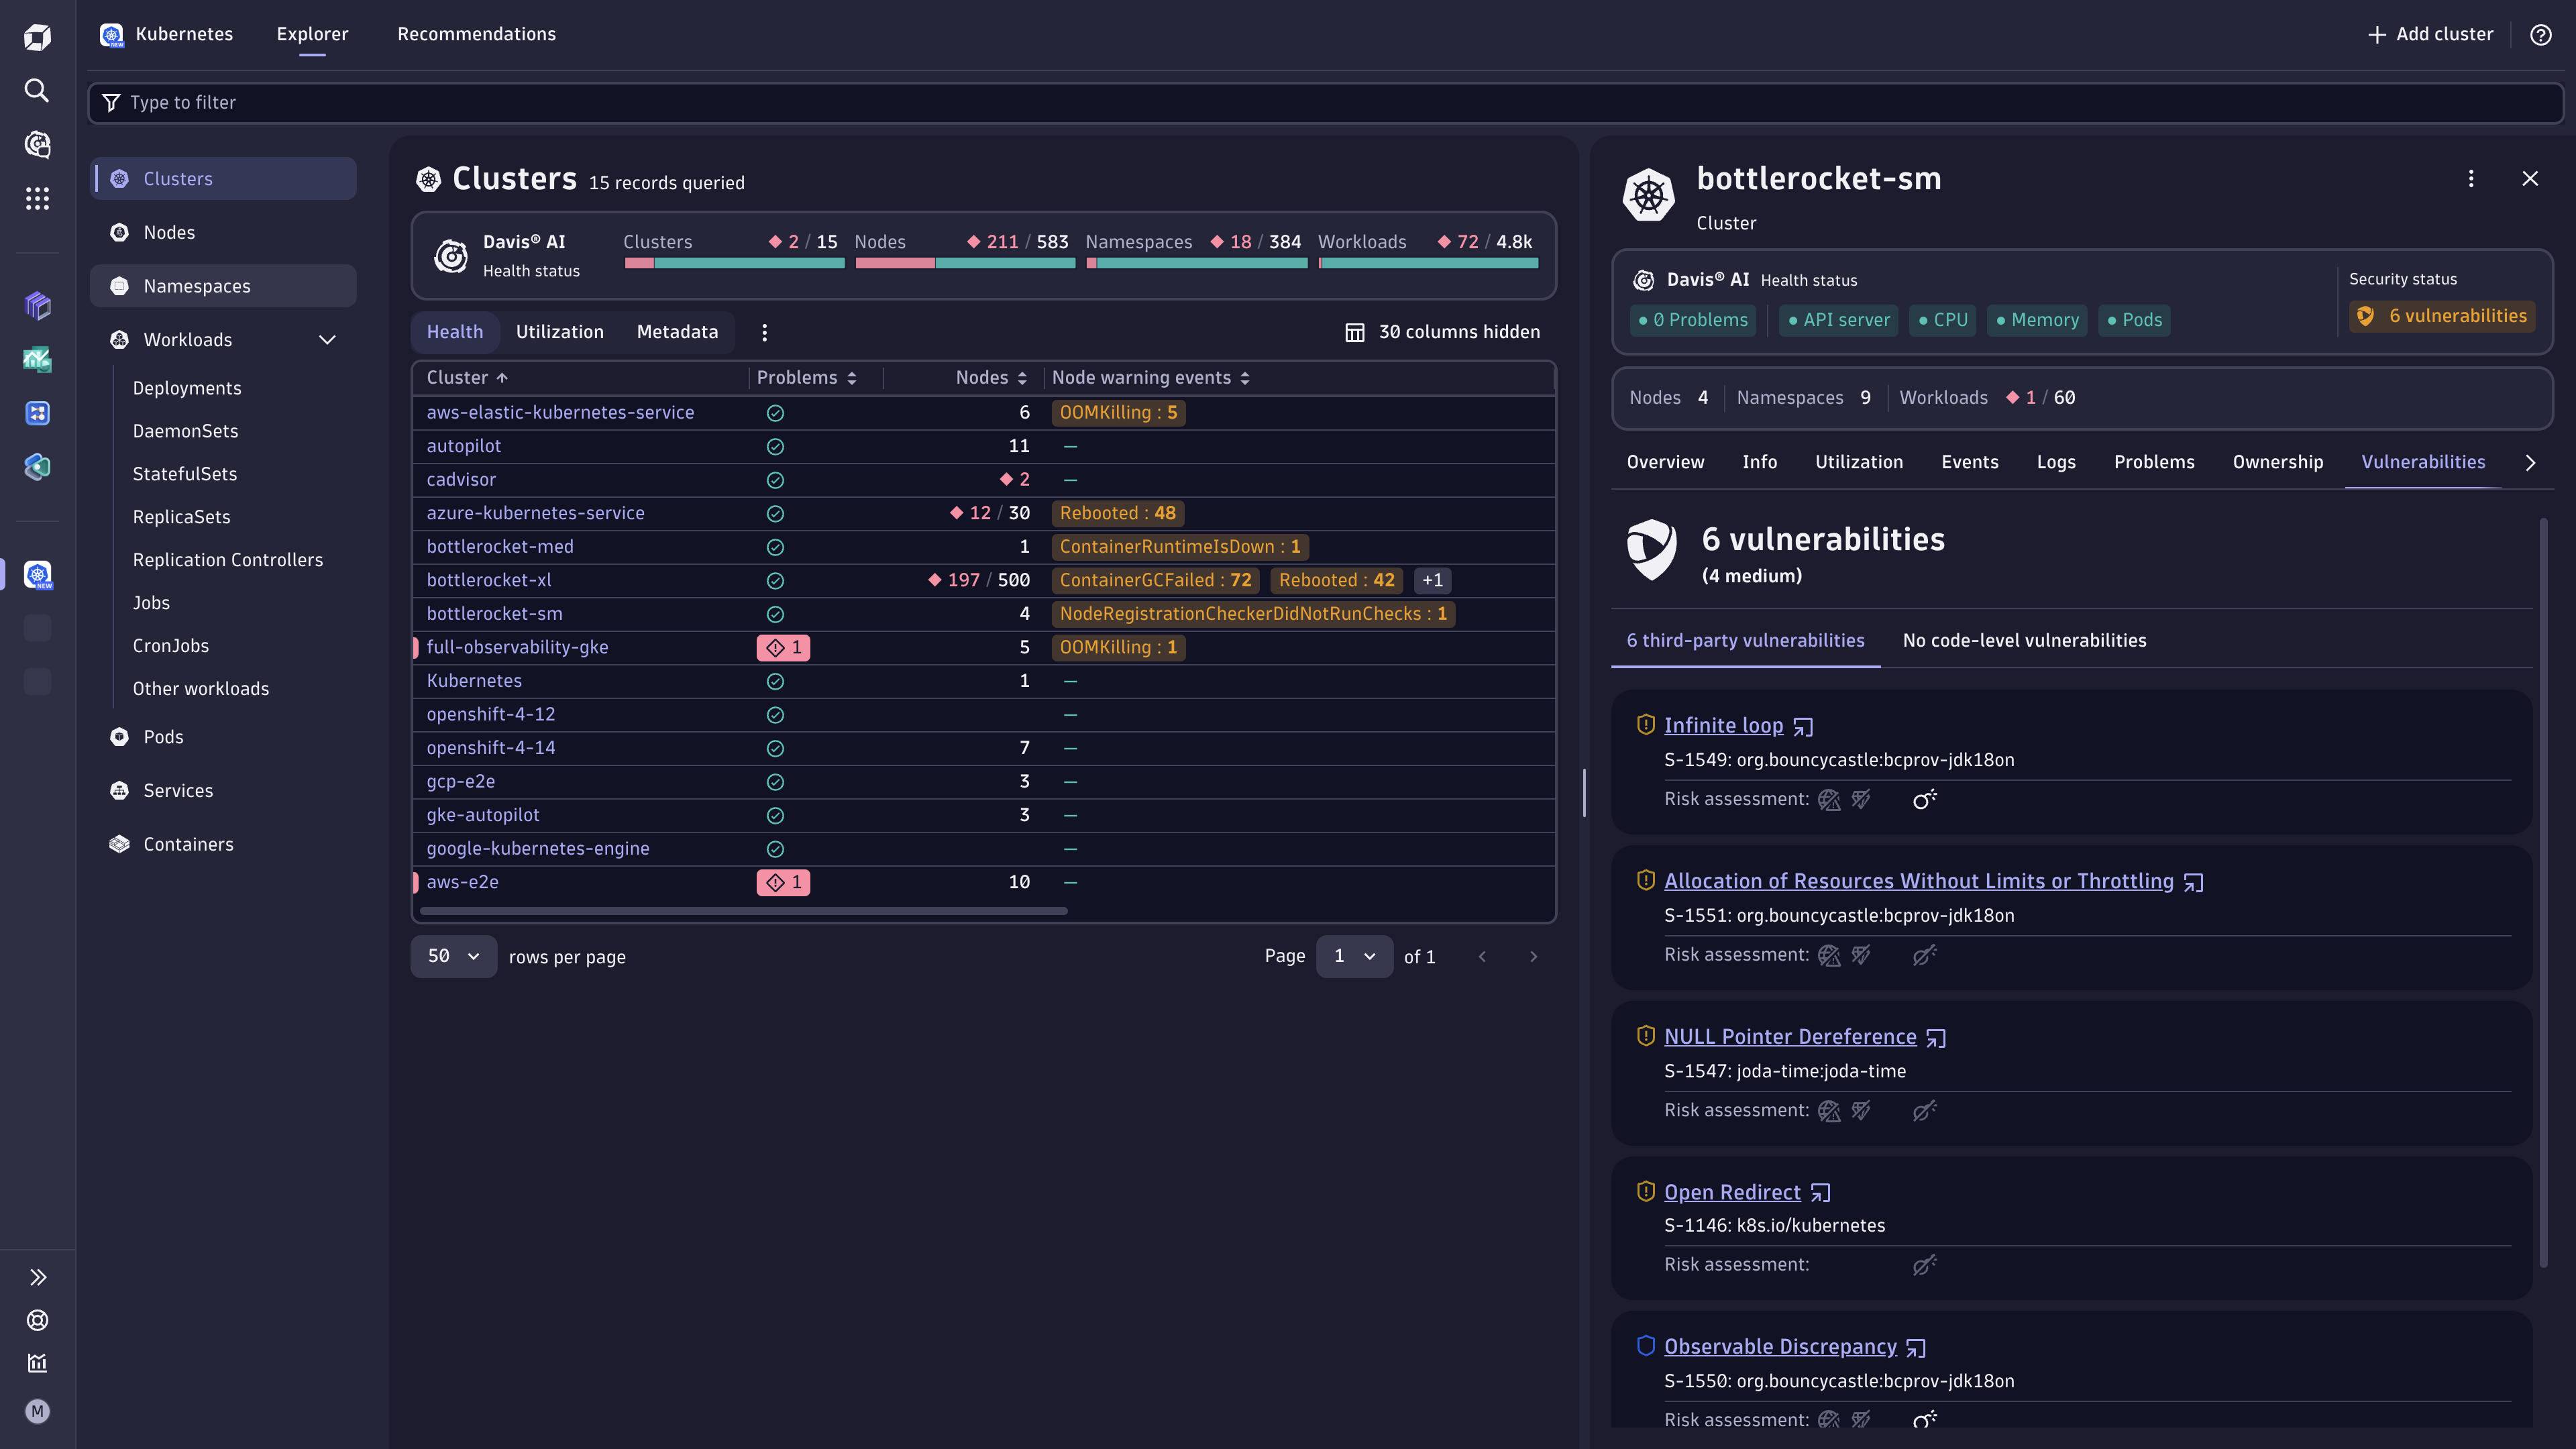
Ensure Kubernetes security
Empower DevSecOps with cloud-native security solutions and intelligent automation, so you can:
- Identify vulnerabilities in production with runtime security analytics
- Enable proactive risk mitigation and accelerate remediation with data in context
- Detect and block attacks in real-time
- Strengthen defense with log audit and forensics


Observability Clinic: Mastering Kubernetes Resiliency with Dynatrace
Kubernetes has become the go-to platform for deploying applications in recent years. And while it offers a multitude of impressive features, it also comes with a set of responsibilities and potential challenges – specifically around running scalable and resilient workloads.
That’s why our Observability Clinic addresses two critical production scenarios that have emerged in the context of Kubernetes.
- Substantial increase in response time after optimizing the resource allocation of the cluster.
- The side-effects of auto-scaling and its impact on other workloads.
Watch this comprehensive guide to understanding and mitigating common challenges faced when utilizing Kubernetes, with a specific focus on observability and efficient autoscaling.
The observability guide to platform engineering


Comprehensive Kubernetes monitoring at scale
-
Digital Experience
MonitoringEnsure perfect user experiences with proactive and real-time insight into availability, performance, and user behavior.
-
Application
ObservabilityAdd the power of Full-Stack app monitoring with code-level insights, AI-assistance and root cause analytics.
-
Automation
Create Kubernetes auto-remediation and team notification workflows.
-
Security Protection
Protect your clusters and apps from security threats.
-
Log Management
& AnalyticsDiagnose cluster and app health with automated analytics.
-
Extensions
Get visibility into the entire Kubernetes ecosystem.
Try it free
Start your free trial of the Dynatrace platform and start observing your Kubernetes clusters and workloads in minutes.

Scale fast, securely, and cost-effectively

Kubernetes monitoring resources
 BLOGOut-of-the-box alerting for Kubernetes
See how a scalable and context-based solution empowers multiple teams with different needs.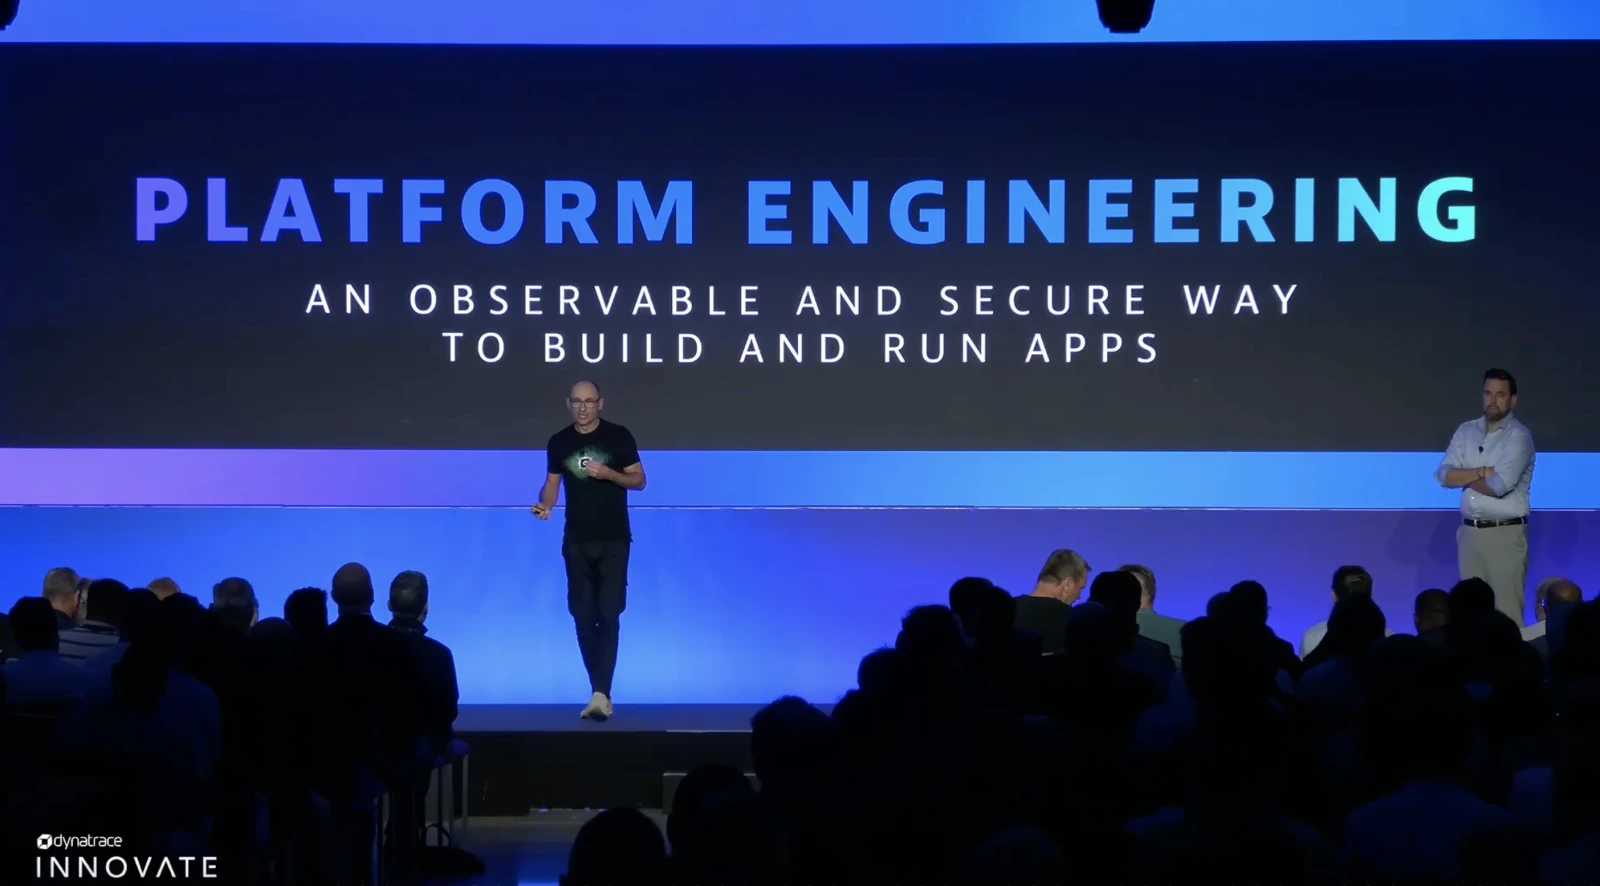 BLOG POSTPlatform Engineering with the new k8s experience
 WEB SERIESIs it Observable?
Join Cloud Native Advocate Henrik Rexed for video deep dives and tutorials into the technologies shaping the observability landscape.

