
The absolute foundation for managing a Kubernetes cluster is establishing basic alerting. With the introduction of out-of-the-box alerting for Kubernetes, Dynatrace offers a scalable and context-based solution for large Kubernetes environments that enables easy management for multiple teams with different needs.
In recent years, we have seen a drastic increase in the adoption of Kubernetes among our customer base. More and more companies are moving to containers and using Kubernetes in its various forms as their container platform of choice. While the list of benefits of using Kubernetes for managing containers is numerous, the list of details one must learn to use Kubernetes is even longer. The comparison to an iceberg is appropriate in this case. At the beginning of your Kubernetes journey, the task of managing your Kubernetes environment seems clear—then you begin discovering how many technical gotchas are “hidden beneath the surface.”
With a Kubernetes cluster often hosting multiple critical applications, at a minimum, you need basic alerting to ensure the uptime of your apps. For example, you need to be notified when nodes become unstable, or when a cluster is close to reaching its limit of CPU or memory requests. Otherwise, some pods might remain stuck in a pending state.
Prometheus alerting is great for small environments
Usually, teams turn to open source tools like Prometheus and Alertmanager to set up alerting. For small environments, this is a perfect solution. Alertmanager is free, and setup is easy. However, from our discussions with customers, we know that small environments can quickly grow into large environments of multiple Kubernetes clusters, each hosting multiple business-critical applications. This is often a consequence of companies eventually realizing the countless benefits of Kubernetes and then quickly going all in on this amazing technology.
While open source tools are great for small environments, they don’t scale easily, for example:
- Training: Teaching multiple teams how to configure alerting using Prometheus, Alertmanager, and especially, PromQL, can be a huge project.
- Access: Most of the time, each K8s cluster receives its own Prometheus instance so data is spread over multiple instances, with different access credentials, web portals, and, unfortunately, no context or correlation across clusters.
- Data security: At the same time, restricting access to specific data within one Prometheus instance is not possible. So, you need to choose between allowing everyone to see all data or no one seeing any data.
- Configuration: Usually, you want proper alerting for essential scenarios for each Kubernetes environment, which can be difficult to set up and keep in sync across multiple instances.
In summary, the Prometheus stack is amazing for Kubernetes alerting as long as you don’t need it for multiple teams.
Easily scale Kubernetes alerts for multiple teams
With Dynatrace, you can easily overcome the shortcomings of implementing a company-wide Kubernetes alerting solution based on Prometheus. To get started, open the global anomaly-detection settings for Kubernetes in the Dynatrace web UI and configure appropriate defaults for all Kubernetes clusters that are currently, or will in the future, be connected to Dynatrace.
You only need to flip a few settings toggles to activate critical Kubernetes alerts —there’s no need to research which essential metrics you need to alert on, learn a complex query language, figure out which metrics to use, or learn how to capture metrics. In other words, the training aspect of setting up alerts is reduced to near zero. When you use Dynatrace as a SaaS solution, you don’t need to take care of hosting—all your observability data is accessible in one place, while built-in access management allows you to easily define who is allowed to access which data.
Of course, each of your teams will want to adapt the default settings to their scope. This can be done easily by overwriting defaults on various scope levels. For example, if you have a Kubernetes development cluster, you probably don’t need the same alerts for nodes that you use in your production cluster. With Dynatrace, you can overwrite the global defaults for node alerts in the scope of every cluster. The same is true for common alerts on workloads, like alerting on frequent container restarts. You can easily define appropriate defaults for all workloads and overwrite them in the scope of a Kubernetes cluster or Kubernetes namespace. With this approach, you can provide each team with access to the settings related to their namespace. From their namespace page in Dynatrace, each team can directly navigate to the corresponding settings and adapt everything to their needs. There’s no need to learn a new query language or open a ticket to have someone else set and configure alerts.
Now each team can set and customize whichever alerts they want to use, including detection sensitivity. Consequently, internal data protection across teams is ensured and your team doesn’t need to take care of all other teams’ adaptations.
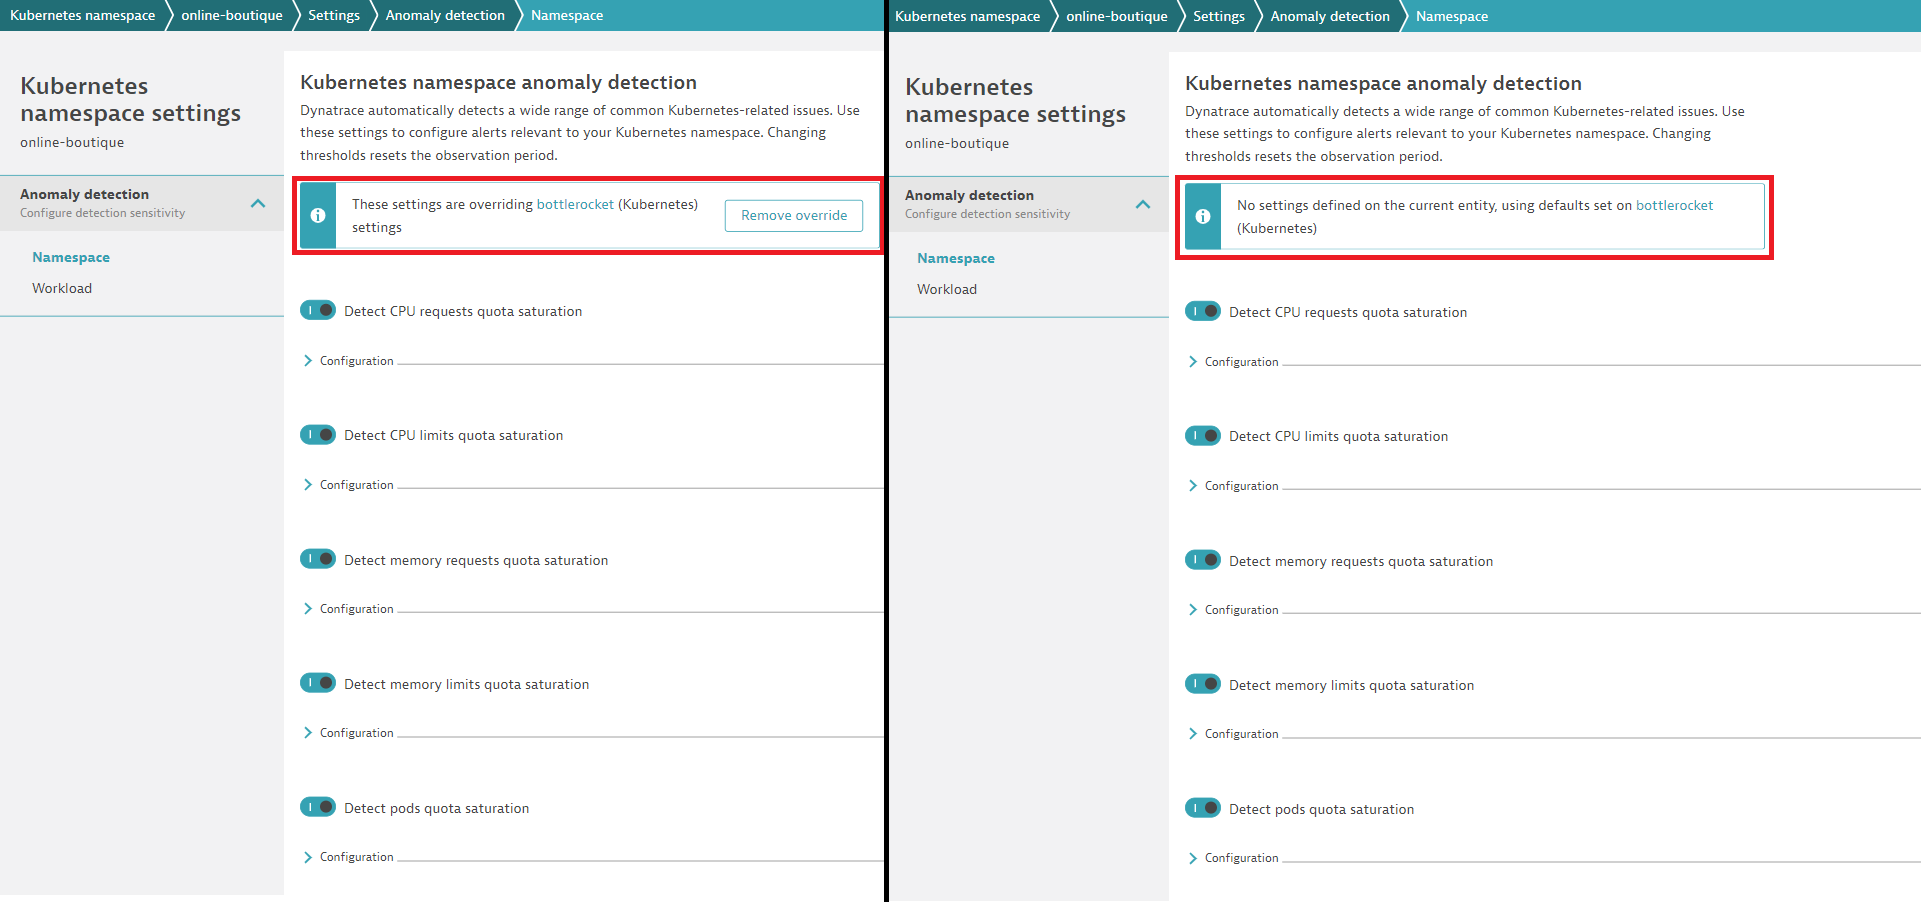
When many teams are involved, you might think that all the overwrites will be difficult to track and understand. No worries—Dynatrace has you covered. In the global settings of the Dynatrace web UI, you can explore all the various overwrites that exist in your Dynatrace environment.
It’s also easy for teams to understand if they are using custom alert configurations or the company-wide defaults.
Of course, all alert configurations can also be automated using the Dynatrace API. Going forward, you will even be able to use our monitoring-as-code approach to configure alerts in a GitOps fashion.
How can I get this feature?
With Dynatrace 1.254, we’ve released a first set of alerts for common Kubernetes issues. Over the coming months, we plan to incrementally expand this set. You can find more information and provide your feedback in the Dynatrace Community.
For complete details on this feature, see Dynatrace Documentation.
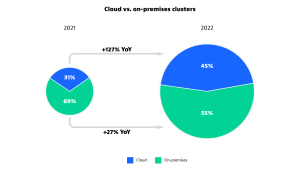
Kubernetes in the wild report 2023
This Kubernetes survey shows how organizations actually use Kubernetes in production. The study analyzes factual Kubernetes production data from thousands of organizations worldwide that are using the Dynatrace Software Intelligence Platform to keep their Kubernetes clusters secure, healthy, and high performing.


Looking for answers?
Start a new discussion or ask for help in our Q&A forum.
Go to forum