
Intelligent Log Monitoring
Make smarter, faster decisions when troubleshooting and measuring the health of your application environments – all while eliminating the costly overhead of ingestion and management.


Actionable insights for all your critical use cases

Discover and resolve issues immediately with logs, traces, and metrics automatically in context
- Davis® AI provides automated problem detection and root cause analysis with complete accuracy across all observability signals
- Accelerate mean time to identify (MTTI) and mean time to repair (MTTR) reduction through Davis AI problem cards, which automatically correlate traces, events, metrics, and logs across multiple tools and data silos, eliminating manual analysis and streamlining issue resolution
- Immediate analysis without the need for reconfiguration, indexes or schemas

Gain critical business intelligence using logs
- Easily extract business data from log files, automatically enriched with IT context
- Automatically extract business events from log files during ingest to gain valuable business insights
- Alert on business anomalies with Davis AI

Get rid of manual correlation between different monitoring tools
- Powerful search and filtering capabilities without writing queries
- Out-of-box ingest and cost control dashboards
- Pre-processing of common log formats like JSON or OTEL for enhanced search/filtering capabilities
- Utilize Davis AI co-pilot to write Dynatrace Query Language (DQL) and explain logs from natural language

Gain full-stack visibility across your entire Kubernetes environments
- Filter by namespace, workload, node, pod, and container to simplify analysis
- Easily implement log collection and data streaming integrations
- Diagnose cluster health and optimize resource usage across workloads with data in context and AI-assisted analytics

Leverage unified observability signal as part of security investigations
- Faster MTTR with automated root cause analysis levering logs, traces, events together
- Threat detection and incident response with the Security Investigator app
- Efficiently find the “unknown unknowns” with queries that span metrics, events, logs, and traces
- Cost-effectively retain logs and security events from days to years with instant access


Log monitoring and analytics as the key drivers in the hyperscale world
Unlock the power of log monitoring and log analytics in a hyperscale world with our whitepaper.
- Discover how unified log observability and analytics can supercharge your innovation and efficiency.
- Learn about the game-changing benefits of log monitoring and analytics in various scenarios.
- Overcome the challenges organizations face in implementing effective log management practices.
Download our whitepaper to see how to get answers to any question, any time, at any scale, with no indexes, rehydration, or sampling.
Do it all with the power of Grail


See how BMO delivers better digital experiences with Dynatrace
Greater efficiency
Cut 60 hours of monthly log analytics toil per team
Faster innovation
Unlocked 40 hours of extra time for development
Higher availability
Issue analysis and resolution time slashed by 80%


Take on your biggest challenges

Silos
Event correlation and root cause analysis across teams and data pools

Scale
Teams and budgets cannot keep up the volume and variety of data

Speed
Tradeoffs between data cost, availability, and fidelity delay MTTR
Start your 15-day free Dynatrace trial today!
You’ll be up and running in under 5 minutes:
Sign up, deploy our agent and get unmatched insights out-of-the-box.
Log resources
 WhitepaperSplunk vs Dynatrace: four paradigm shifts when moving from Splunk to Dynatrace
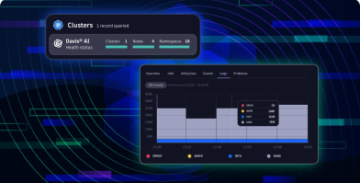 BlogUnlock log analytics: Seamless insights without writing queries
 BlogThe top four log analytics and log management best practices
 BlogAdvanced security analytics to resolve incidents quickly and streamline threat hunting
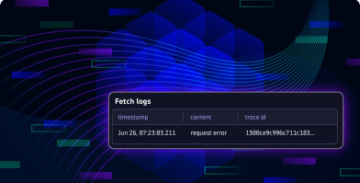 BlogFull Kubernetes logging in context: Easily stream logs from Fluent Bit to Dynatrace


