
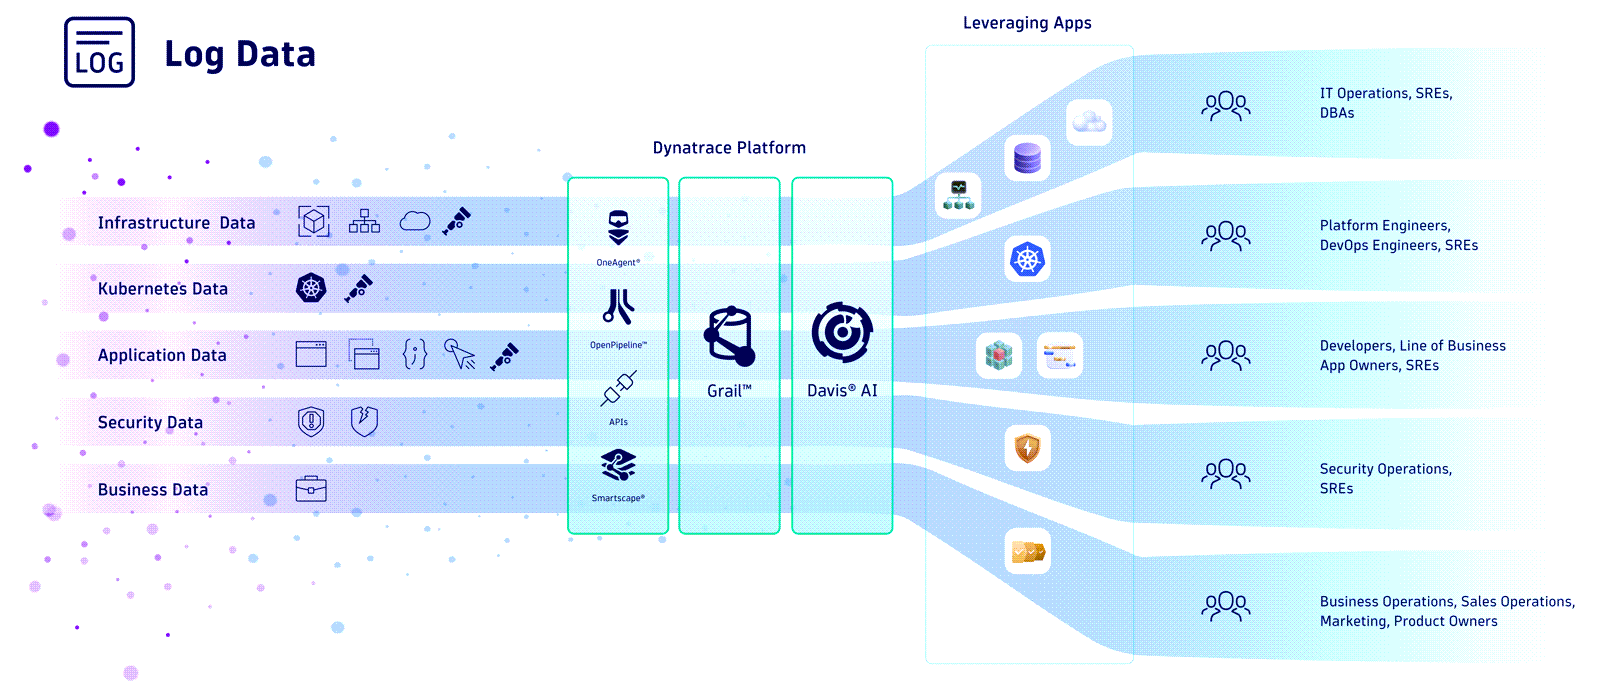
Logs are an integral part of the daily workflow for your DevOps and SRE teams to understand what’s happening in your tech stack. No matter the industry you operate in or the scale of your business, getting value from log data is often slowed down by challenges: making sure the right logs are monitored, finding the relevant logs when you need answers, and making sense of logs in the context of other data like traces, events, and metrics.
Logs provide answers, but monitoring is a challenge
Manual tagging is error-prone
Making sure your required logs are monitored is a task distributed between the data owner and the monitoring administrator. Often, it comes down to provisioning YAML configuration files and listing the files or log sources required for monitoring. This manual, error-prone approach can lead to monitoring gaps, which become critical when a host or service has an outage or incident.
Finding the right logs is cumbersome
Even if your logs are monitored, you need to make sense of the vast data volume. As the scale and complexity of your tech stack grows, you might need to navigate the maze of hosts or Kubernetes clusters, apps, and microservices and understand the relevance and risks associated with logs originating from these entities. Challenges compound: Manual tagging of log sources has long been difficult regarding monitoring coverage. And you can’t assume the tagging is 100% correct to pinpoint the correct logs.
In the past, more work was needed to understand the context of log data. What about correlated trace data, host metrics, real-time vulnerability scanning results, or log messages captured just before an incident occurs? This context is vital to understanding issues.
Dynatrace automatically puts logs into context
Dynatrace Log Management and Analytics directly addresses these challenges. First, OneAgent takes care of log autodiscovery. Once logs are selected for monitoring, OneAgent enriches log data with the topological context you need. For example, OneAgent helps you monitor the logs from a Kubernetes environment with automatic enrichment that identifies the right cluster, namespace, container, and pod ID.
Once logs are stored in Dynatrace Grail™, our purpose-built data lakehouse for observability data, the logs are automatically shown in the right context. Finding answers begins with opening the right app for your use case.
You can easily pivot between a hot Kubernetes cluster and the log file related to the issue in 2-3 clicks in these Dynatrace® Apps: Infrastructure & Observability (I&O), Databases, Clouds, and Kubernetes.
Open a host, cluster, cloud service, or database view in one of these apps, and you immediately see logs alongside other relevant metrics, processes, SLOs, events, vulnerabilities, and data offered by the app.
By eliminating slow and manual correlation, lack of context, and getting visibility into the surrounding data, you reduce the risk of prolonged outages, mean time to repair, and tool sprawl.
Get quicker answers
Let’s look at how logs in context can make your teams more effective.

Log histograms: Insight into log volumes and patterns
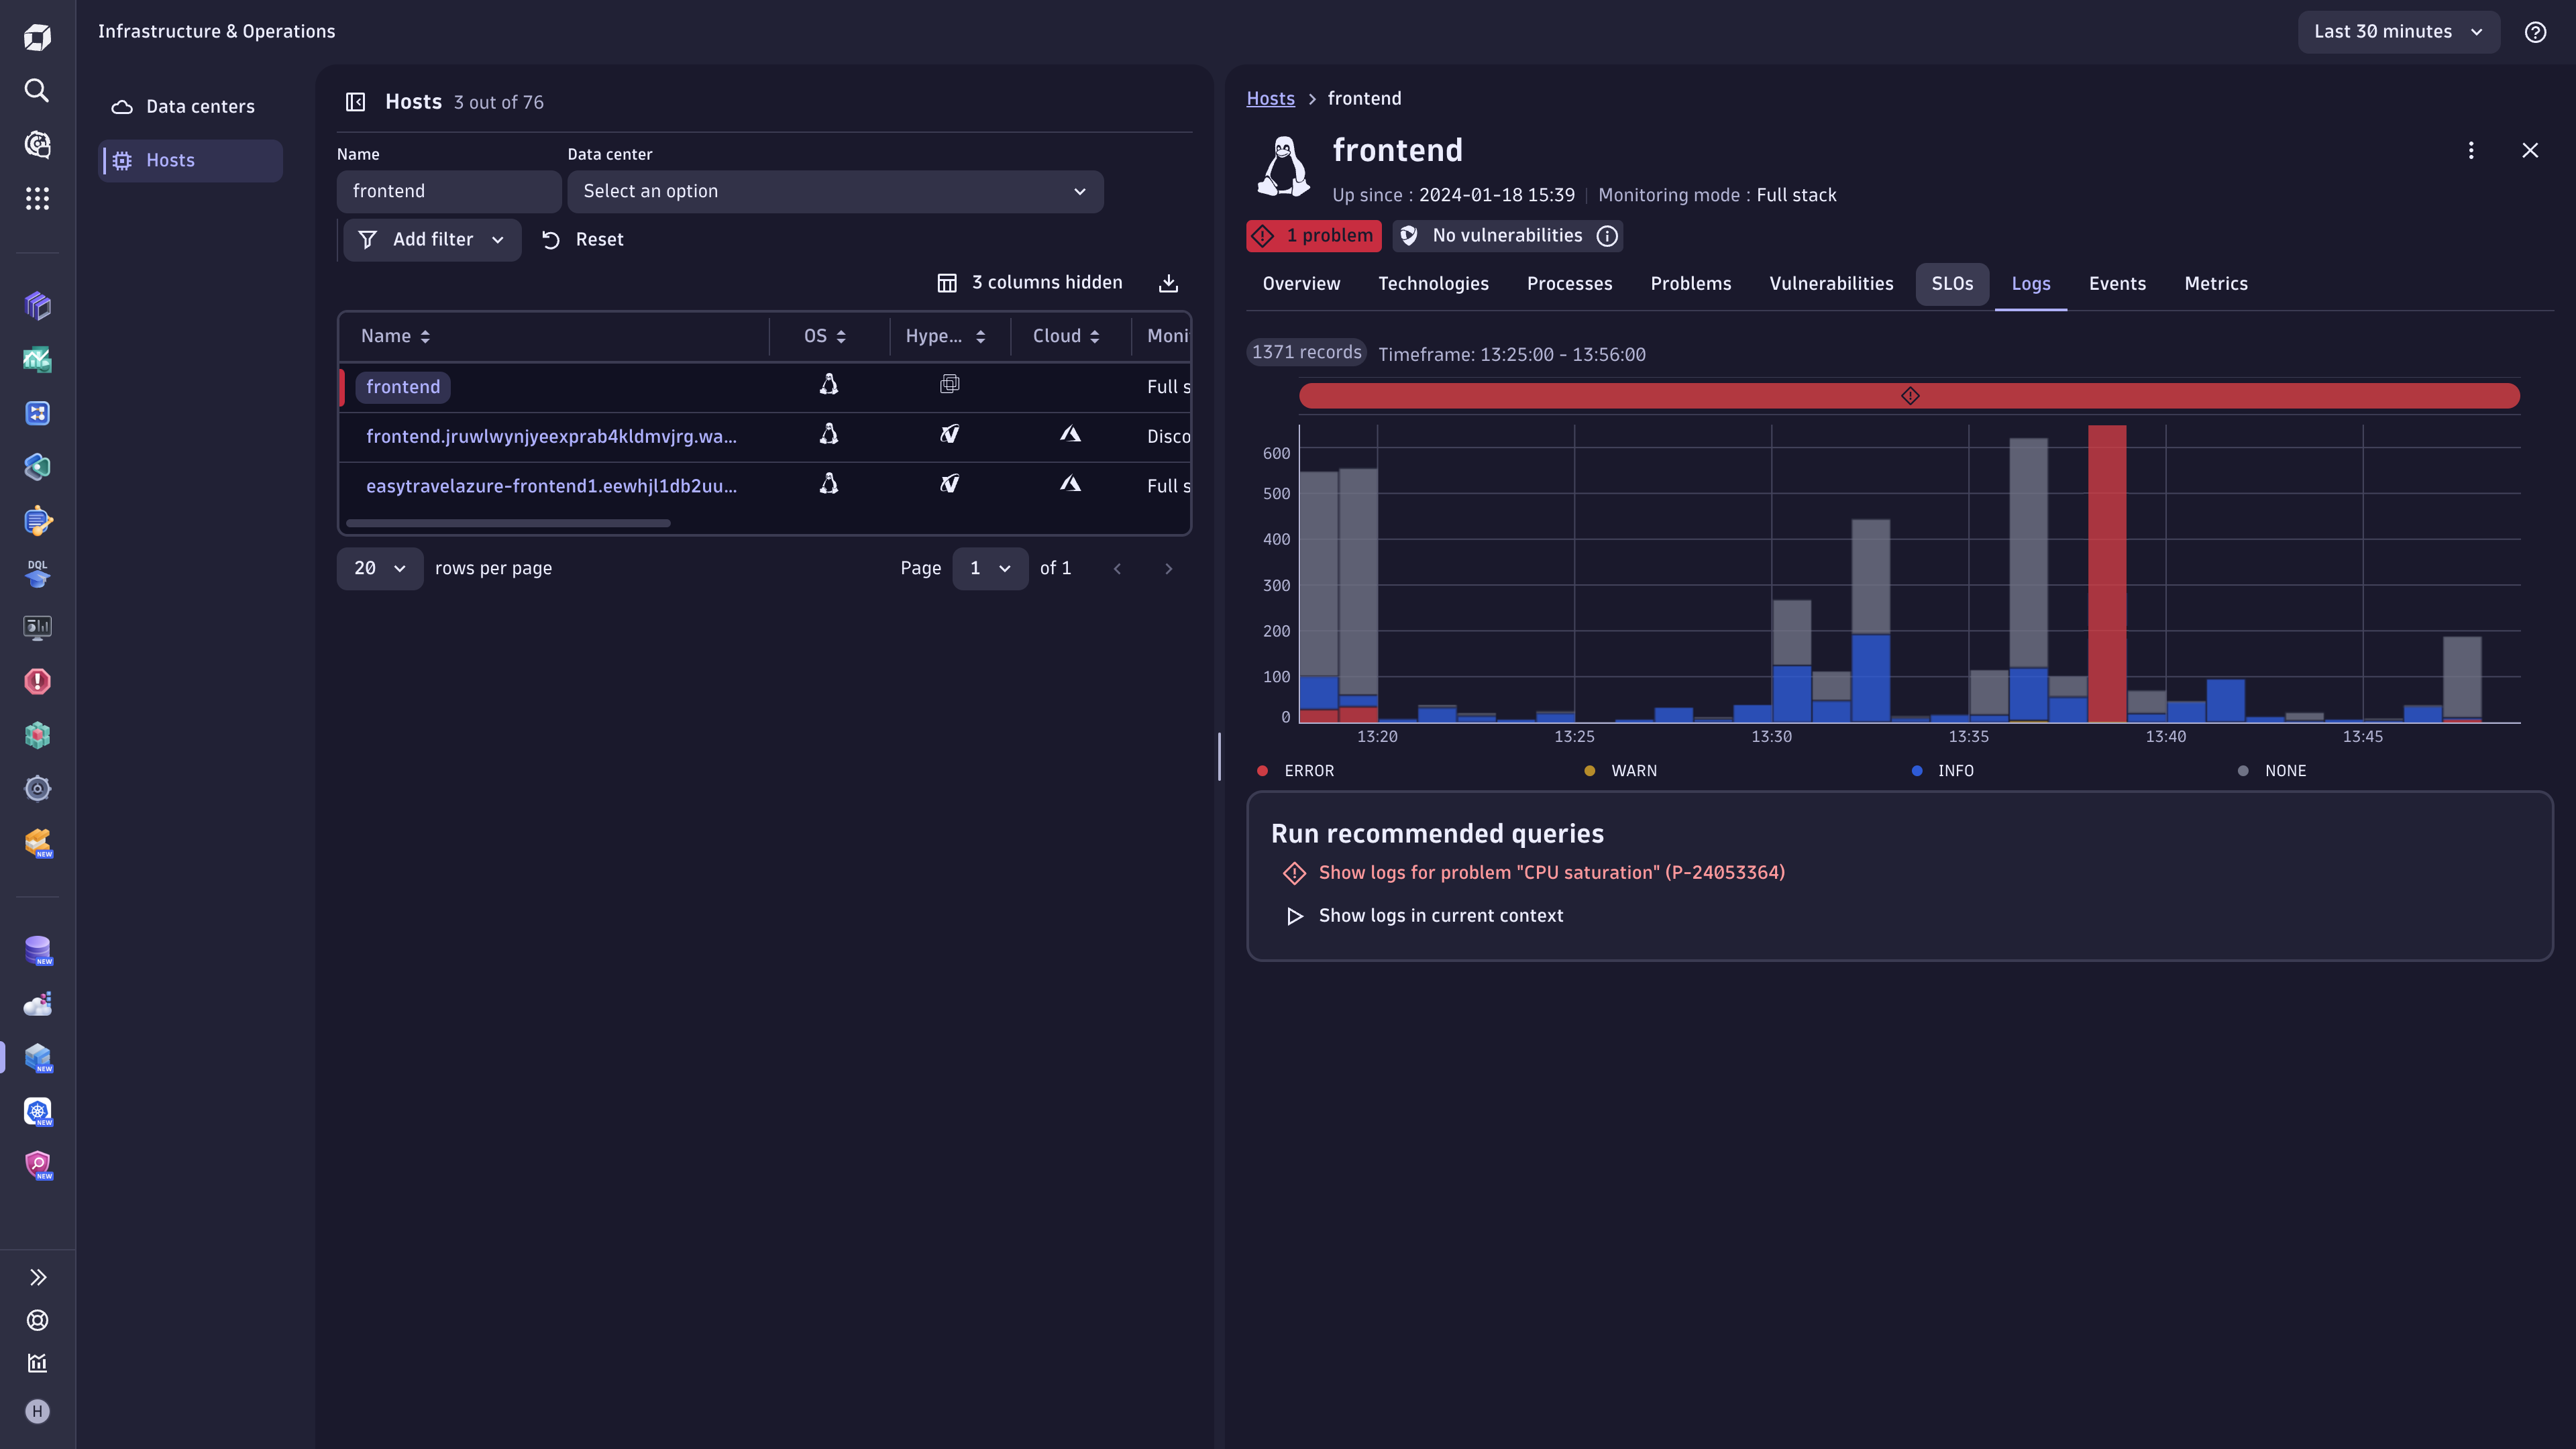
Open one of these Dynatrace Apps and select Logs for any listed entity (host, Kubernetes workload, cloud service, or database instance):
- Infrastructure & Operations
- Kubernetes
- Databases
- Clouds
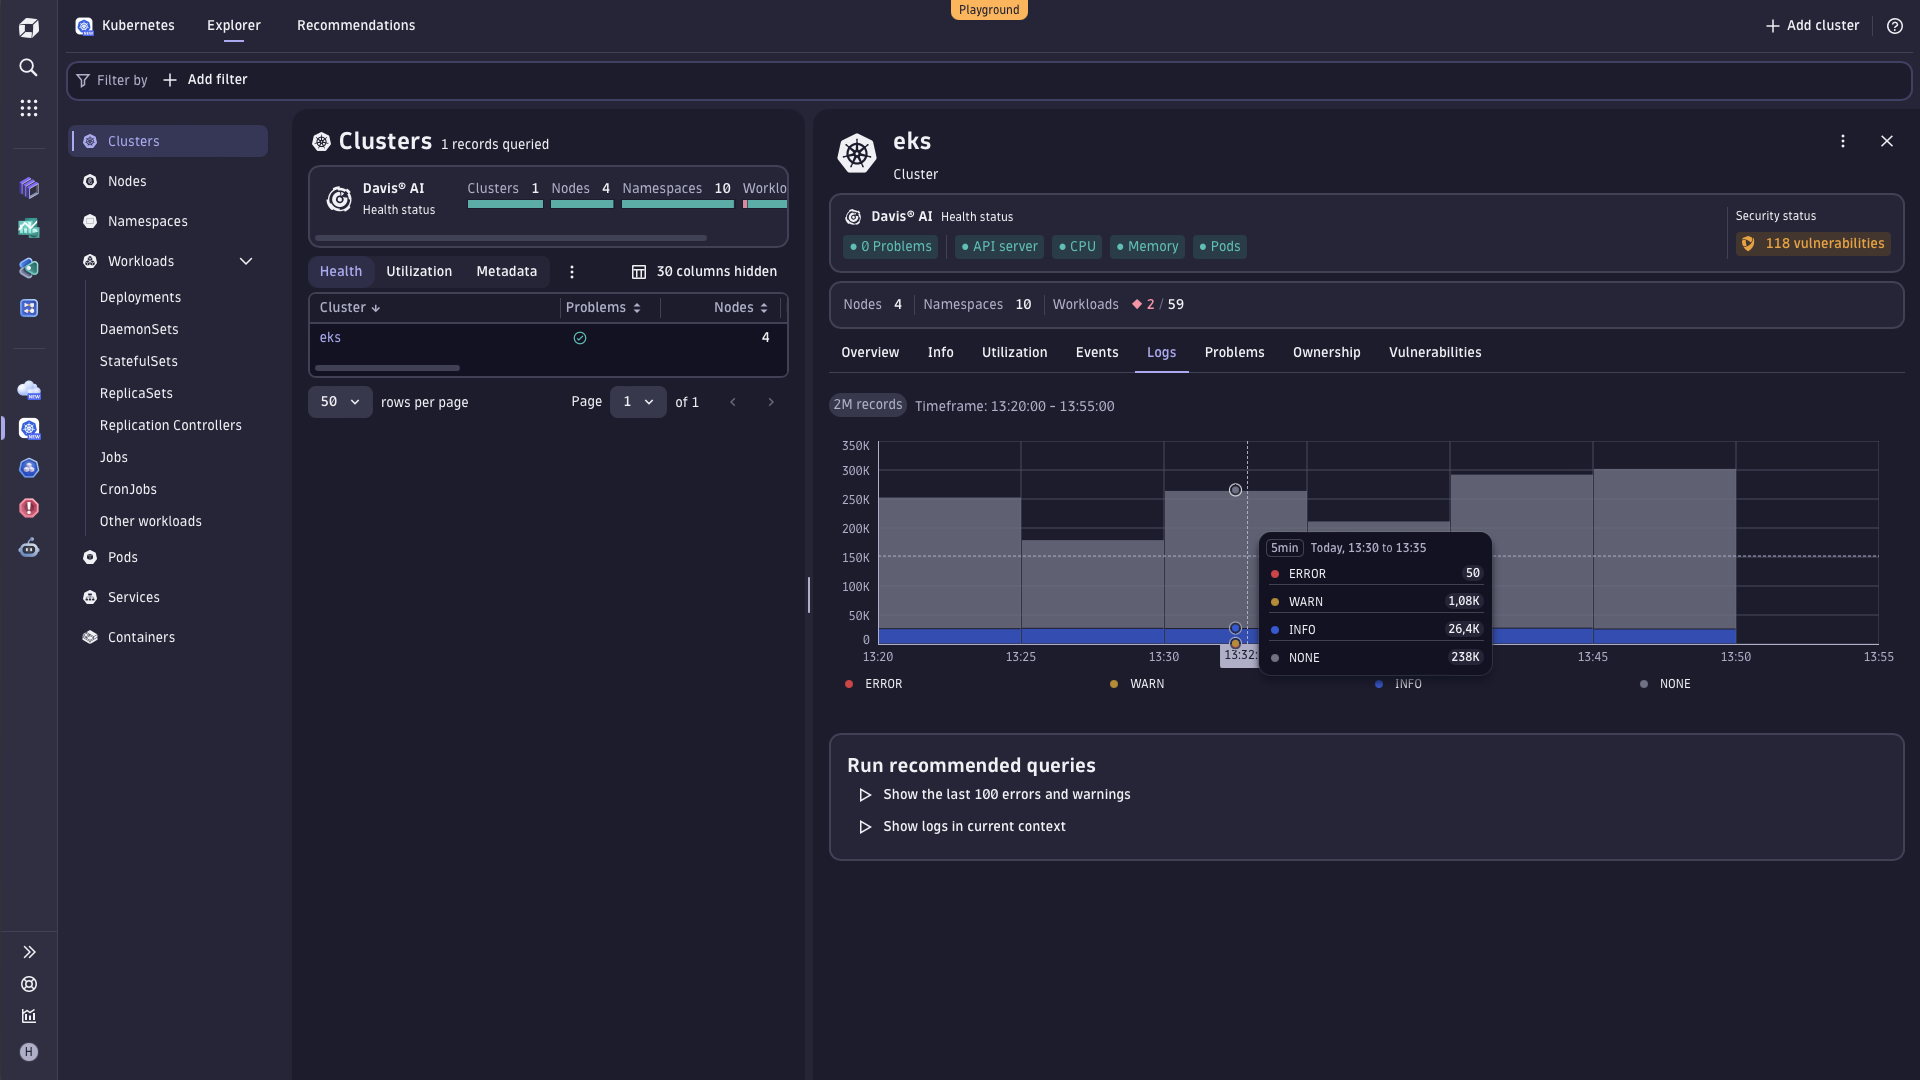
You’ll see a histogram chart of log data with various severity levels (such as Error, Info, or Warning) relevant to the selected Dynatrace entity, giving you a clear understanding of log patterns and volumes over time. Is there a sudden spike in errors? A sudden drop in received log data? Depending on which app is in use, one glance at a histogram provides invaluable insight into managing clouds, databases, Kubernetes environments, and infrastructure.
Log analytics simplified: Deeper insights, no DQL required
Your team will immediately notice the streamlined log analysis capabilities below the histogram. Jump directly into log insights by selecting a recommended query, for example, to see the errors related to a problem detected by Davis® AI during the selected timeframe. Furthermore, your team can easily access all error logs within the specified timeframe displayed on the histogram or view all logs within that timeframe, all without writing any queries from scratch.
Surrounding logs display: Effortlessly navigate log context
You can see the result after opening a recommended query without leaving an app’s context. Upon expanding a single log entry, all relevant context provided by OneAgent during the ingestion process is displayed, making it easy to expand your analysis to the infrastructure or entity related to the error logs. For a single log record found, you can easily see the surrounding logs.
Look at this example of an online store payment service generating errors. The application owner found error logs related to unsupported credit cards. Select Surrounding logs to view the log messages for the whole transaction, based on the trace ID, that ended up with an error and a failed order.
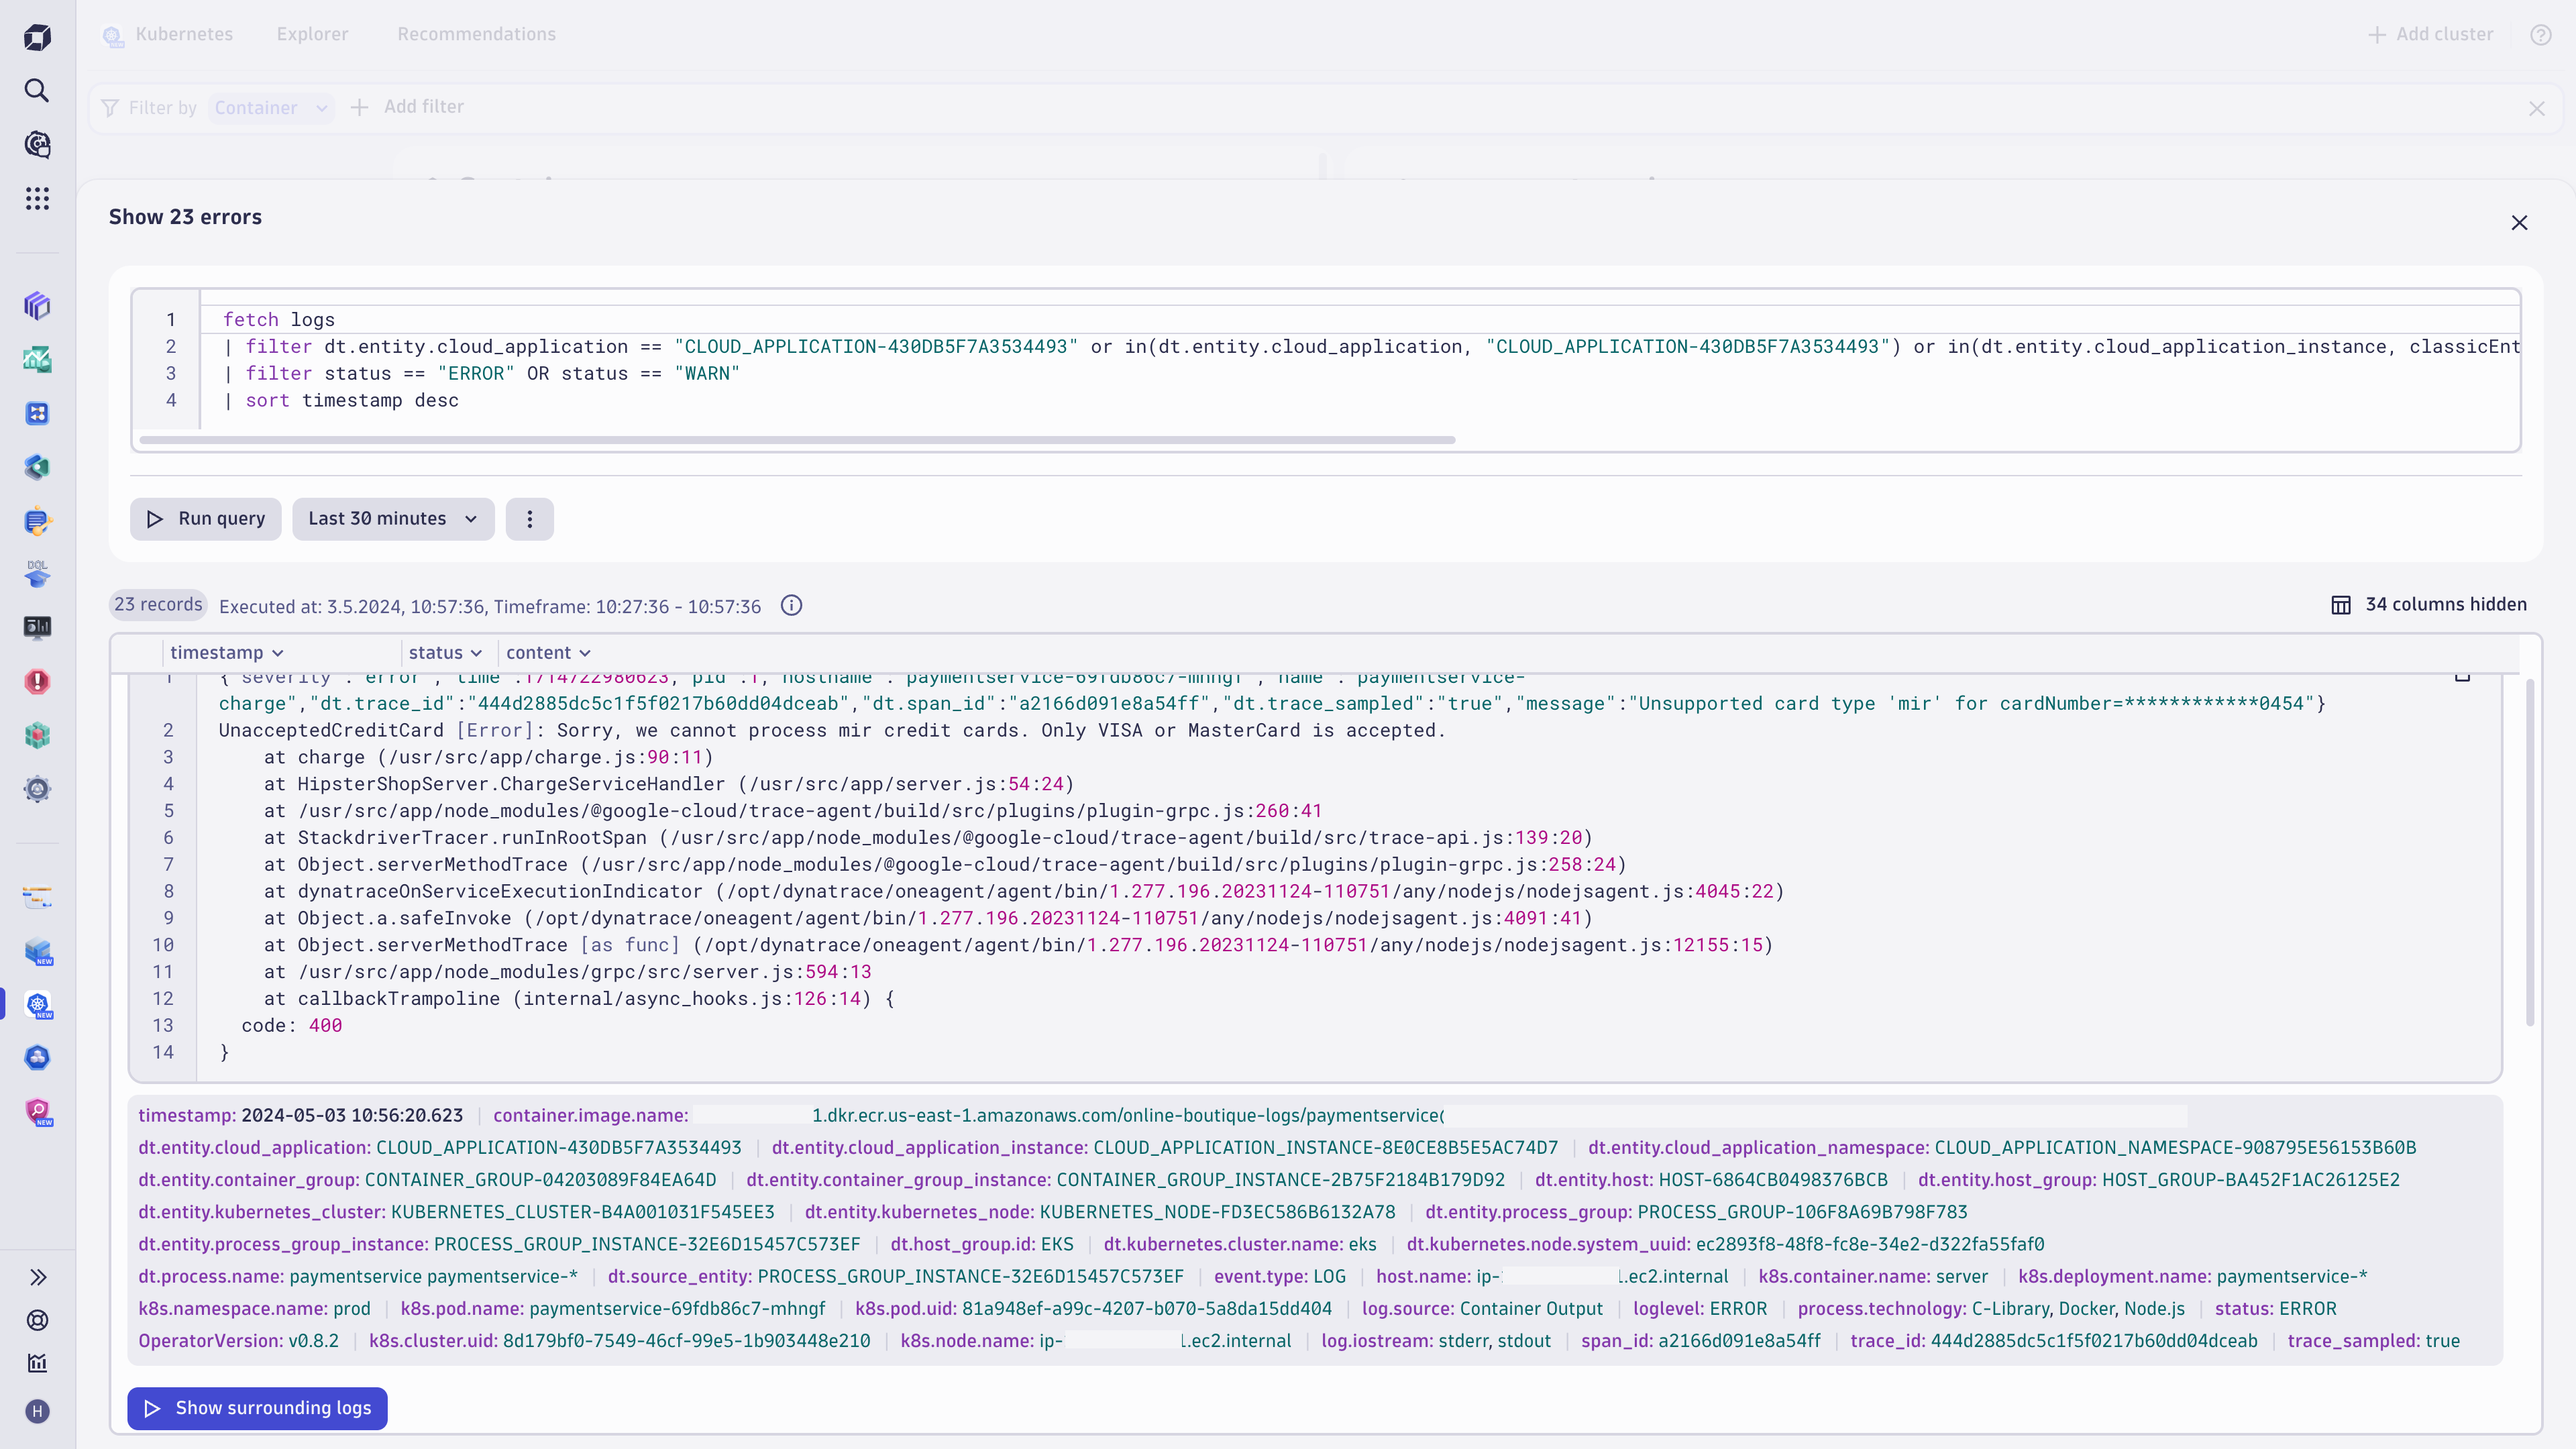
In Infrastructure & Operations, surrounding logs can also be displayed based on other criteria, like the host file or log source from which logs are collected. This allows quick and easy troubleshooting without writing or editing queries.
Logs in context across Dynatrace Apps
- Infrastructure & Operations leverages advanced AI capabilities that automatically discover and map all components within your infrastructure, including hosts, virtual machines, containers, and cloud instances.
- Databases offers comprehensive database monitoring capabilities, providing organizations with real-time visibility into the performance and health of their database environments.
- Clouds is a central hub for monitoring and managing multicloud environments, providing organizations with a unified view of their cloud infrastructure and services.
- Kubernetes delivers comprehensive monitoring and management capabilities for Kubernetes environments, enabling organizations to ensure the performance, availability, and scalability of their containerized workloads.
Stay tuned for even wider support of log data embedded seamlessly into the context of Dynatrace Apps, and better ways to get answers from logs without writing queries.
See for yourself
- Watch a demo of logs in context within various Dynatrace Apps in this Dynatrace University course.
- Open your free Dynatrace trial now to get started.


Looking for answers?
Start a new discussion or ask for help in our Q&A forum.
Go to forum