


Distributed tracing with Dynatrace just got even better
Get ready to experience a whole new world of limitless tracing power. With our latest enhancements, we’re transforming the way you work with trace data.
Dive deep
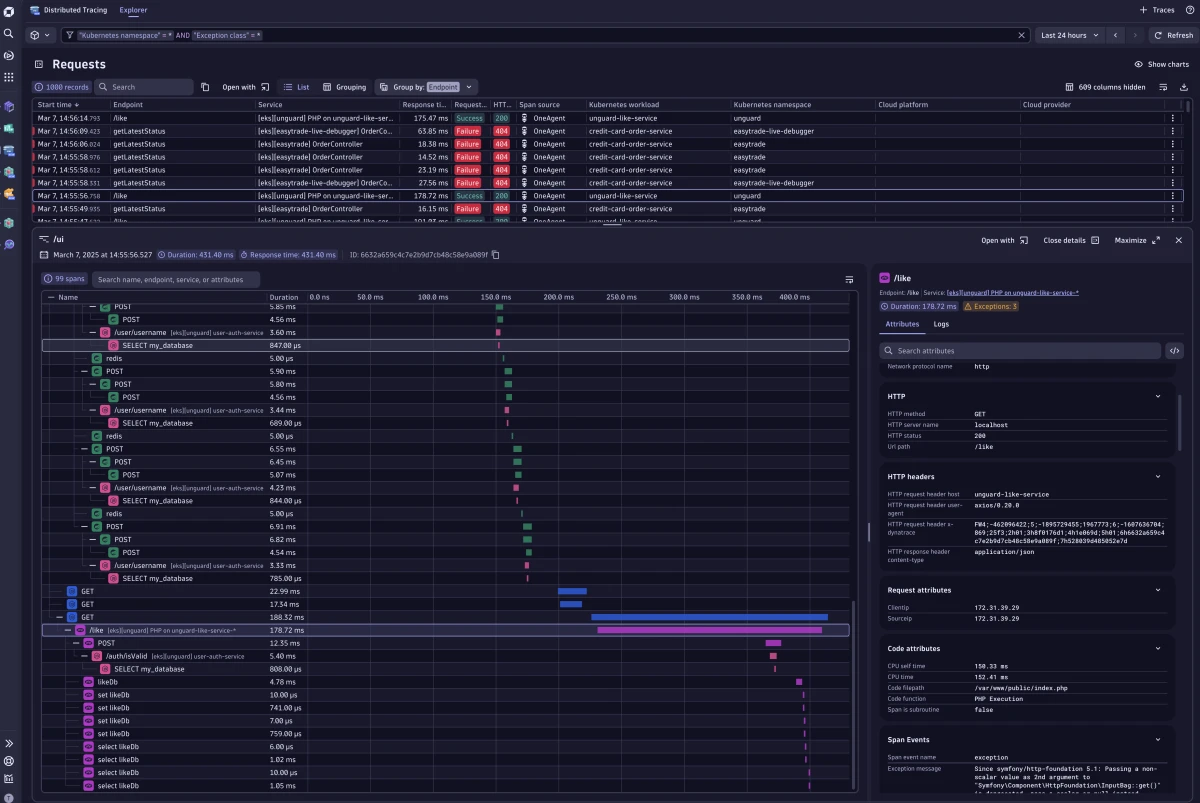
 Distributed Tracing
Analyze and slice distributed traces by any attribute and from any source.
AppSince 2006, Dynatrace has pioneered distributed tracing with patented PurePath® technology, which combines distributed tracing attributes with additional insights like user experience insights, logs, metrics, topology information, metadata, and even code-level profiling information to provide the highest level of data fidelity and granularity. Distributed Tracing seamlessly integrates OpenTelemetry tracing signals with traces that are either automatically captured by OneAgent or ingested via the Trace Ingest API.
Distributed Tracing requires that Traces powered by Grail be available in your environment. For details, see Dynatrace Grail documentation.
L on a focused span list row to open related logs.T on a focused exception grouping row to view traces.Escape closes the panel and returns focus to the table.view-traces-addon intent that opens a modal allowing users to navigate through a list of matching traces using stepper.http.status_code available for filtering.Endpoint in (query, executeQuery).


