
It’s 3:00 AM. Alerts are firing. Something’s broken, latency is spiking, there’s too much noise, and you’re under pressure to find the root cause fast. You need to be able to understand how your system interacts to solve the problem as soon as possible. But systems just keep getting more complex as your organization adds new technologies, AI models, and container-based microservices. That’s why, as complexity scales, so does the need for connected insights. In the world of observability, logs and traces serve distinct but complementary purposes. When used together, they unlock a powerful view into system health, performance, and behavior.
The secret lives of logs and traces
In theory, correlating logs and traces should be straightforward. However, in practice, teams often find themselves context-switching to follow the path of a trace and all the logs involved. To understand why, let’s take a closer look at the roles and responsibilities of logs and traces.
Traces: The big picture view
Traces follow the journey of a request as it moves through various services in a distributed system. They provide end-to-end observability of how different components interact, making them ideal for understanding latency, bottlenecks, and service dependencies. Distributed traces connect events into a cohesive timeline, helping engineers see how one service’s performance affects others.
Traces shine when you’re trying to answer questions like, “Where did this request slow down?” or “Which service caused the failure?”
Logs: The detailed detective work
Logs are detailed, timestamped records of events generated by applications and infrastructure. They’re rich in context, often containing error messages, debug information, and custom outputs that developers write into the code. While traces show the flow, logs show the details. Logs can exist independently of traces and are often the first place developers look when something goes wrong.
Logs shine when you’re trying to answer: “What exactly happened here?”
Don’t forget metrics and other telemetry signals
Although we’re focusing here on logs and traces, metrics and other telemetry data are also essential for observability and deeper context. For more about why it’s important to unify the full spectrum of observability signals, see What is observability and Unified observability: Why storing OpenTelemetry signals in one place matters.
The power of correlating logs and traces from a single, full-context platform
Isolated telemetry signals can lead to blind spots and wasted time searching for answers. Some of the main ways to use logs and traces are to simplify troubleshooting, enhance performance, improve security posture, and meet compliance standards.
When you can correlate logs and traces from a single source of observability data, you eliminate the constant context switching that slows down investigations. Instead of toggling between tracing tools and log viewers, you get a unified view that connects the dots fast.
Correlating logs and traces from a single platform transforms troubleshooting from a fragmented hunt into streamlined analysis, where you spend time solving problems instead of searching for information. Core technologies like Grail®, OneAgent®, and Davis® AI provide the scalable foundation while embracing open-source frameworks like OpenTelemetry for flexibility.
Cracking the case of the failed checkout: Investigating logs and traces
Not every investigation starts the same way. Sometimes a trace gives you the high-level view you need to spot an issue and dive deeper. Other times, a log entry is the first clue that something is off. In the next section, we’ll walk through two examples, one that starts with traces and the other with logs, to show how you can get the answers you need.
Scenario 1: Investigating from traces to logs

While doing some routine monitoring in the Distributed Tracing app, we notice a series of failed requests in our Kubernetes prod namespace. So we filter for unsuccessful transactions to examine them more closely.
One request stands out: “/cart/checkout”. It’s a critical transaction path, and we’re seeing failures.
We dive into the trace waterfall. Just below it, we find the logs tied to each span, giving us deeper insight. That’s where we find the message:
“error: failure to complete the order”
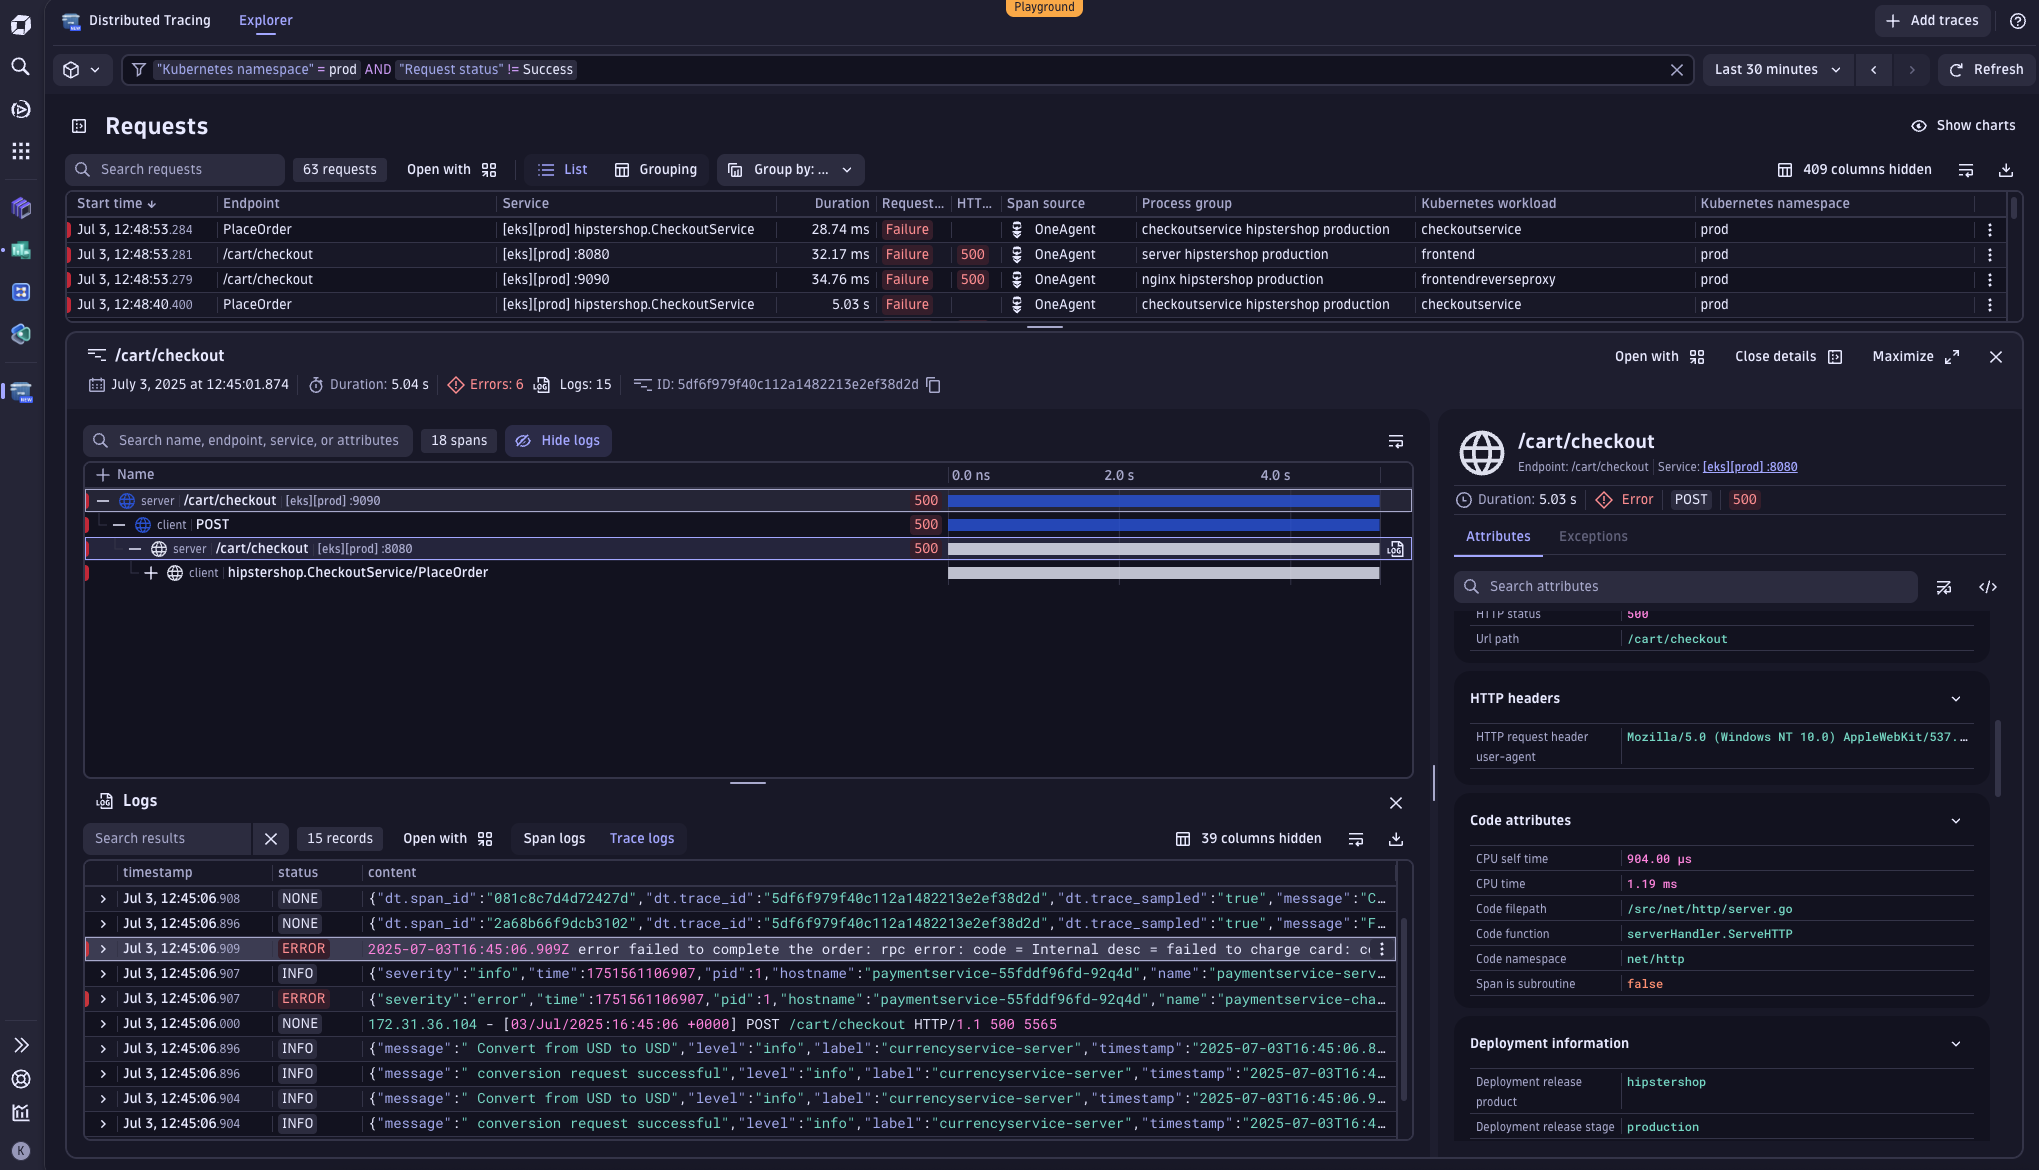
Digging further, another log reveals the root cause: only Visa and Mastercard are accepted, which is in line with our policy, but potentially limiting our business. This raises a new question: how often is this happening?
With a single click, we pivot to the logs app, where we can search for this specific message and quantify how many transactions may have been impacted.
This approach turns scattered signals into a cohesive story, helping us move from surface-level symptoms to actionable insights with speed and precision.
Scenario 2: Investigating from logs to traces

No matter how you start your day, whether you are coming from PagerDuty, Slack or start directly in Dynatrace through one of the many apps like Kubernetes or the Clouds app, you can always see logs in context of your investigation.
In this scenario, we’re investigating this case from another angle, starting with the logs app using the prefiltered segment for the Kubernetes prod namespace. The view is tailored to the services we own. A quick scan reveals something suspicious: numerous errors in some of the log files.
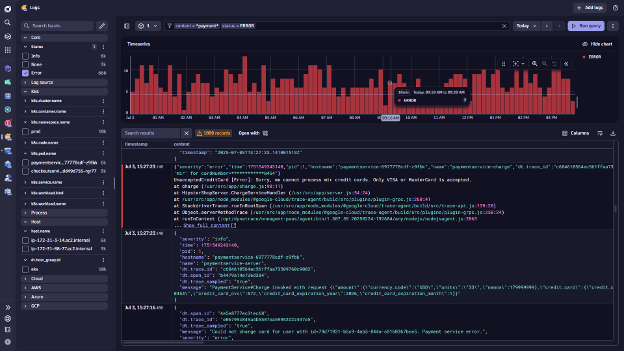
To dig deeper, we navigate in the logs app and use the content filter for “payment” and “error”, and we find several logs with the following message:
Could not charge card for user id = xxxxxxxxxxxxx
But what is causing the failure? We click Show surrounding logs, which reveals all logs associated with the trace ID. Now we can view log messages sequentially as they happened.
Investigating some of the surrounding logs, we see that the user is using a credit card other than Visa or Mastercard, which our organization doesn’t support. Now that we understand why things are failing, let’s investigate further to see if we can optimize this experience.
To understand the full impact, we pivot seamlessly to the trace view. Here, we see the full waterfall breakdown of the request: service calls, timing, and span-level metadata.
One detail stands out: it took 5 seconds for the user to receive the failure message. That’s a long time to wait just to be told their card isn’t supported.
With this insight, we can now make targeted improvements so that the user does not have to wait a long time to understand that their payment method is not supported and deliver a better user experience.
While these examples highlight how seamless navigation between logs and traces accelerates troubleshooting, they’re just one part of the story. With Dynatrace Grail and Notebooks, you can take things a step further by running advanced queries, automating repetitive tasks, and building collaborative, data-rich workflows. These tools empower teams to go beyond reactive troubleshooting and into proactive, scalable observability.
Why seamless navigation between logs and traces matters
Seamless navigation between logs and traces isn’t just a convenience; it’s a game-changer. Whether you start with a trace or a log, the ability to pivot instantly between signals means you spend less time hunting for answers and more time solving problems. It accelerates root cause analysis, improves team collaboration, and gives you the full context needed to act with confidence. This is just one example of how Dynatrace helps you move from fragmented troubleshooting to unified intelligent observability.
Ready to start investigating?
Explore Distributed Tracing and Log Management and Analytics, complete with prepopulated data in the Dynatrace Playground.


Looking for answers?
Start a new discussion or ask for help in our Q&A forum.
Go to forum