
Get ready to experience a whole new world of limitless tracing power. With our latest enhancements, we’re transforming the way you work with trace data. The Dynatrace® platform now enables comprehensive data exploration and interactive analytics across data sets (trace, logs, events, and metrics)—empowering you to solve complex use cases, handle any observability scenario, and gain unprecedented visibility into your systems. Whether you’re using OpenTelemetry or OneAgent, operating in the cloud or on-premises—we’ve got you covered.
Introducing a new era of distributed tracing with advanced analytics
In today’s complex systems landscape, understanding the root causes of issues can be daunting, especially as applications scale and OpenTelemetry adds complexity.
Davis® AI automatically pinpoints root causes, offering immediate answers. For deeper exploration, our Distributed Tracing app empowers you to analyze raw trace data and uncover insights, whether troubleshooting errors, optimizing performance, or discovering the “unknown unknowns.”
But why stop there? Building on this solid foundation, we’re thrilled to announce two powerful platform enhancements. Say hello to advanced trace analytics and new data storage and capture options. These game-changing features elevate your data interactions, opening up vast possibilities for advanced queries and efficient data management tailored to your needs.
Site reliability engineers, performance architects, and developers can now leverage dynamic analysis tools like dashboards and workflows to explore trends, automate processes, and maintain control at an unprecedented level. Additionally, these queries serve as excellent starting points for more complex data explorations with Notebooks.
Get ready to maximize the full potential of your trace data—unlock deeper insights and automate like never before, all within a single platform.
Level up your analytics game: Enhanced team collaboration and advanced data insights
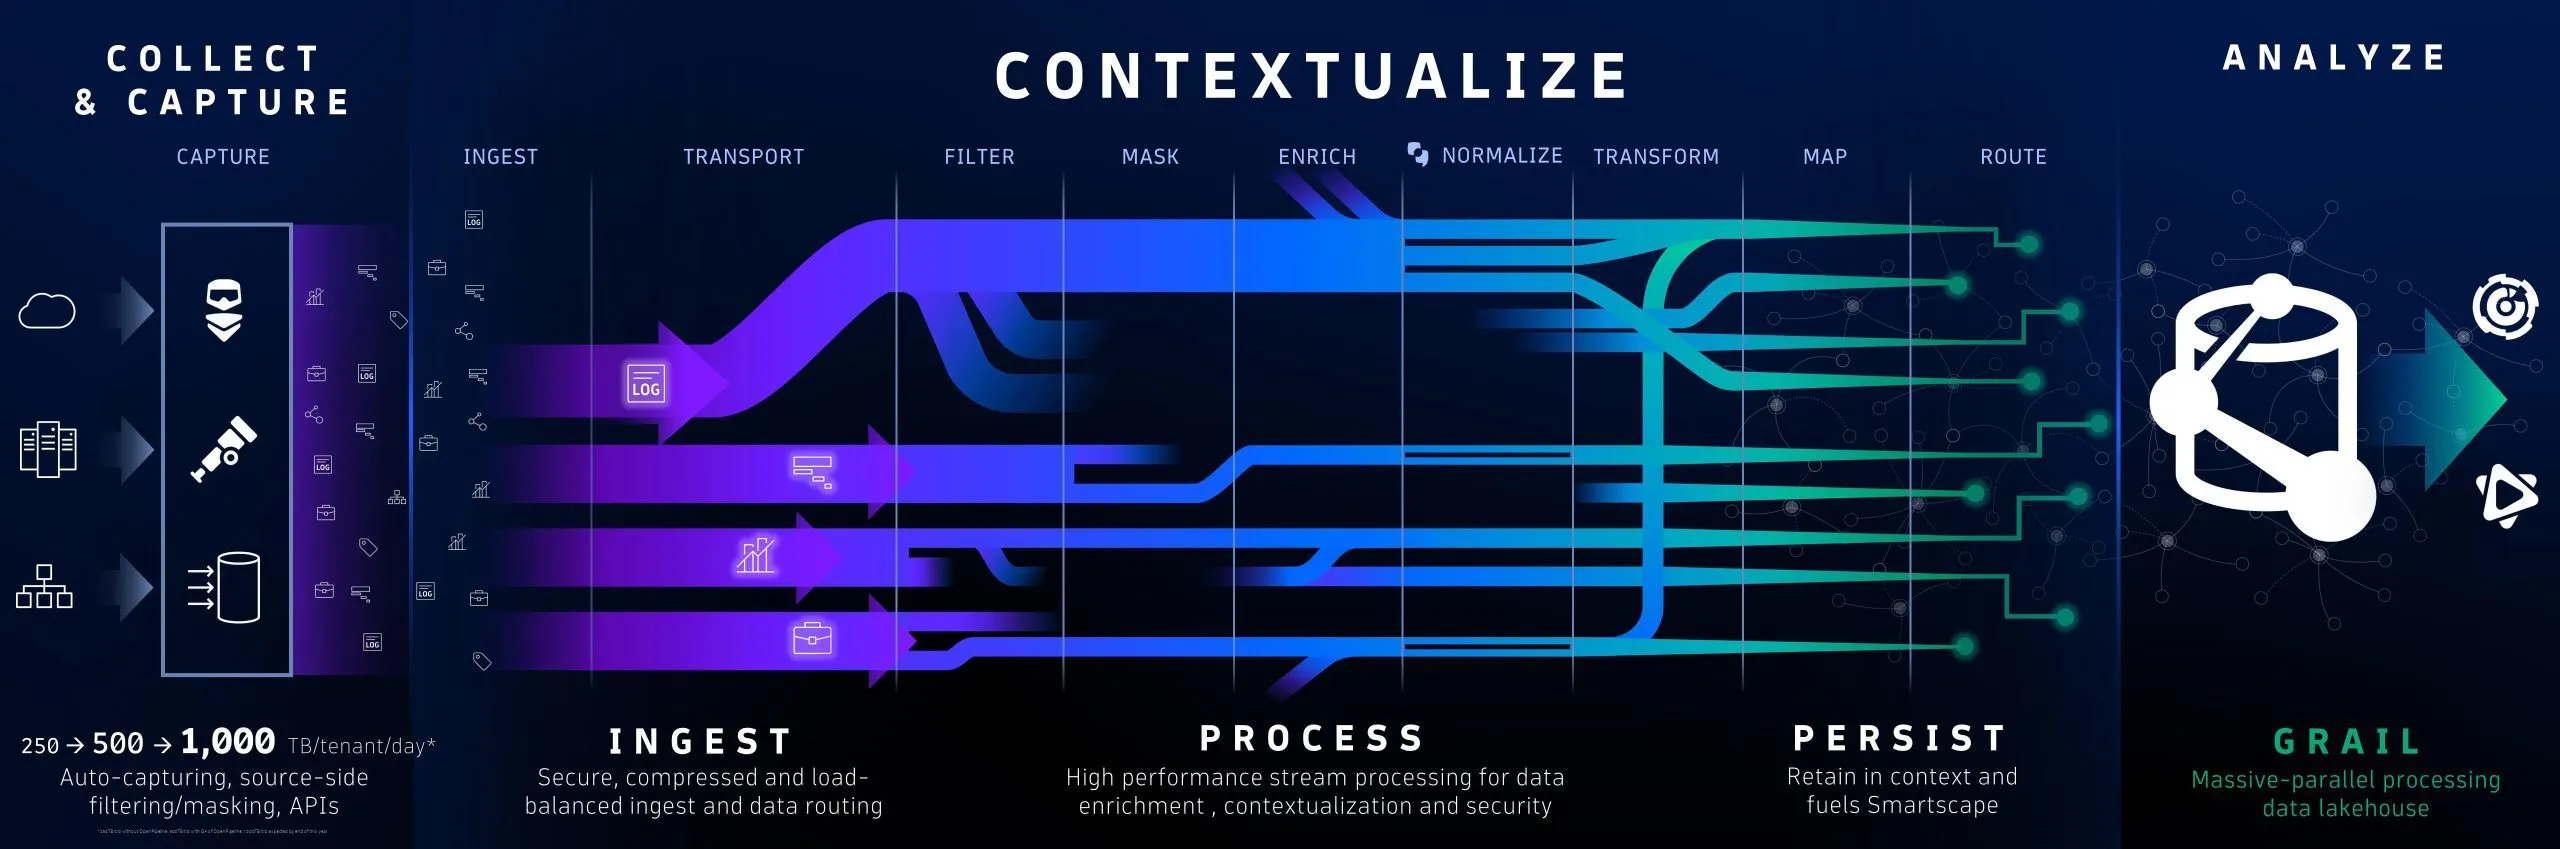
With traces now stored in Dynatrace Grail™, our scalable data lakehouse, you can unlock powerful new analytics capabilities, handle massive volumes of data, and run complex queries seamlessly. Combining traces with logs, metrics, Kubernetes events, and telemetry attributes gives you a complete, contextual view of your environment for unmatched end-to-end observability.
Unlock deeper insights
Using Dynatrace Query Language (DQL), you can extract game-changing insights from raw span data with precision. Use these queries to start more complex data exploration with Notebooks. This enables you to uncover hidden patterns, discover unknown unknowns, and make confident, data-driven decisions. These powerful insights can easily be transformed into interactive dashboards.
Example: Exception analysis
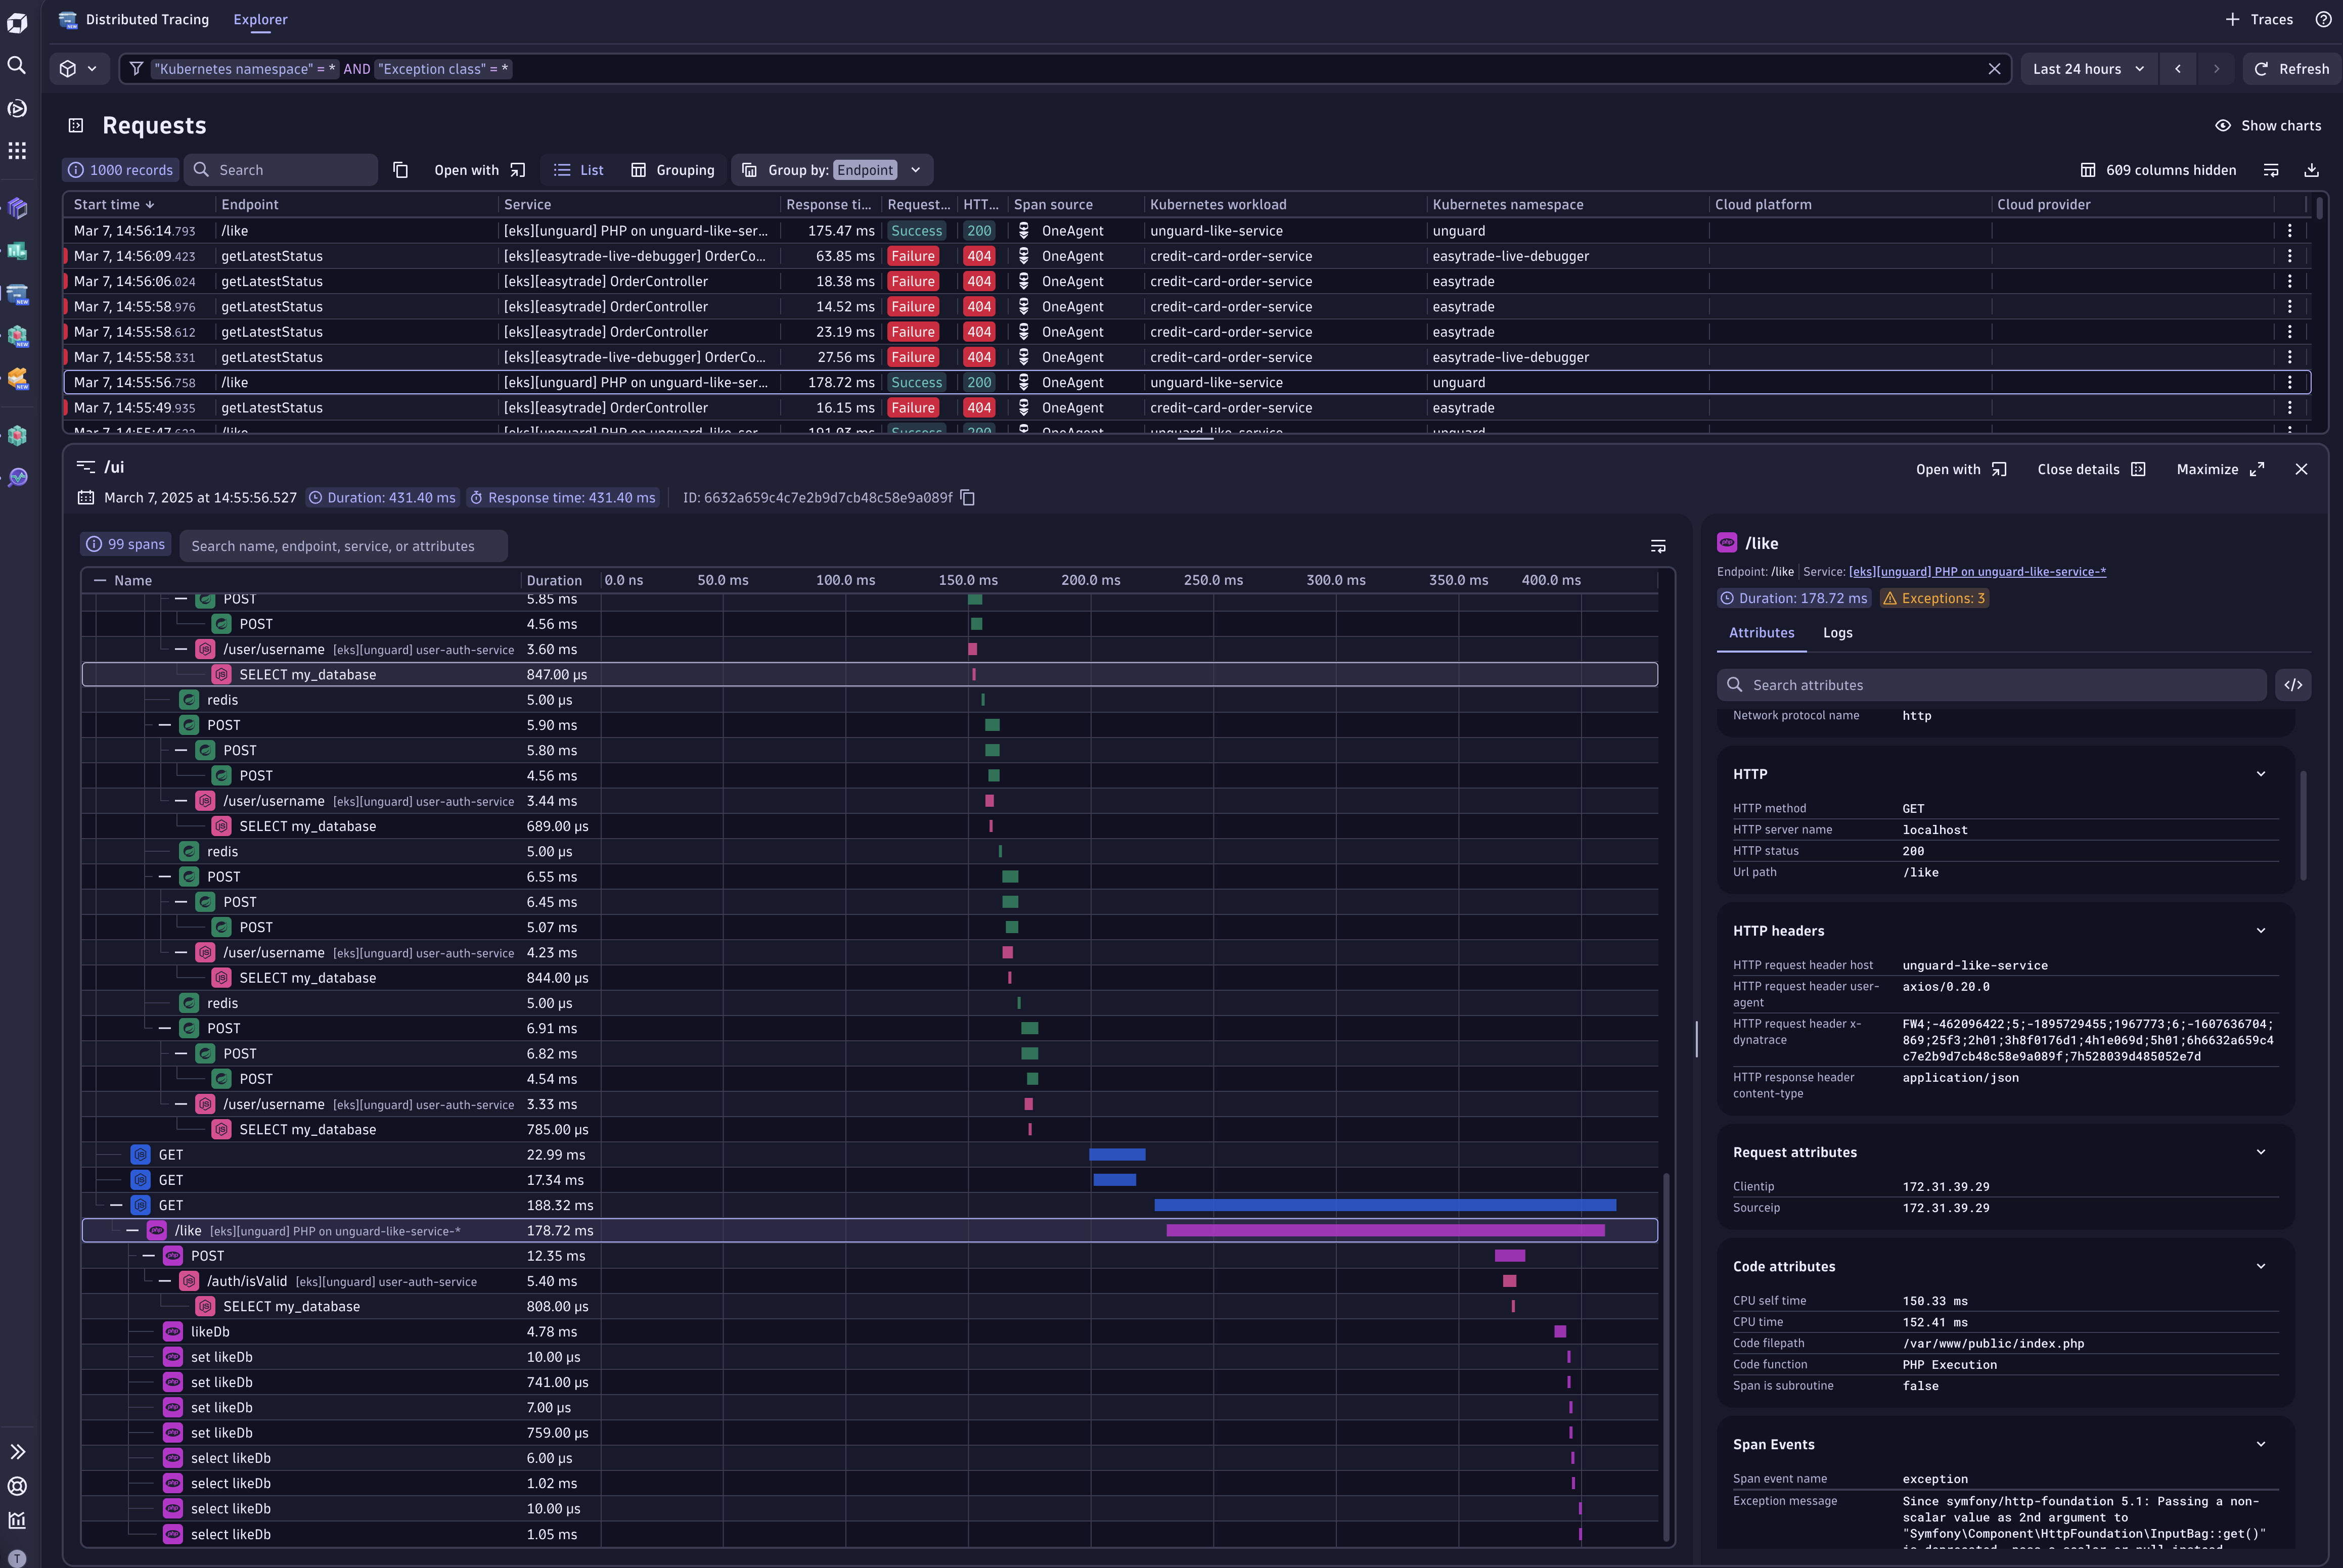
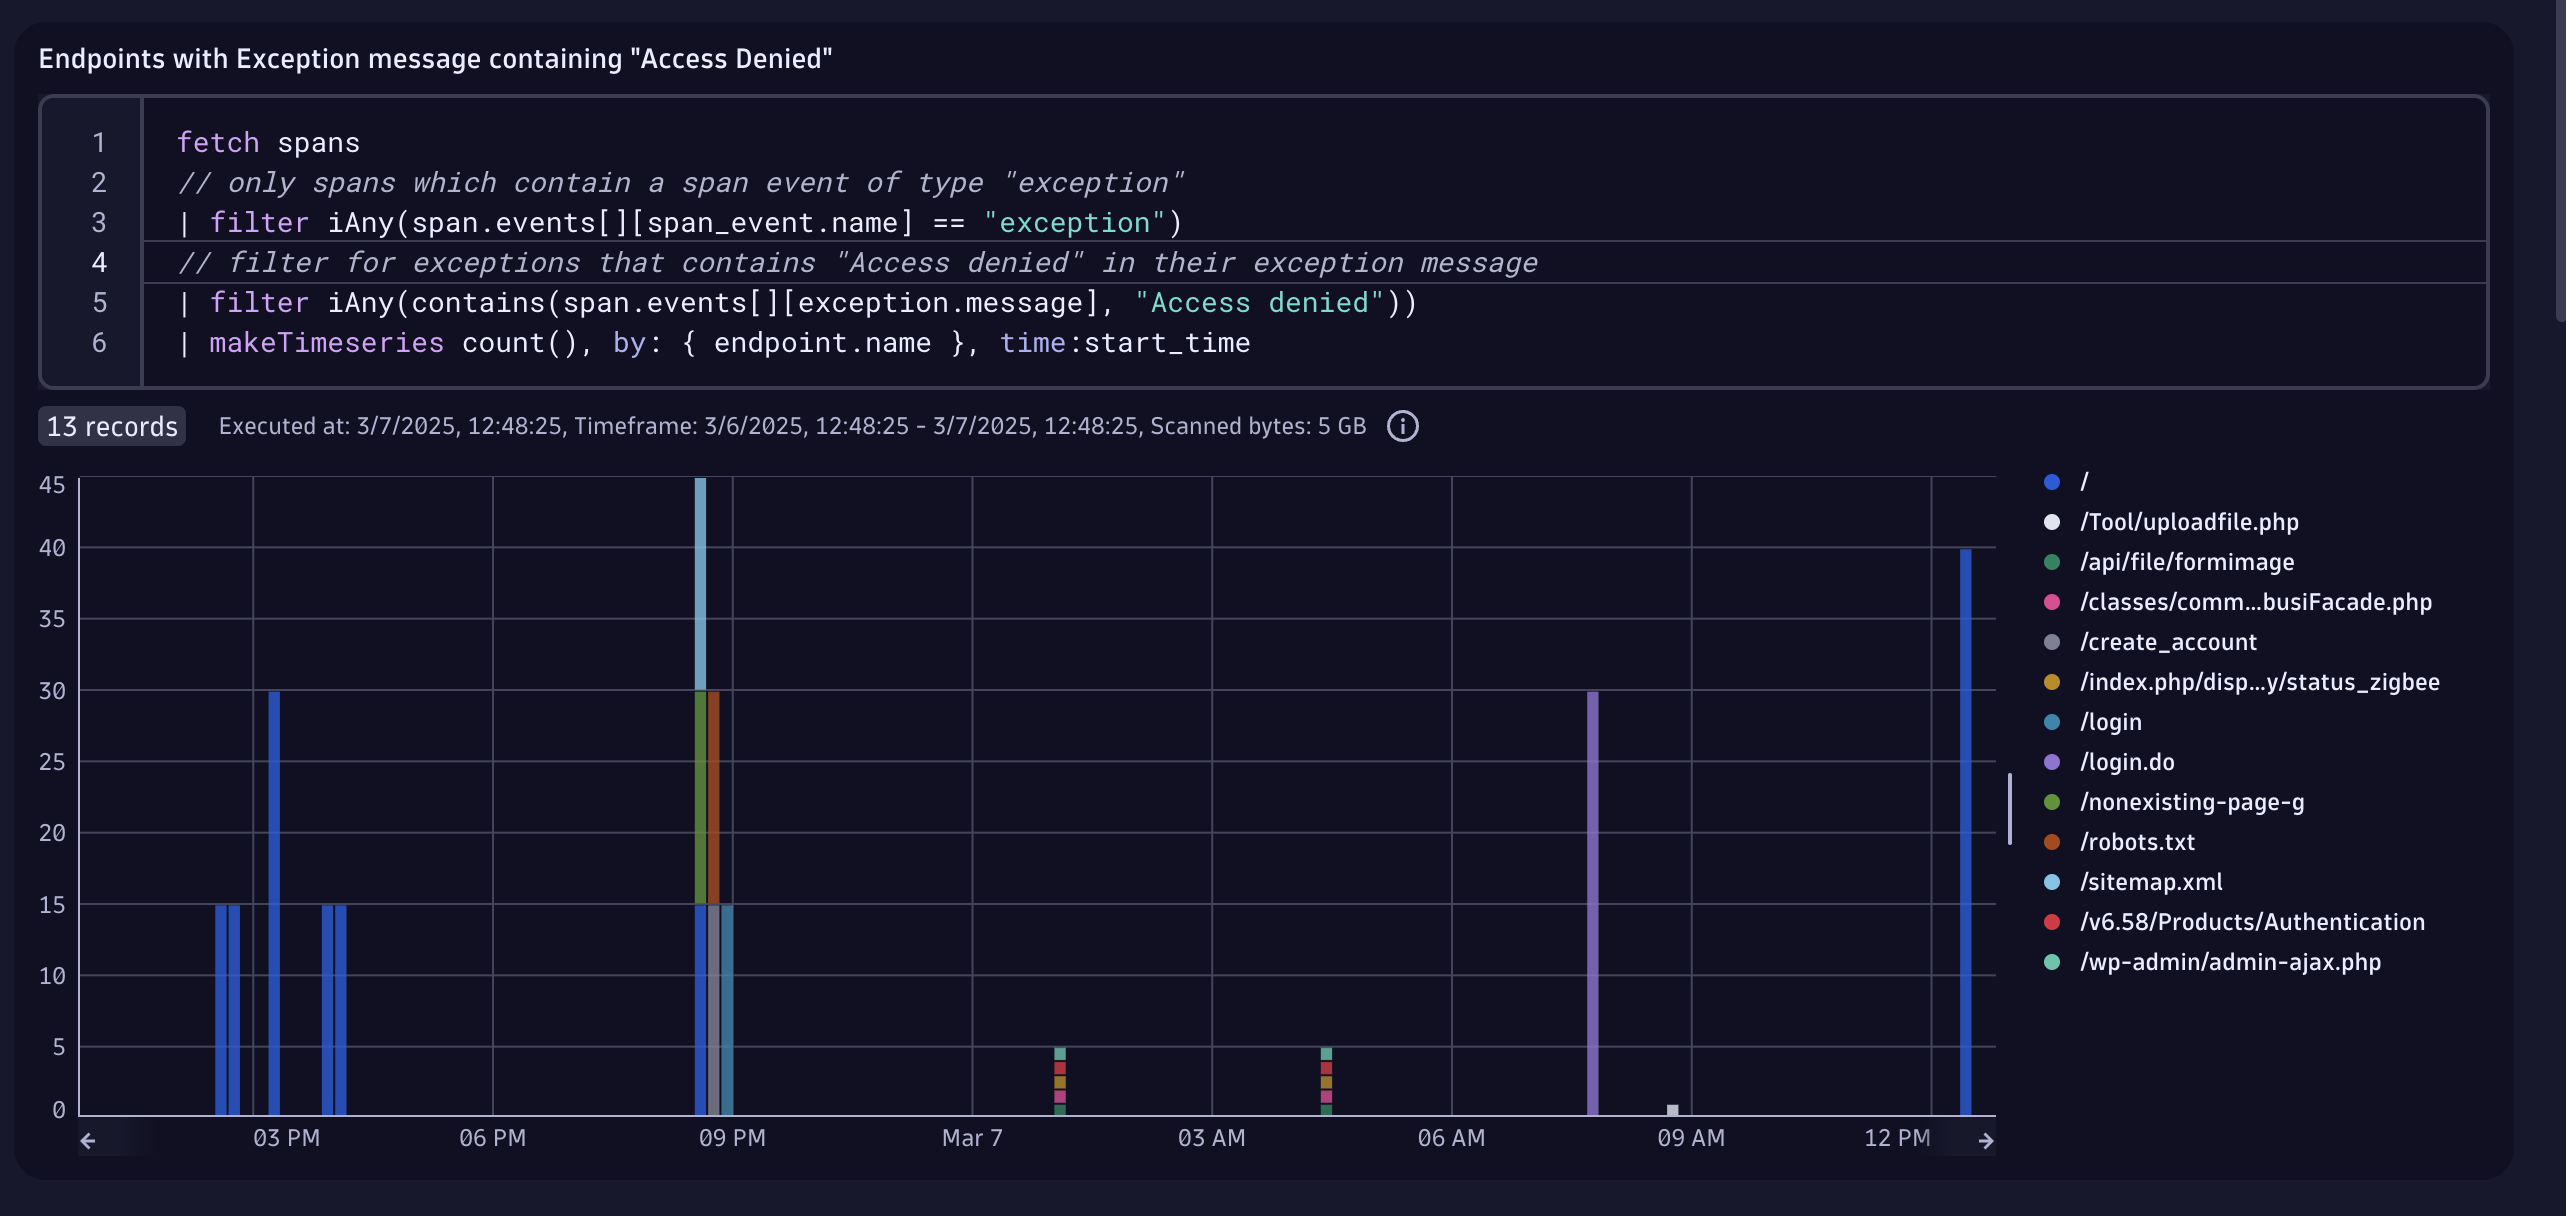
Understanding patterns, especially regarding exceptions, is no easy feat. However, you can begin unlocking additional insights using the Distributed Tracing app. For example, you can filter to understand endpoint performance where exception messages contain the string, access denied.
Once filtered, you can easily open a notebook with a pre-populated DQL query. You can then add additional details or modify the query as needed. Combine multiple findings in a notebook or dashboard to share your analysis with your team, allowing them to see these focused updates live in real time.
Achieve superior analytics
Transform trace data into intelligent insights by combining trace data with logs, metrics, and events. This combination allows you to enrich all data and get details in context. Use this intelligent data to see what matters to you most in real time by creating interactive dashboards and driving better decision-making. This gives you the power to break down silos, spark collaboration, and extract actionable insights with ease. It democratizes access to critical data, ensuring all teams can leverage the same reliable insights to drive impactful outcomes.
Example: Combine trace data with logs
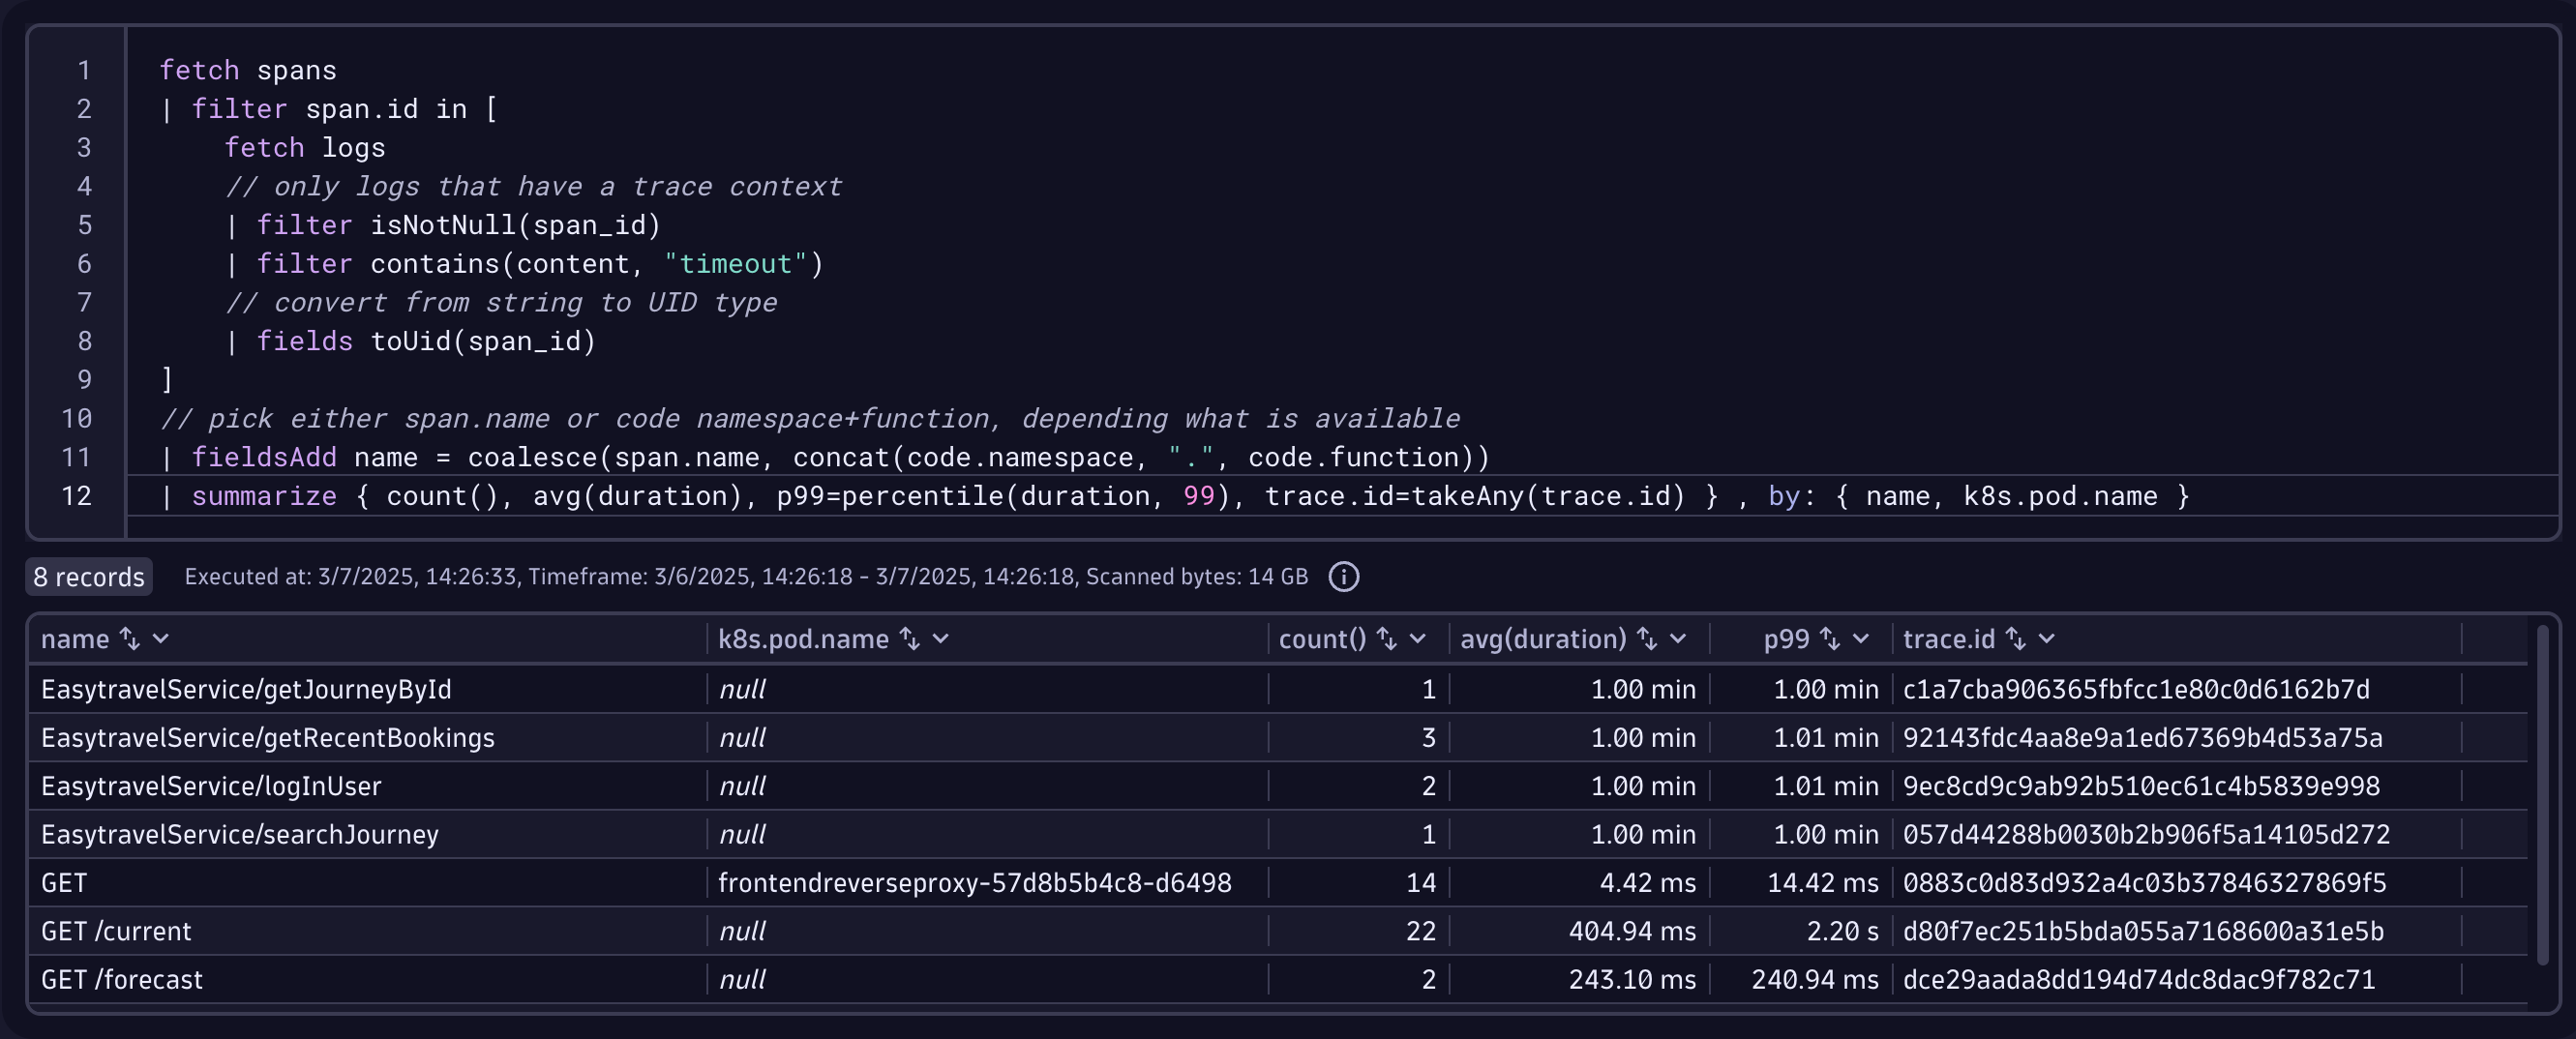
A common scenario is understanding which frontend API requests have log messages on the backend indicative of a specific problem. Let’s look at an example where the log message contains timeout, and we want to understand the response time of traces in the context of these messages.
By linking trace data with logs, you can query across spans and related log messages. You can also summarize with DQL to understand how often a specific pattern occurs. To visualize span duration, use p99 to see the slowest percentile of span response times and then navigate directly to the traces.
Automate with Dynatrace OpenPipeline
With Dynatrace, you can create custom metrics from trace data using Dynatrace OpenPipeline™, unlocking powerful new automation capabilities. It’s now possible to create metrics on OpenTelemetry and OneAgent spans with any available attribute, giving you the power to define operational, request, and method-level metrics.
OpenPipeline provides the flexibility to build metrics tailored to your specific needs, enabling you to integrate metrics seamlessly with advanced Dynatrace automation features, such as AutomationEngine and SRE Guardian. You can streamline workflows, intelligently automate repetitive tasks, proactively resolve issues, and spend more time innovating with automation, ensuring that only reliable, high-performing code reaches production.
We’ve only scratched the surface of scenarios where advanced analytics can make an impact—the possibilities are virtually endless. By combining advanced trace analysis, intuitive query capabilities, and seamless automation, your team can enable sharper analysis, streamline workflows, and foster innovation. This powerful approach ensures you can focus on delivering better outcomes with greater efficiency, empowering your organization to tackle complex issues with precision and agility, ultimately bringing unprecedented value.
Extended trace retention: Retain data longer when it matters
Need to analyze trends over the long term or adhere to compliance requirements? With extended trace retention, you can store trace data for up to 10 years. This feature ensures your organization is well-equipped for trend analysis and detailed post-mortem reviews—all while meeting regulatory requirements.
Retention policies are fully configurable in OpenPipeline. You can share data in buckets with varying retention times depending on the use case, allowing you to target specific applications or error-prone services for longer storage. This precision reduces storage costs while ensuring you retain the data that matters most.
Extended trace ingest
You can now customize trace ingestion rates to meet your specific needs. While most trace data is already ingested at high coverage rates, this option gives you more granular control over your trace volume. Ingest as much data as you want, above and beyond what is already included in your Dynatrace license.
Maximize the value of your OpenTelemetry data
At Dynatrace, we love OpenTelemetry. We champion open source innovation and recognize OpenTelemetry’s influence in setting observability standards (we’re also a top contributor). That’s why our advanced capabilities were designed from the ground up with OpenTelemetry at its core. We built our entire new tracing experience on OpenTelemetry semantic conventions and expanded from there. Now, OpenTelemetry users can troubleshoot and analyze while leveraging OTel standards. This commitment empowers you to simplify complexity and innovate faster by extracting maximum value from your data, regardless of origin.
Experience the future of Distributed Tracing
At Dynatrace, we believe that observability should be effortless and completely on your terms. With our latest advancements, we’re helping you manage complexity, innovate faster, and push boundaries. Our solution adapts seamlessly to your ecosystem, whether you use OpenTelemetry or run cloud-native or on-premises workloads. Built to handle enterprise scale, the Dynatrace platform processes massive volumes of data in real time while unifying insights across all teams in your organization.
We’re rolling out this functionality to existing Dynatrace Platform Subscription (DPS) customers. Elevate your observability journey with these new possibilities—tailored to your needs, your way.
If you’re not a DPS customer, you can try out the new Distributed Tracing experience with prepopulated data on the Dynatrace Playground.
If you’re new to Dynatrace and want to try out the new Distributed Tracing experience with your own data, check out our free trial
Take the leap today and discover how Dynatrace can revolutionize your approach to observability.


Looking for answers?
Start a new discussion or ask for help in our Q&A forum.
Go to forum