























Skip to technology filters Skip to main content
Dynatrace Hub

Extend the platform,
empower your team.

Popular searches:
Home hero bg
Check Point FirewallCheck Point Firewall
Check Point Firewall

Check Point Firewall

Gain insights into the performance of your Check Point Firewall devices.

Extension
Free trialDocumentation
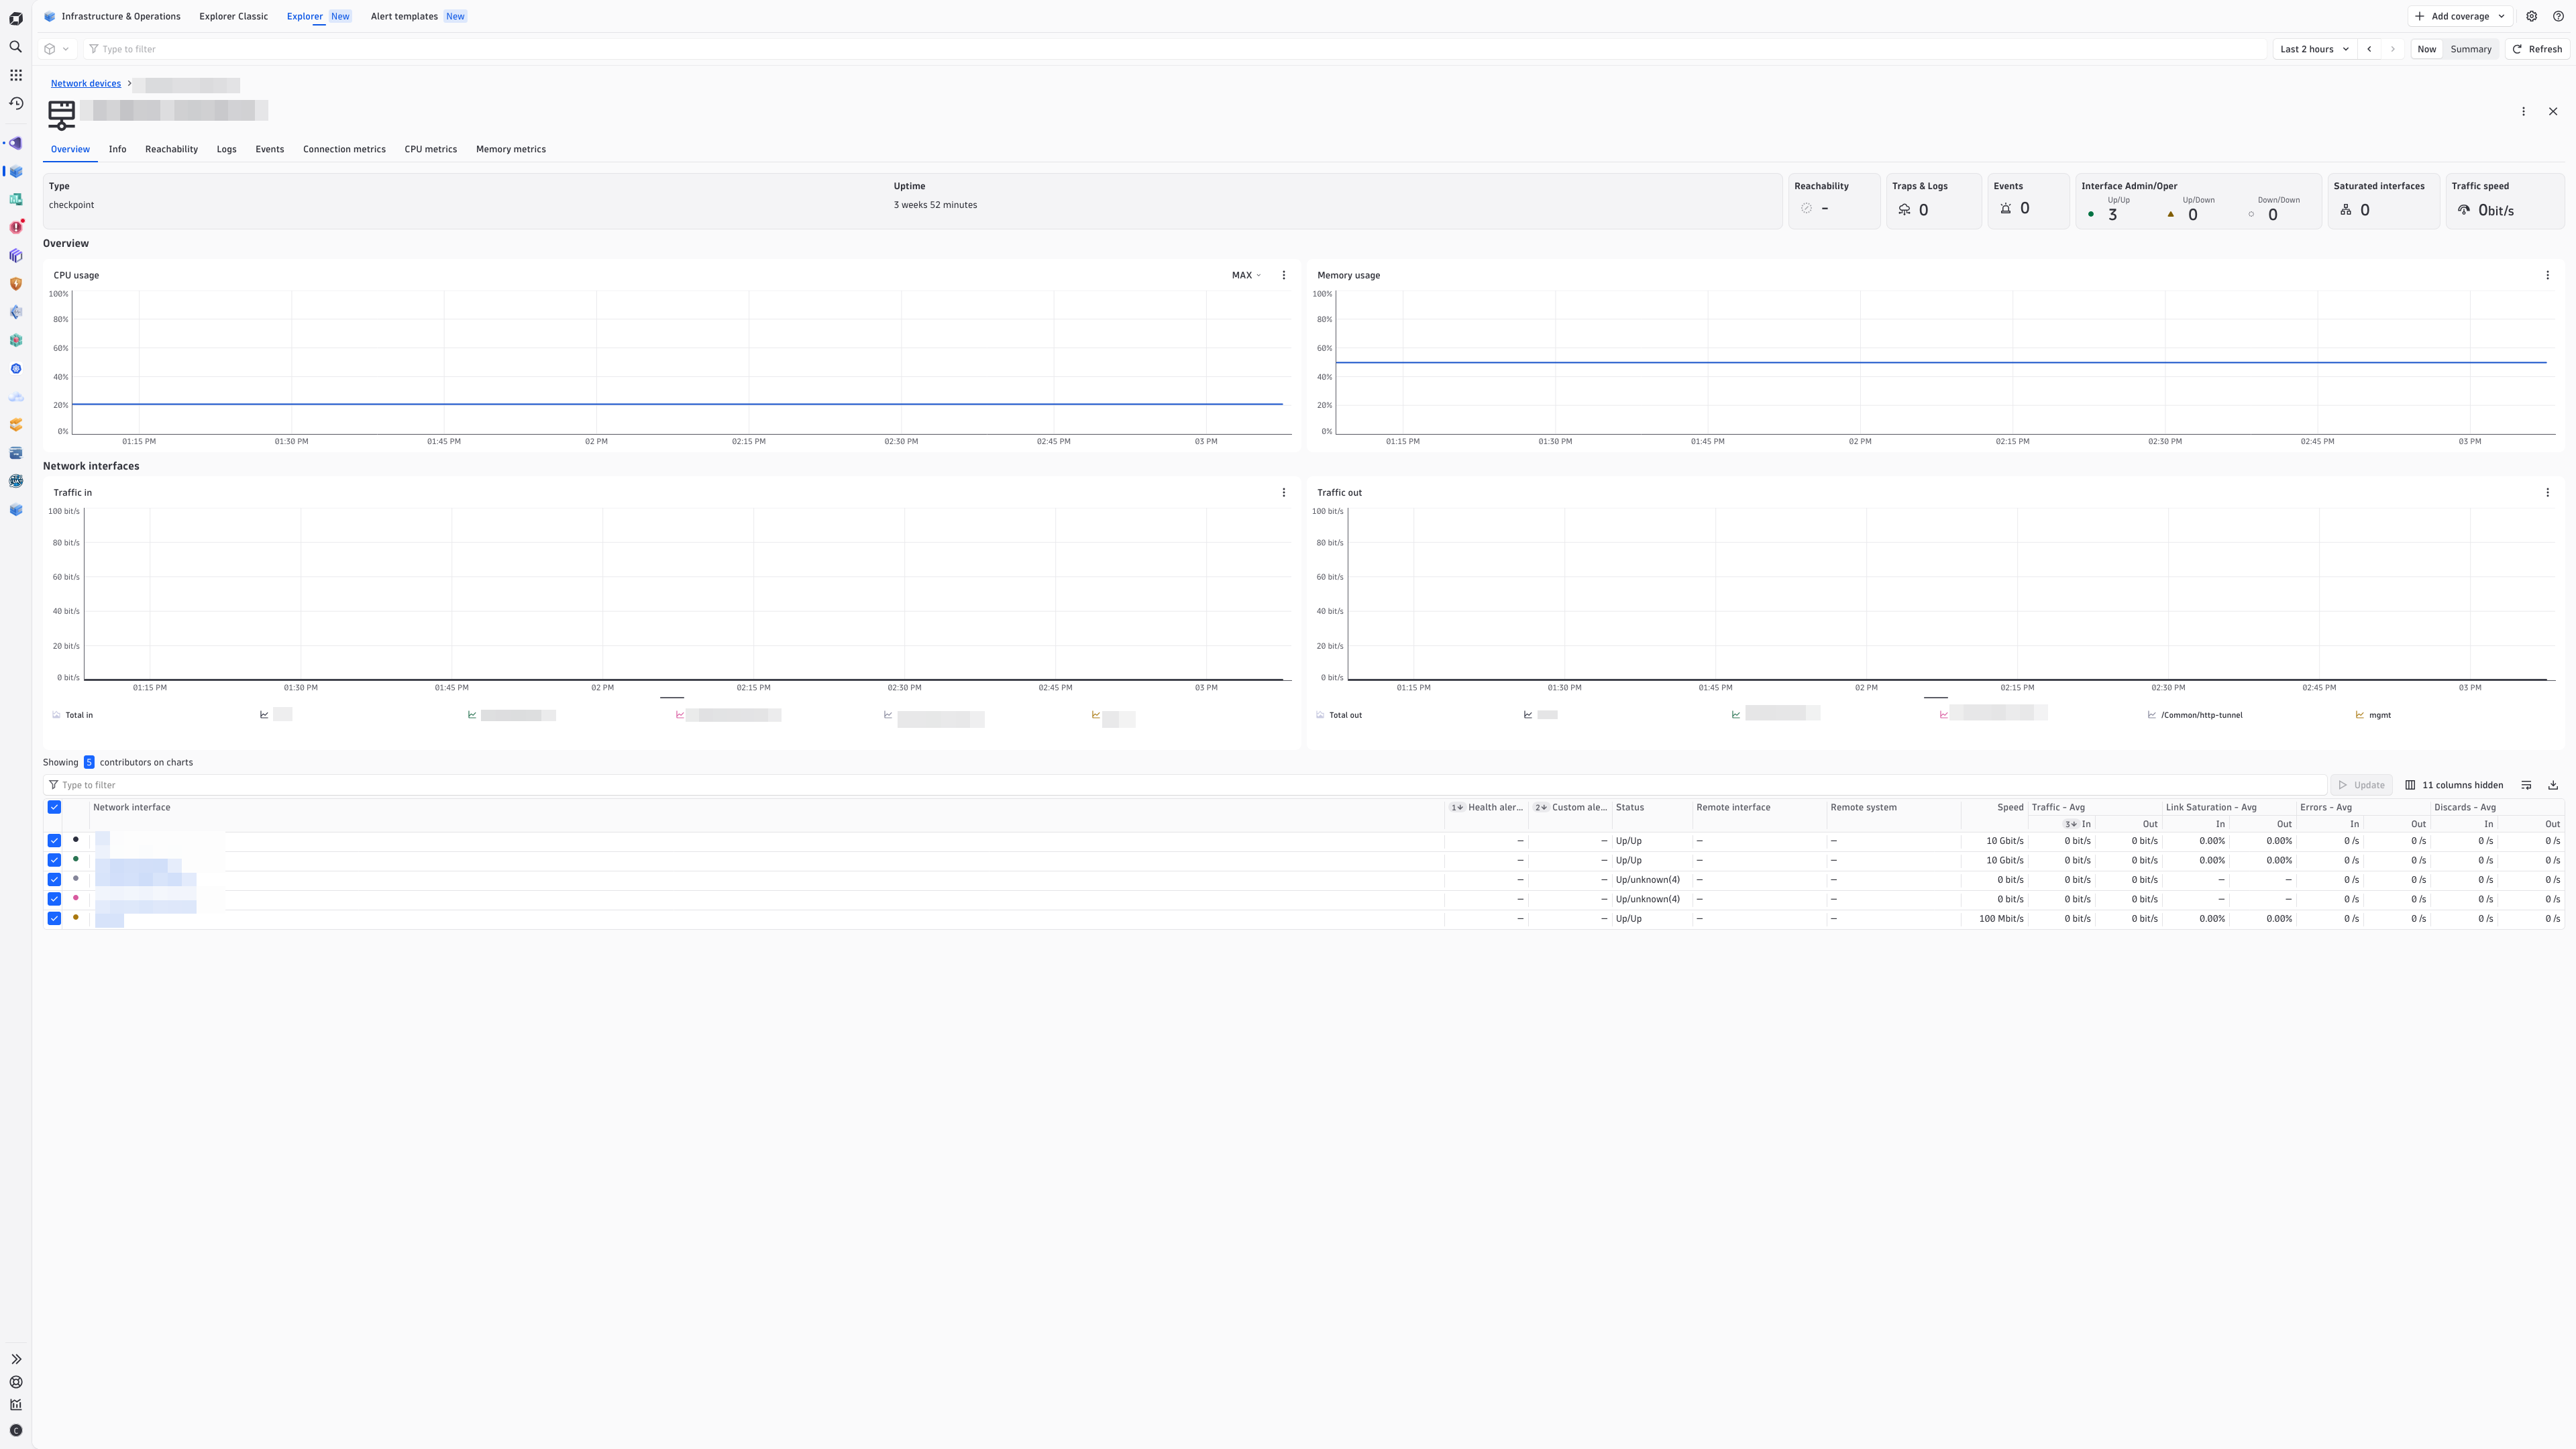
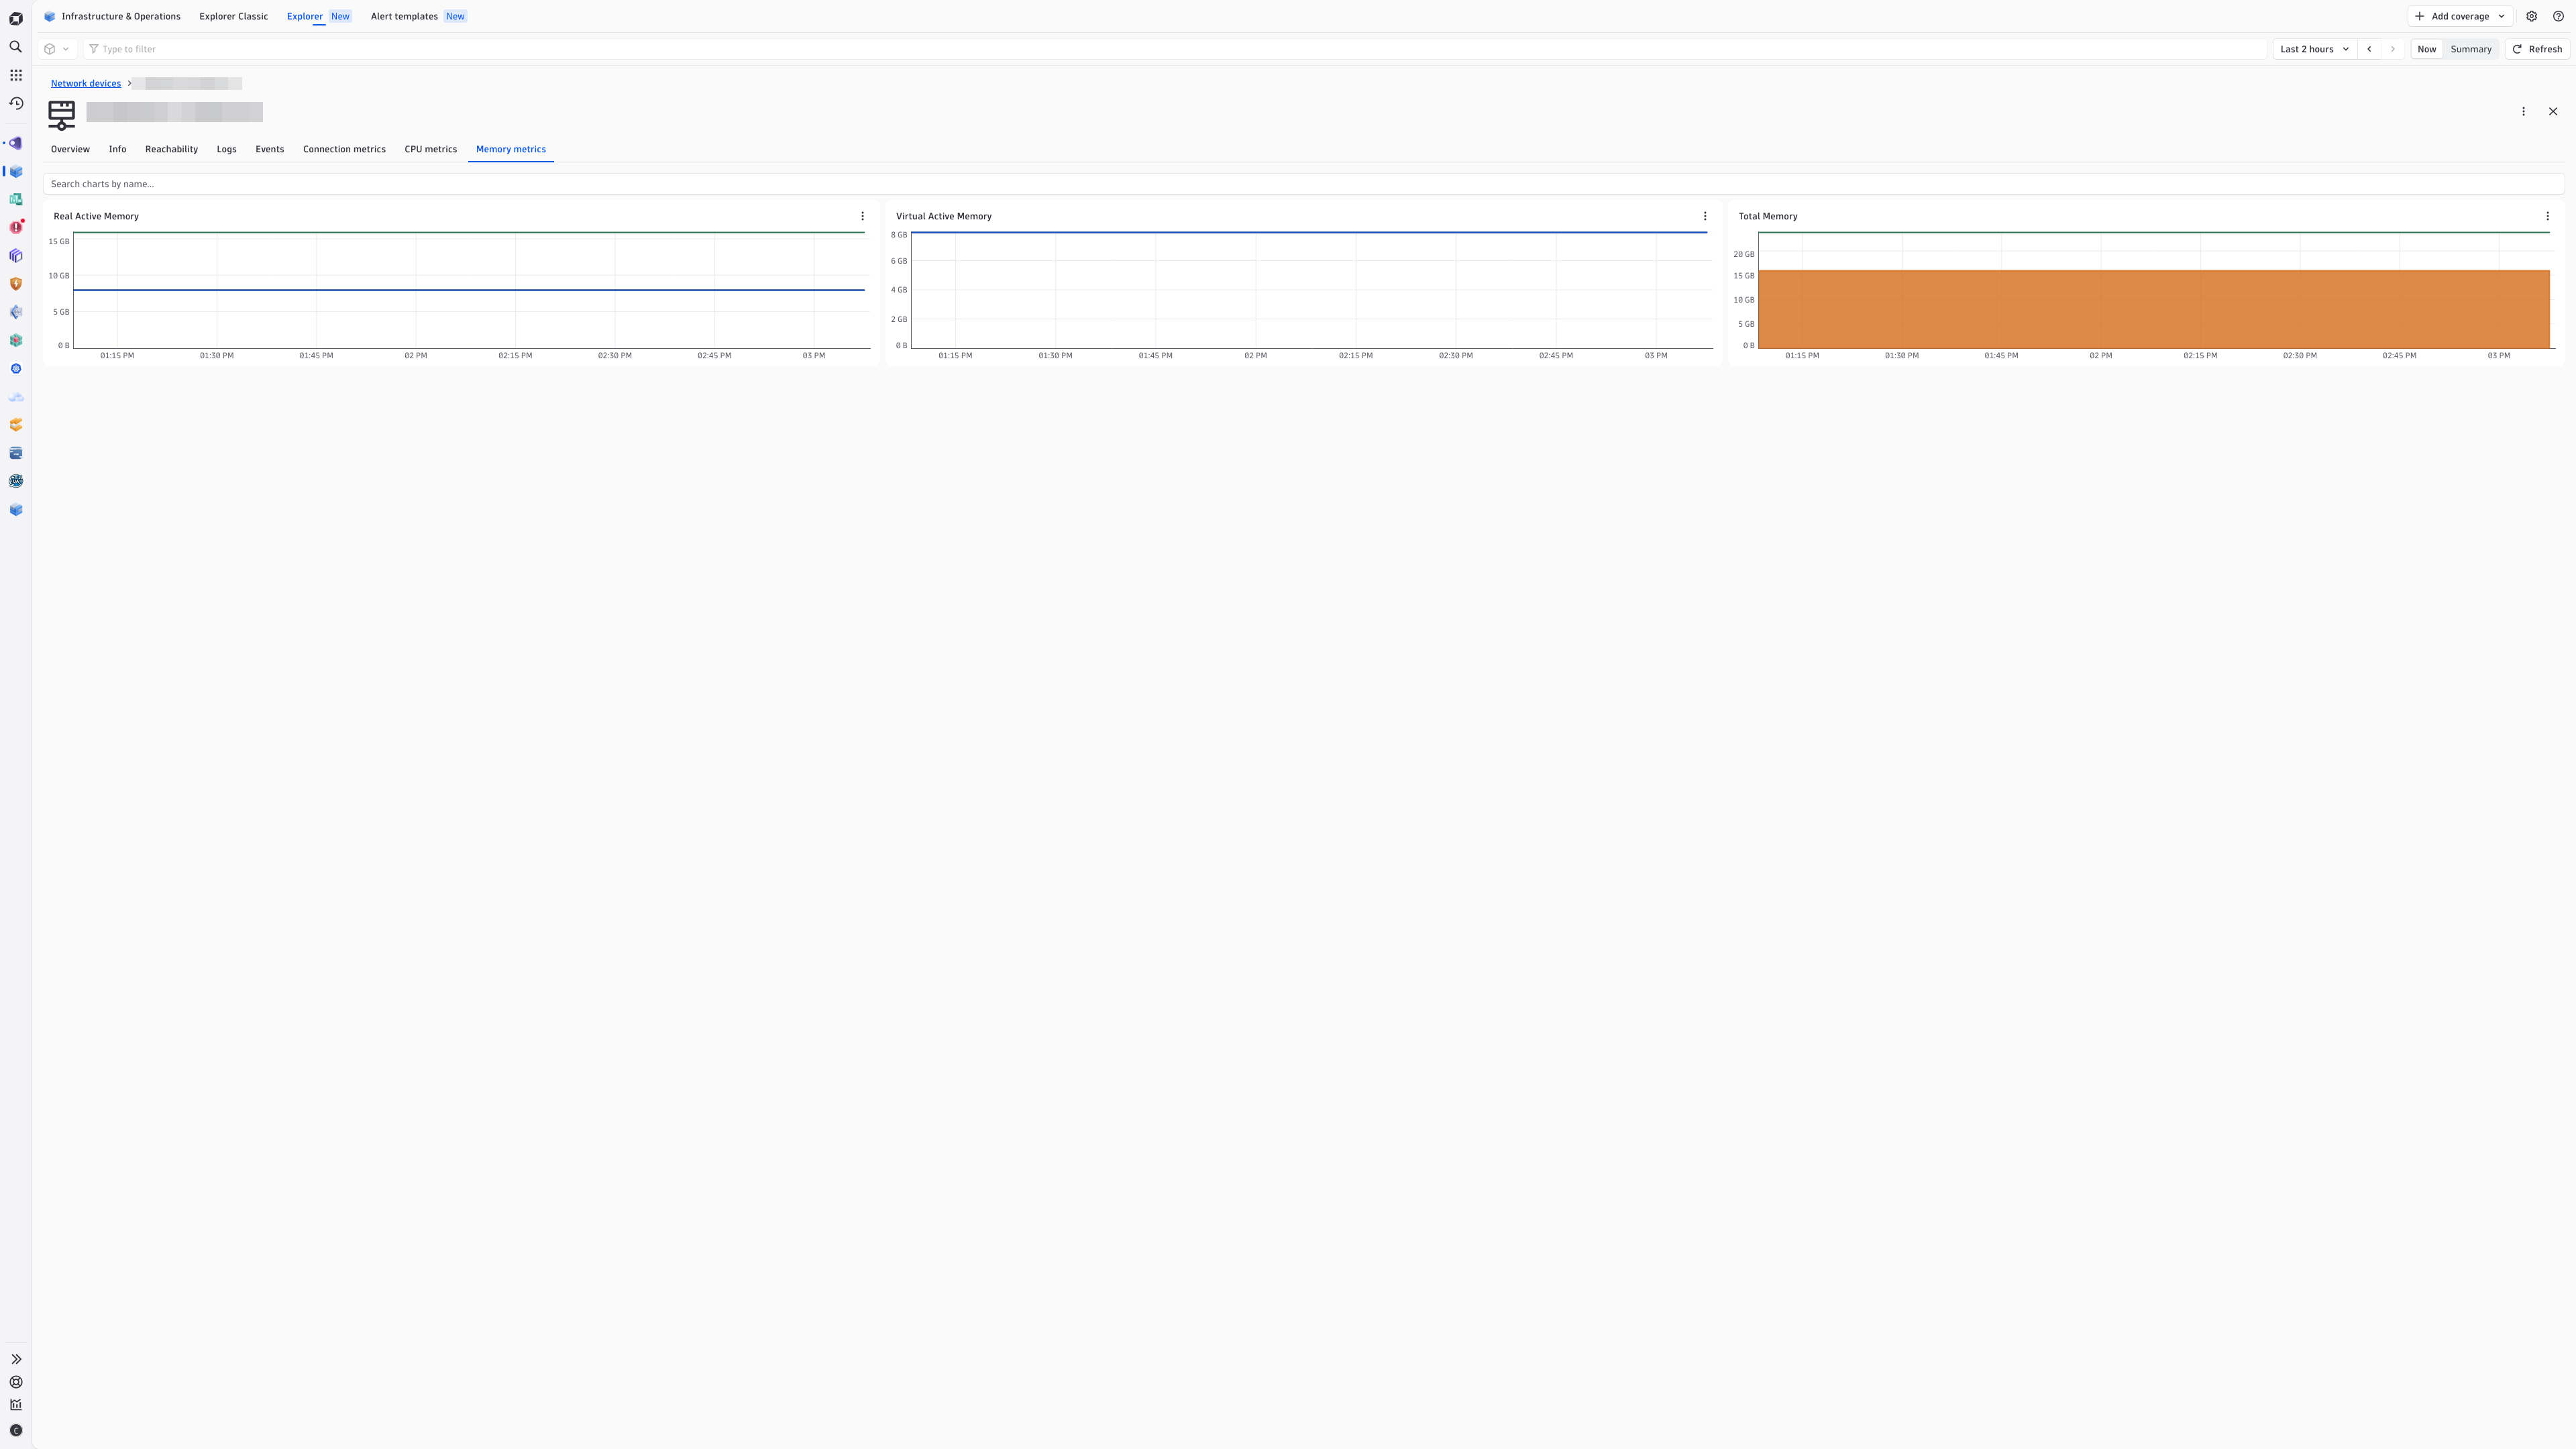
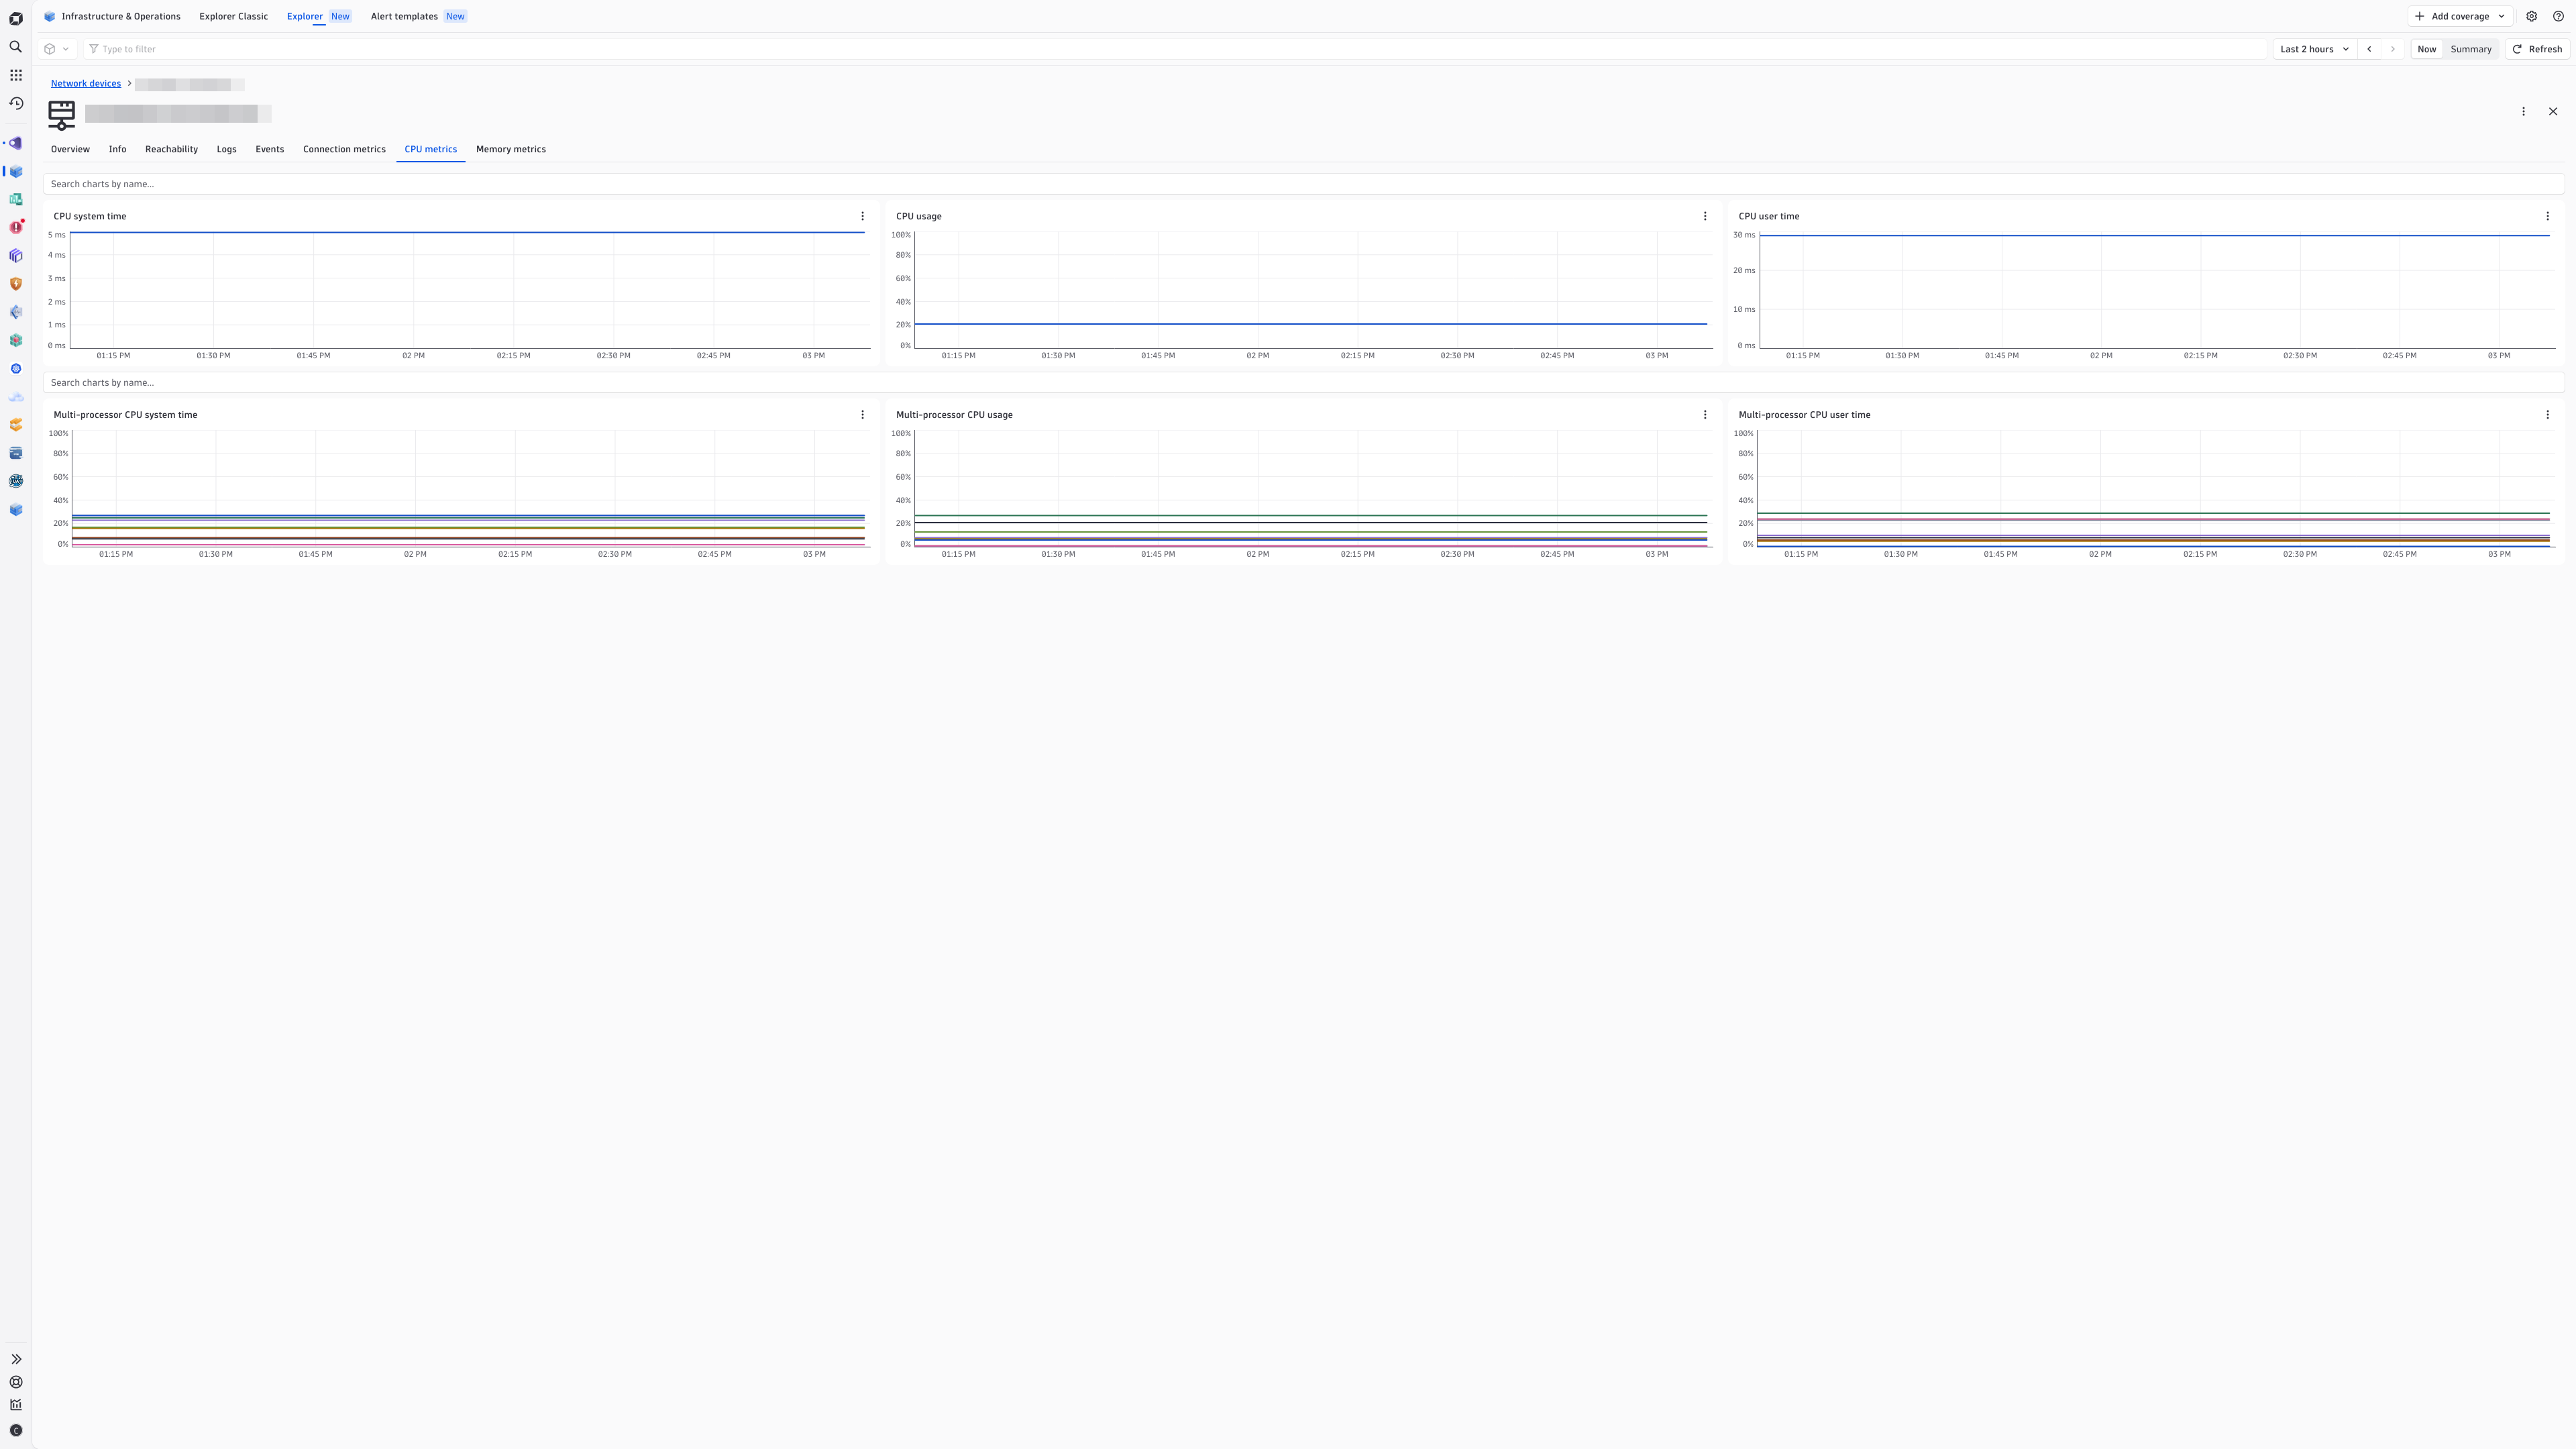
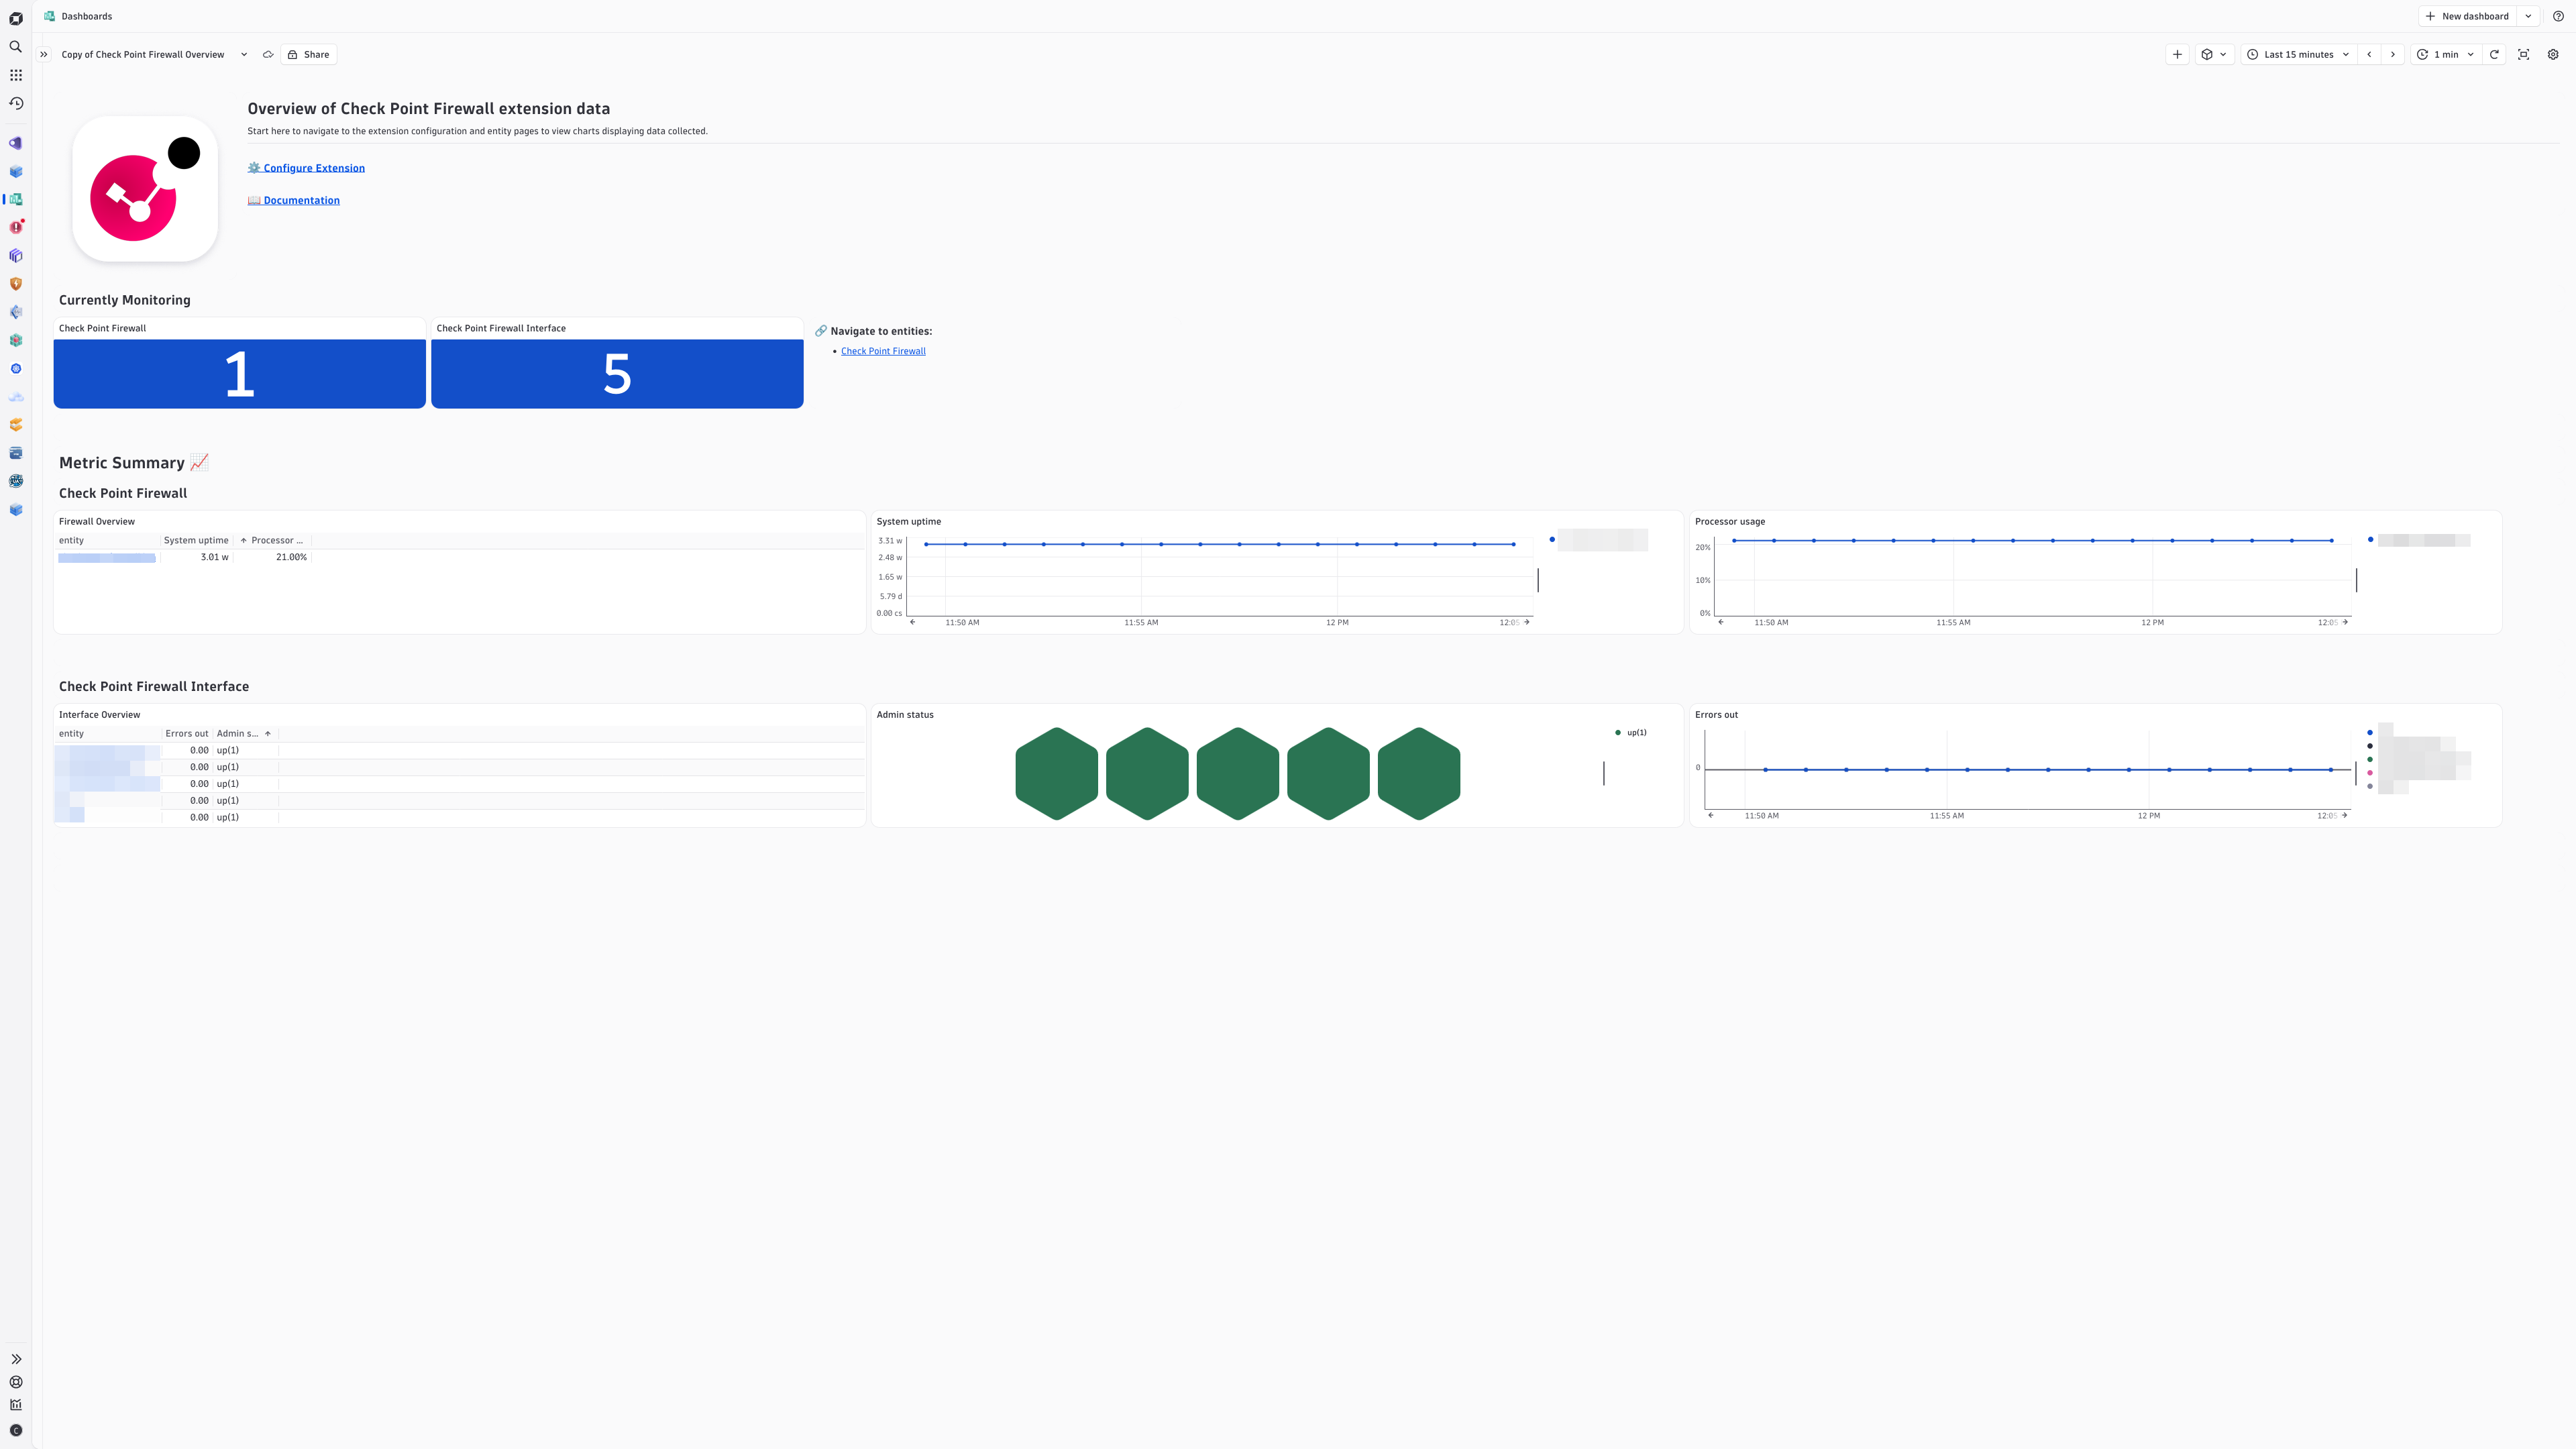
A New Overview Dashboard is included for Check Point Firewalls and their interfaces, giving you an overview of the monitoring coverage. Use this as a starting point for troubleshooting and further drilldowns into your Check Point Firewall data.Analyze key Check Point device information in the Infrastructure and Operations app.Included Unified Analysis Screens give an overview of device specific Check Point metrics, bundled with the extension.An Classic Overview Dashboard is included for Check Point Firewalls and their interfaces, giving you an overview of the monitoring coverage. Use this as a starting point for troubleshooting and further drilldowns into your Check Point Firewall data.
  • Product information
  • Release notes

Overview

This extension leverages the SNMP protocol to provide a complete solution to monitor Check Point Firewall Devices. The complete configuration is provided out-of-the-box.

This is intended for users, who:

  • Would like to monitor health state and performance of their Check Point Firewall devices and provide unified analysis for Ops, DevOps and IT Admins.

This enables you to:

  • Monitor health and performance of your Check Point Firewall devices
  • Use an included alert configuration to be alerted if a monitored interface goes into a 'down' state.
  • Set up alerts to be notified by traffic anomalies

Use cases

  • Monitor Check Point Firewall devices by polling data for Network Devices and Interfaces.
  • Enable alerting on detected anomalies
  • Use with the Infrastructure and Operations App for an overview of all monitored Network Devices in the environment.

Get started

For more information on the installation and configuration, please see Check Point Firewall extension in the Dynatrace Documentation.

Details

Compatibility information

  • This extension is to be used with Check Point Firewalls only.
  • SNMPv2c and SNMPv3 supported only.
Dynatrace
DocumentationMore Information
By Dynatrace
Dynatrace support center
Subscribe to new releases
Copy to clipboard

Feature sets

Below is a complete list of the feature sets provided in this version. To ensure a good fit for your needs, individual feature sets can be activated and deactivated by your administrator during configuration.

Feature setsNumber of metrics included
Metric nameMetric keyDescriptionUnit
-com.dynatrace.extension.network_device.sysuptime--
-com.dynatrace.extension.network_device.cpu_usage--
-com.dynatrace.extension.network_device.memory_used--
-com.dynatrace.extension.network_device.memory_free--
-com.dynatrace.extension.network_device.if.status--
Metric nameMetric keyDescriptionUnit
Physical component statecheckpoint.firewall.component.stateA state metric representing the details of physical components. This is used to collect details about the device stack. Value is always 1; use the dimensions to view details.NotApplicable
Metric nameMetric keyDescriptionUnit
-com.dynatrace.extension.network_device.if.bytes_in.count--
-com.dynatrace.extension.network_device.if.bytes_out.count--
-com.dynatrace.extension.network_device.if.lastchange--
Metric nameMetric keyDescriptionUnit
Device entity attributescheckpoint.firewall.entity_attributesConstant value of 1 used for reporting entity attributes at a lower frequencyUnspecified
Metric nameMetric keyDescriptionUnit
-com.dynatrace.extension.network_device.if.in.errors.count--
-com.dynatrace.extension.network_device.if.in.discards.count--
-com.dynatrace.extension.network_device.if.out.errors.count--
-com.dynatrace.extension.network_device.if.out.discards.count--
-com.dynatrace.extension.network_device.if.in.multicast_pkts.count--
-com.dynatrace.extension.network_device.if.out.multicast_pkts.count--
-com.dynatrace.extension.network_device.if.in.broadcast_pkts.count--
-com.dynatrace.extension.network_device.if.out.broadcast_pkts.count--
-com.dynatrace.extension.network_device.if.in.ucast_pkts.count--
-com.dynatrace.extension.network_device.if.out.ucast_pkts.count--
Metric nameMetric keyDescriptionUnit
Bytes incheckpoint.firewall.if.bytes.in.countNumber of octets received on the interfaceByte
Packets incheckpoint.firewall.if.packets.in.countNumber of packets received on the interfaceCount
Bytes outcheckpoint.firewall.if.bytes.out.countNumber of octets sent on the interfaceByte
Packets outcheckpoint.firewall.if.packets.out.countNumber of packets sent on the interfaceCount
Errors incheckpoint.firewall.if.errors.in.countNumber of packets with errors received on the interfaceCount
Errors outcheckpoint.firewall.if.errors.out.countNumber of packets with errors sent on the interfaceCount
Oper statuscheckpoint.firewall.if.status.operCurrent operational stateState
Admin statuscheckpoint.firewall.if.status.adminDesired state of interfaceState
Speedcheckpoint.firewall.if.speedEstimate of interface's current bandwidthBitPerSecond
Metric nameMetric keyDescriptionUnit
Disk percentcheckpoint.firewall.disk.percentPercent of free spacePercent
Users connectedcheckpoint.firewall.users.connectedNumber of connected usersCount
Accepted packetscheckpoint.firewall.packets.accepted.countAccepted packetsCount
Dropped packetscheckpoint.firewall.packets.dropped.countDropped packetsCount
Logged packetscheckpoint.firewall.packets.logged.countLogged packetsCount
Rejected packetscheckpoint.firewall.packets.rejected.countRejected packetsCount
Number of connectionscheckpoint.firewall.connectionsNumber of connectionsCount
Peak number of connectionscheckpoint.firewall.connections.peakPeak number of connectionsCount
Total virtual memorycheckpoint.firewall.memory.total.virtualTotal virtual memoryByte
Active virtual memorycheckpoint.firewall.memory.active.virtualActive virtual memoryByte
Total real memorycheckpoint.firewall.memory.total.realTotal real memoryByte
Active real memorycheckpoint.firewall.memory.active.realActive real memoryByte
Free real memorycheckpoint.firewall.memory.free.realFree real memoryByte
Processor system timecheckpoint.firewall.cpu.time.systemProcessor system timeMilliSecond
Processor usagecheckpoint.firewall.cpu.usageProcessor usagePercent
Processor user timecheckpoint.firewall.cpu.time.userProcessor user timeMilliSecond
System uptimecheckpoint.firewall.sysuptimeThe system up time since boot, in system ticks (hundredths of a second)Count

Full version history

To have more information on how to install the downloaded package, please follow the instructions on this page.
ReleaseDate

Full version history

Fixed in this version:

Decreased minEECVersion (ActiveGate) from 1.338.0 to 1.333.0.

Full version history

New in this version:

  • Added snmp.ip field to EXT_NETWORK_DEVICE node extraction in OpenPipeline.

Full version history

WARNING: Possible breaking changes and warnings - PLEASE READ before upgrading:

  • This version requires a minimum Dynatrace version of 1.338.0 and a minimum EEC (ActiveGate) version of 1.338.0.
  • This version includes a breaking change for Dynatrace on Grail.
    • You must opt-in to OpenPipeline configuration via Settings API – see the documentation.

New in this version:

  • Smartscape 2.0 nodes and edges on Grail.

  • Added feature set metadata for recommended metrics.

    • IMPORTANT: This version contains a change to feature sets that may require enabling a new feature set to continue collecting existing data. Review feature sets after upgrading the extension version.
      • The default featureset has been aligned with other network extensions that provide com.dynatrace.extension.network_device.* metrics for generic network topology.
      • This means that extension specific metrics (checkpoint.firewall.*) have been moved to other featuresets.
  • Added default value to if_admin_status filter variable. By default, this will only monitor interfaces with admin.status dimension value of up(1).

  • Added two new memory-related metrics, and visualizations for these metrics to provide a complete view of total memory usage for a Check Point device.

    • checkpoint.firewall.memory.total.virtual (1.3.6.1.4.1.2620.1.6.7.4.1.0)
    • checkpoint.firewall.memory.total.real (1.3.6.1.4.1.2620.1.6.7.4.3.0)
  • Added if.count and sys.services dimensions to the com.dynatrace.extension.network_device.sysuptime metric.

Fixed in this version:

  • sys.name is collected with all checkpoint.firewall.* metrics. This addresses an issue where some dt.entity.checkpoint:firewall screens were appearing empty. This also addreses an issue with the bundled Classic Dashboard.

Full version history

Bugfixes

  • Adjusted markdown link in Platform Dashboard to point to the Network devices section in the I&O app.
  • Adjusted DQL tiles in Platform Dashboard to point to the I&O app.

Full version history

Enhancements

  • Updated entity links in Platform dashboards to redirect to the Infrastructure & Operations app.

Bugfixes

  • Adjusted required dimensions for entity creation to prevent null entities from being created.

Full version history

Fixed in this version:

  • sys.name and mac.address dimensions are required on all network metrics and filtered for empty values. This caused unnecessary stress on topology engine.

  • Updated source rule for checkpoint:firewall to use checkpoint.firewall.entity_attributes for consistent entity naming.

Full version history

✨ New in this version (1.1.0):

  • Added the following new metrics to the Advanced interfaces feature set:
    • com.dynatrace.extension.network_device.if.in.multicast_pkts.count
    • com.dynatrace.extension.network_device.if.out.multicast_pkts.count
    • com.dynatrace.extension.network_device.if.in.broadcast_pkts.count
    • com.dynatrace.extension.network_device.if.out.broadcast_pkts.count
    • com.dynatrace.extension.network_device.if.in.ucast_pkts.count
    • com.dynatrace.extension.network_device.if.out.ucast_pkts.count
    • com.dynatrace.extension.network_device.if.lastchange
  • Added the following new metrics to the default feature set:
    • com.dynatrace.extension.network_device.if.in.errors.count
    • com.dynatrace.extension.network_device.if.in.discards.count
    • com.dynatrace.extension.network_device.if.out.errors.count
    • com.dynatrace.extension.network_device.if.out.discards.count

⚙️ Changed in this version:

  • Moved the metric checkpoint.firewall.entity_attributes to a new Entity attributes feature set.
  • Moved the metric checkpoint.firewall.component.state to a new Stack info feature set.
❗ IMPORTANT:

Make sure to toggle these new feature sets on in your configurations if you are using those metrics and properties, as they are no longer captured by default.

Full version history

⚠️ Note:

  • This release requires a Minimum Dynatrace Version and Minimum ActiveGate version of 1.318.0 or higher.

New in this version:

  • Internal metadata updated.

Full version history

Improved in this version:

  • Replaced checkpoint.firewall.memory.active.real and checkpoint.firewall.memory.active.virtual metric values with 64-bit OID alternatives.
    • com.dynatrace.extension.network_device.memory_used and com.dynatrace.extension.network_device.memory_freenow use 64-bit OIDs as well.
  • Changing the Unit on Memory metrics from KiloBytes to Bytes.

New in this version:

  • Added new metric for free real memory (checkpoint.firewall.memory.free.real).

Full version history

Improved in this version:

  • Use the same OIDs for if.name dimension across the Generic Network Interface and Check Point Interface metrics.

Full version history

New in this version

  • Added screens for latest Dynatrace.

Improved in this version

  • Refined New Dashboard.

Full version history

⚠️ IMPORTANT CHANGE:

Metrics in "default" feature set will always be enabled and cannot be disabled. These metrics are mandatory. Take extra caution configuring devices and interfaces for which you are collecting data. Make use of Interface filters to limit the number of interfaces, otherwise, all interfaces on the device will be collected by default. In case you do not wish to collect interfaces on your device, enter $eq(!) in the "Interface Name" filter field on the Feature Sets screen during configuration.


  • Default network metrics moved into the "default" feature set, specifically interface metrics.

⚠️ Special note when updating to this version:

  • You must disable the old "neighbor-discovery" feature set in order to update to this version.
  • Please review the metrics included with the default feature set and ensure it aligns with your previous monitoring footprint (default metrics are always enabled).

Improved in this version:

  • The "neighbor-discovery" feature set was removed. This is now handled by the SNMP Auto-discovery extension for any kind of device.

New in this version:

  • Security Context is applied to entities.

Full version history

  • Initial Release
    • Requires Dynatrace Tenant Version >= 1.309
    • Requires ActiveGate Version >= 1.291
Dynatrace Hub
Hub HomeGet data into DynatraceBuild your own app
Dynatrace Intelligence - Agentic Operations SystemThe Dynatrace Agentic AI ecosystem
Log Management and AnalyticsKubernetesAI and LLM ObservabilityInfrastructure ObservabilitySoftware DeliveryApplication ObservabilityApplication SecurityBusiness ObservabilityDigital Experience
Filter
Type
Built and maintained by
Deployment model
SaaS
  • SaaS
  • Managed
Partner FinderBecome a partnerDynatrace Developer

All

221 Results filtered by:

Akamai logo

Akamai

Ingest logs and security events from Akamai products.

Extension
Alibaba Cloud logo

Alibaba Cloud

Automatically discover, baseline, and monitor Alicloud environment components.

Extension
Anypoint MQ logo

Anypoint MQ

Gather metrics about your Anypoint MQ Queues.

Extension
Apache ActiveMQ Classic logo

Apache ActiveMQ Classic

Automatic and smart observability for ActiveMQ with trace and metric insights.

Extension
Apache Cassandra logo

Apache Cassandra

Improve Apache Cassandra observability.

Extension
Apache CouchDB logo

Apache CouchDB

Intelligently observe and optimize health and performance of your database.

Extension
Apache Kafka logo

Apache Kafka

Automatic and intelligent observability with trace and metric insights.

Extension
Apache Solr logo

Apache Solr

Open-source enterprise-search platform, written in Java.

Extension
Apache Spark logo

Apache Spark

Enhanced insights for Spark Components.

Extension
Apache Zookeeper logo

Apache Zookeeper

Monitor and analyze your Apache Zookeeper with this JMX-based extension.

Extension
Apigee logo

Apigee

Remotely monitor your Apigee proxies.

Extension
AWS Cloud Monitoring logo

AWS Cloud Monitoring

New and enhanced monitoring capabilities for your AWS cloud platforms.

Extension
AWS Entities for Metric Streaming logo

AWS Entities for Metric Streaming

Analyse metrics in the context of an entity based on AWS Metric Streaming.

Extension
Azure Cloud Monitoring logo

Azure Cloud Monitoring

New and enhanced monitoring capabilities for your Azure cloud platforms.

Extensioncoming soon
Azure Managed Apache Cassandra logo

Azure Managed Apache Cassandra

Gain insights into your Azure Managed Cassandra Instance health and performance.

Extension
Black Duck logo

Black Duck

Ingest Black Duck security events and audit logs.

Extension
Ceph storage logo

Ceph storage

Monitor usage of Ceph storage system at both client side and host level.

Extension
Checkmarx logo

Checkmarx

Ingest Checkmarx security events and audit logs.

Extension
Check Point Firewall logo

Check Point Firewall

Gain insights into the performance of your Check Point Firewall devices.

Extension
Cisco ACI/APIC logo

Cisco ACI/APIC

Get insights into your Cisco Application Centric Infrastructure (ACI).

Extension
Cisco Catalyst Center (DNA Center) logo

Cisco Catalyst Center (DNA Center)

Get insights into the Cisco Catalyst Center infrastructure (f.k.a. DNA Center).

Extension
Cisco Catalyst SD-WAN Manager (Viptela) logo

Cisco Catalyst SD-WAN Manager (Viptela)

Get insights into the Cisco SD-WAN performance through the vManage API.

Extension
Cisco Firepower logo

Cisco Firepower

Monitor Cisco Firepower devices using SNMP.

Extension
Cisco UCS C-Series logo

Cisco UCS C-Series

Get insights into your Cisco UCS C-Series devices.

Extension
Cisco UCS M-Series logo

Cisco UCS M-Series

Get insights into your Cisco UCS M-Series devices.

Extension
Citrix DaaS & Virtual Apps and Desktops logo

Citrix DaaS & Virtual Apps and Desktops

Gain insight into your Citrix DaaS & Virtual Apps and Desktops environments.

Extension
Citrix Netscaler ADC logo

Citrix Netscaler ADC

Remotely monitor your Citrix NetScaler devices.

Extension
Citrix NetScaler SDX logo

Citrix NetScaler SDX

Remotely monitor your Citrix NetScaler SDX devices.

Extension
Cloudflare (extension) logo

Cloudflare (extension)

Collect notification history and various metrics from your Cloudflare accounts.

Extension
Cloud Foundry logo

Cloud Foundry

Monitor your Cloud Foundry resource definitions by connecting to the foundation.

Extension
Confluent Cloud (Kafka) logo

Confluent Cloud (Kafka)

Remotely monitor your Confluent Cloud Kafka Clusters and other resources!.

Extension
Connection Pools: Apache Commons logo

Connection Pools: Apache Commons

Application method of pooling and sharing multiple connections to a database.

Extension
Connection Pools: C3P0 logo

Connection Pools: C3P0

Application server method of pooling and sharing connections to a database.

Extension
Connection Pools: JBoss logo

Connection Pools: JBoss

Application server method of pooling and sharing connections to a database.

Extension
Connection Pools: WebLogic logo

Connection Pools: WebLogic

Application server method of pooling and sharing connections to a database.

Extension
Connection Pools: WebSphere Liberty logo

Connection Pools: WebSphere Liberty

Application server method of pooling and sharing connections to a database.

Extension
Consul Service Mesh (StatsD) logo

Consul Service Mesh (StatsD)

Extend visibility into your Consul Service Mesh instances to monitor health and improve performance.

Extension
Control-M Jobs v2 logo

Control-M Jobs v2

Monitor your Control-M jobs execution status.

Extension
CoreDNS (2.0) logo

CoreDNS (2.0)

Collect important data from your CoreDNS processes.

Extension
Couchbase logo

Couchbase

Couchbase Capella (SaaS) database monitoring.

Extension
CPU Core Monitoring logo

CPU Core Monitoring

Get insights into CPU Core utilization on your OneAgent hosts.

Extension
CrowdStrike logo

CrowdStrike

Ingest CrowdStrike detection findings.

Extension
CyberArk logo

CyberArk

Ingest CyberArk audit logs via SIEM integration for reporting and analysis.

Extension
Databricks logo

Databricks

Monitor your Databricks Clusters via its multiple APIs!.

Extension
Databricks Workspace logo

Databricks Workspace

Remotely monitor your Databricks Workspaces!.

Extension
definity logo

definity

Monitor and optimize your Lakehouse, Spark, and Databricks pipelines.

Extension
Defunct Process Monitoring logo

Defunct Process Monitoring

Monitoring defunct processes stuck on your linux servers.

Extension
Dell EMC Isilon - PowerScale logo

Dell EMC Isilon - PowerScale

Monitor your Dell EMC Isilon / Powerscale clusters through the OneFS API.

Extension
Dell EMC PowerMax logo

Dell EMC PowerMax

Monitor PowerMax Arrays for performance and health, with Dell Unisphere API.

Extension
Dell iDRAC logo

Dell iDRAC

Connect to the Redfish API to get insights into your Dell iDRAC environment.

Extension