
With the new Dynatrace SNMP extensions, it's now possible to monitor all relevant network devices. The extensions provide everything necessary to start monitoring out of the box. Leveraging the SNMP protocol, Dynatrace provides a comprehensive observability package with ready-to-use dashboards, visualizations, alerts, device metrics, and unified analysis in one place.
The success of an organization often depends on the quality of the on-premises or physical IT infrastructure, among other things. Constantly monitoring infrastructure health state and making ongoing optimizations are essential for Ops teams, SREs (site-reliability engineers), and IT admins.
With newly released SNMP extensions (Generic network device and Generic Cisco device, Juniper Networks (SNMP), and F5 BIG-IP LTM, Dynatrace now enables full observability and monitoring for all network devices such as Cisco routers, Palo Alto Networks firewalls, or F5 load balancers by combining all necessary data in a standardized form on a single platform for unified analysis.
Quick and easy network infrastructure monitoring
Tired of constantly switching between all your monitoring tools? Would you like to access all your monitoring data on a single platform? Dynatrace has you covered—Dynatrace extensions collect the necessary data and offer improved visibility wherever you need a single platform for IM and APM purposes. All of this convenient visibility is available with just a few clicks.
Start monitoring in minutes
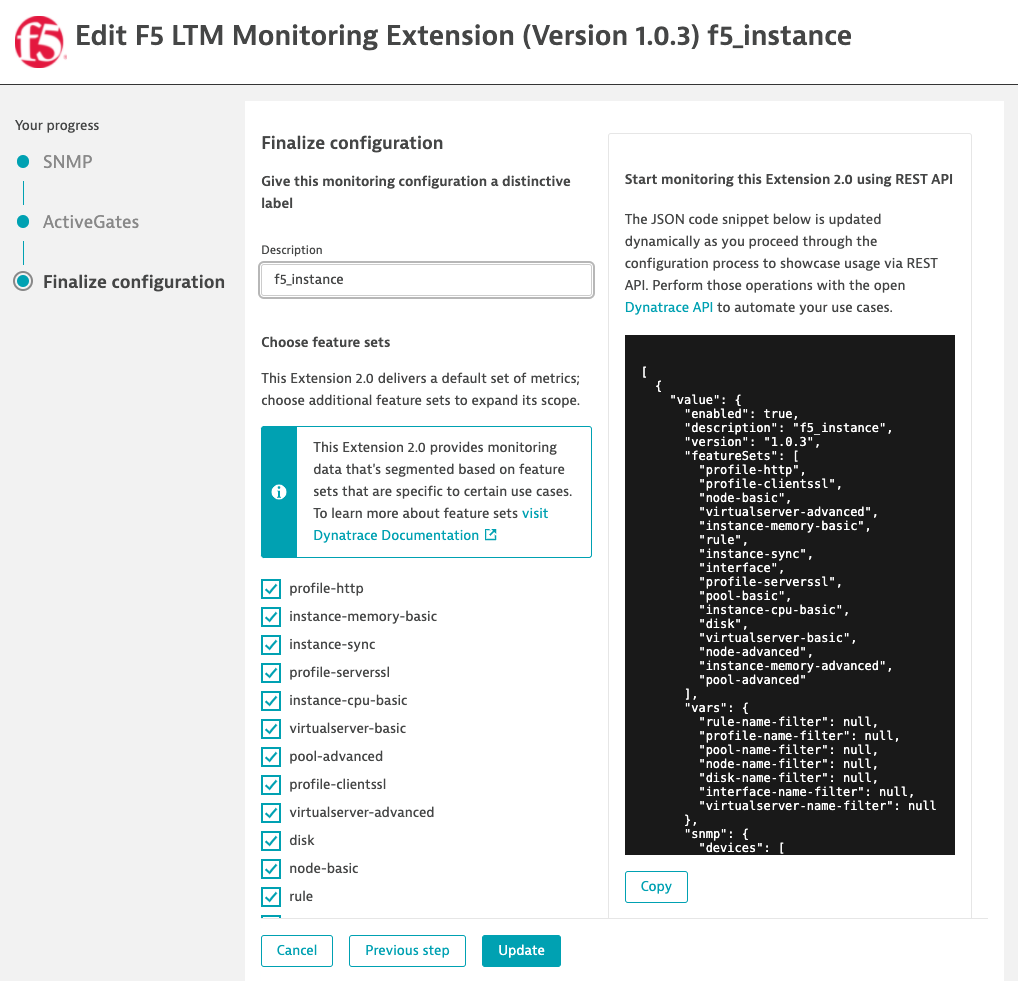
Begin network monitoring by simply deploying an extension with just a few clicks. As with other extensions based on the new Dynatrace Extensions 2.0 framework, the SNMP extensions are a bundle of everything that’s needed (DataSource configuration, a dashboard template, a unified analysis page template, topology definition, entity extraction rules, relevant metric definitions and more) to get going with monitoring.
Accelerated troubleshooting with topology awareness
The new SNMP extensions come with topological awareness as part of the packaged capabilities. The topology model for network devices covers simple to complex use cases from visualizing the interfaces of a router to mapping an F5 Big-IP LTM load balancer.
Problem analysis based on topology enables the Dynatrace Davis AI to explore all discovered relationships when searching for the root cause of problems. This helps significantly in automatically answering complex questions such as “Is the CPU saturation of my F5 device caused by any of the virtual servers running on it? And is that because of a spike in total requests?”
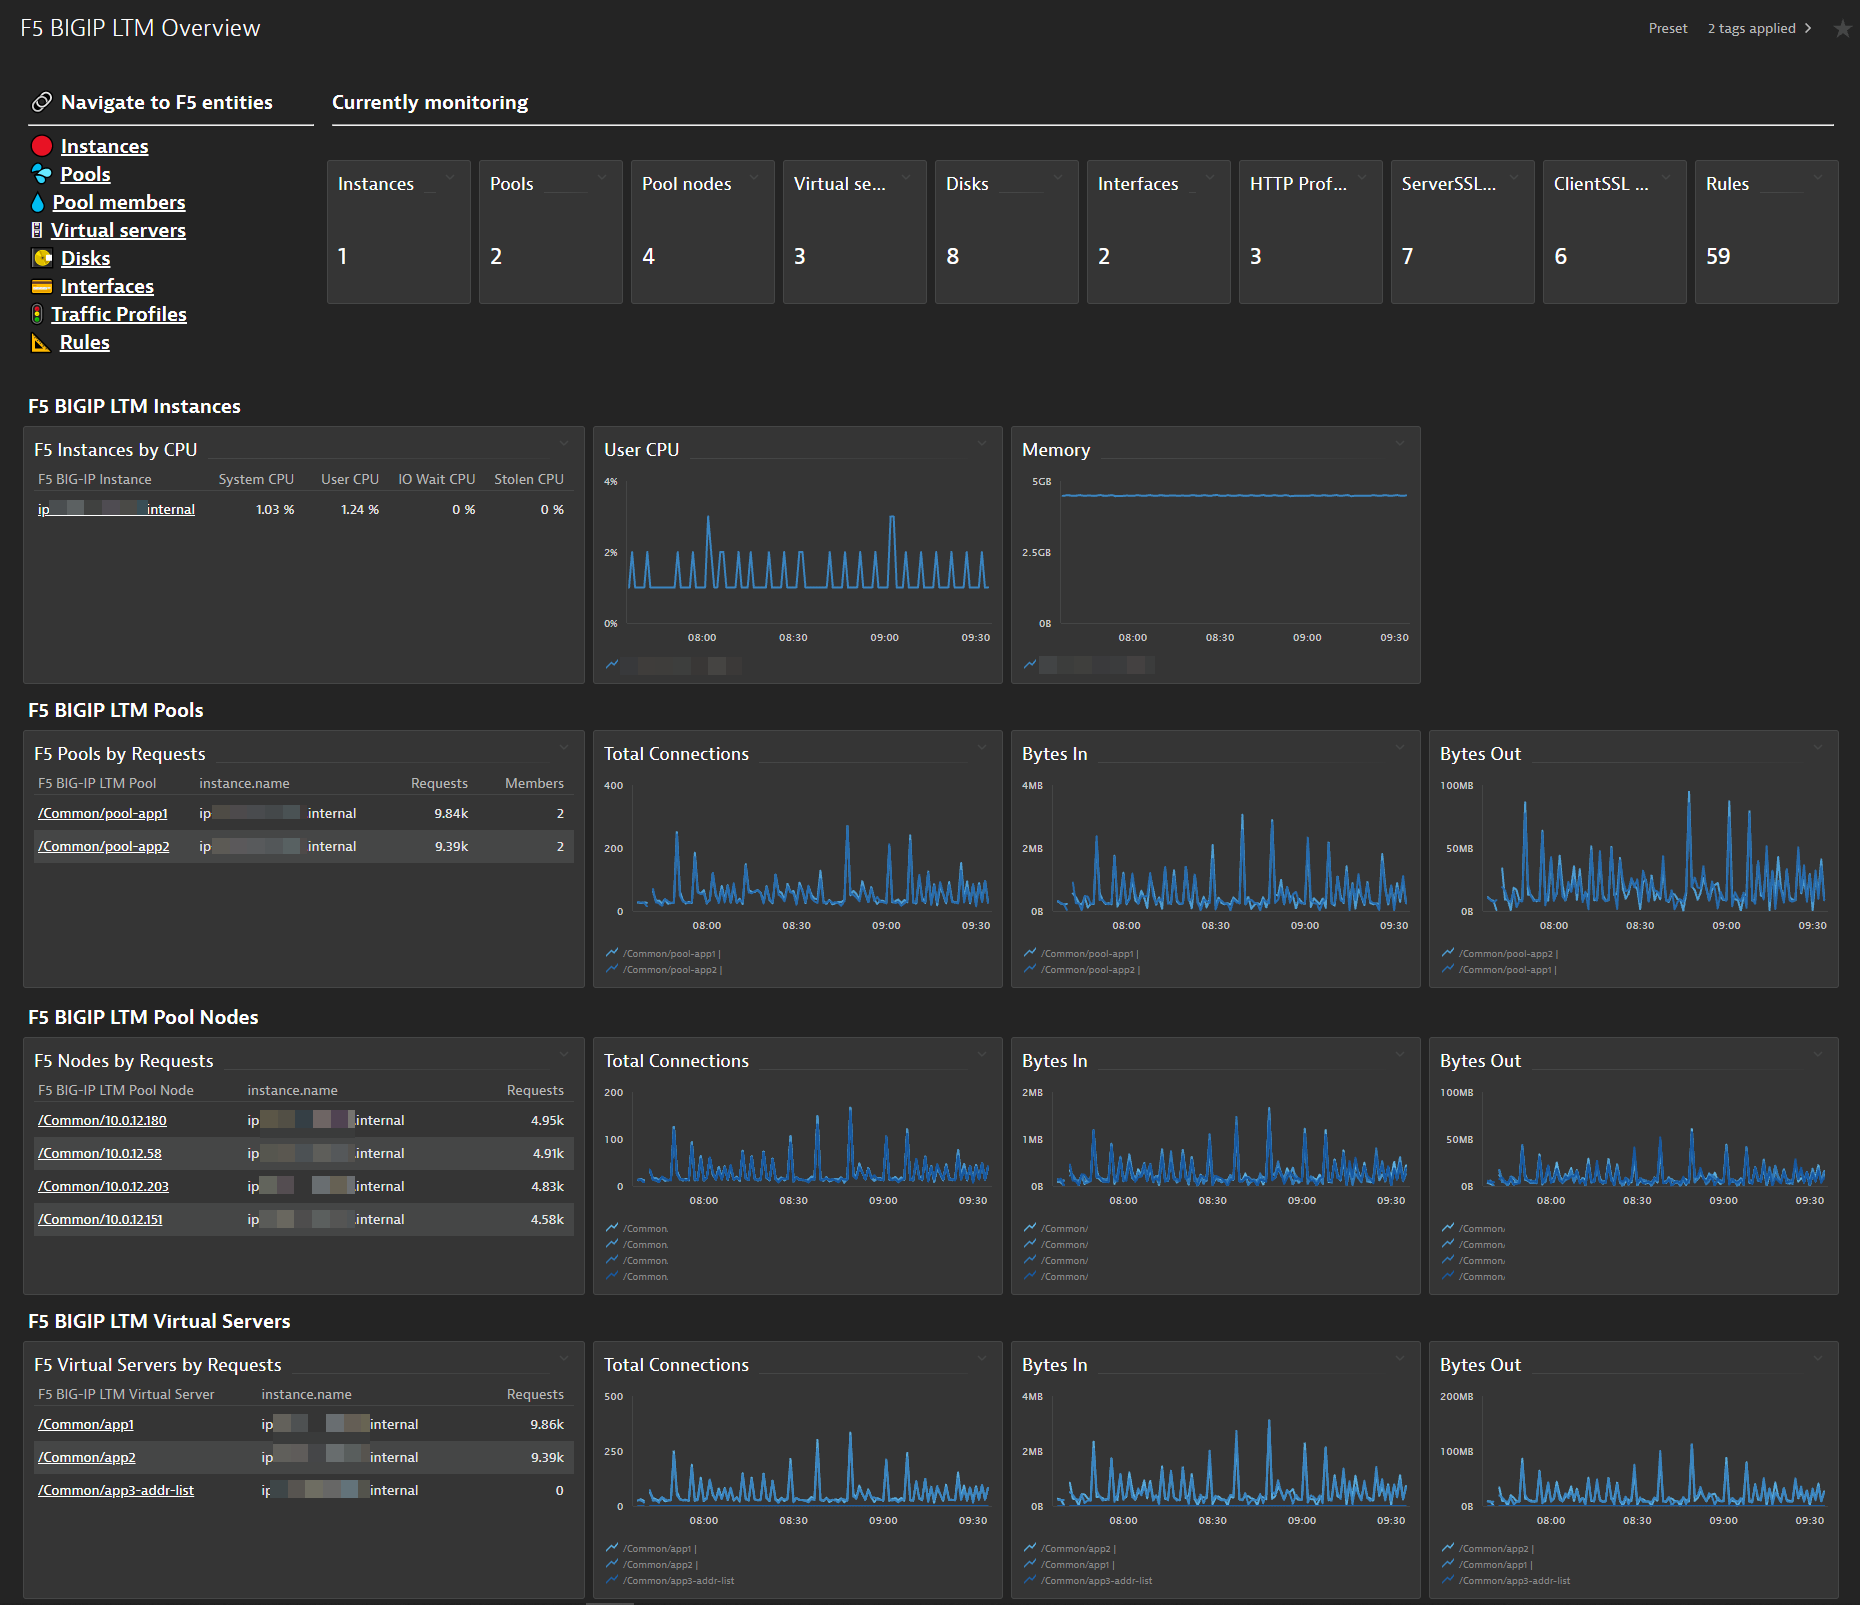
To help you speed up MTTR, there are several levels of visualization to help slice and dice through information:
- Instances
- Pools
- Pool nodes
- Virtual servers
- Disks
- Interfaces
- HTTP, ServerSSL, and ClientSSL profiles
Simplified data analysis presented in topological context
The built-in unified analysis pages offer real-time comparison of key performance indicators while applying a topology-first approach to the data. This eliminates the need for creating ad hoc dashboards and figuring out which metrics to apply—it’s a one-stop shop for performance analytics and enabling an end-to-end visibility into the health state and performance of complex enterprise network infrastructures.
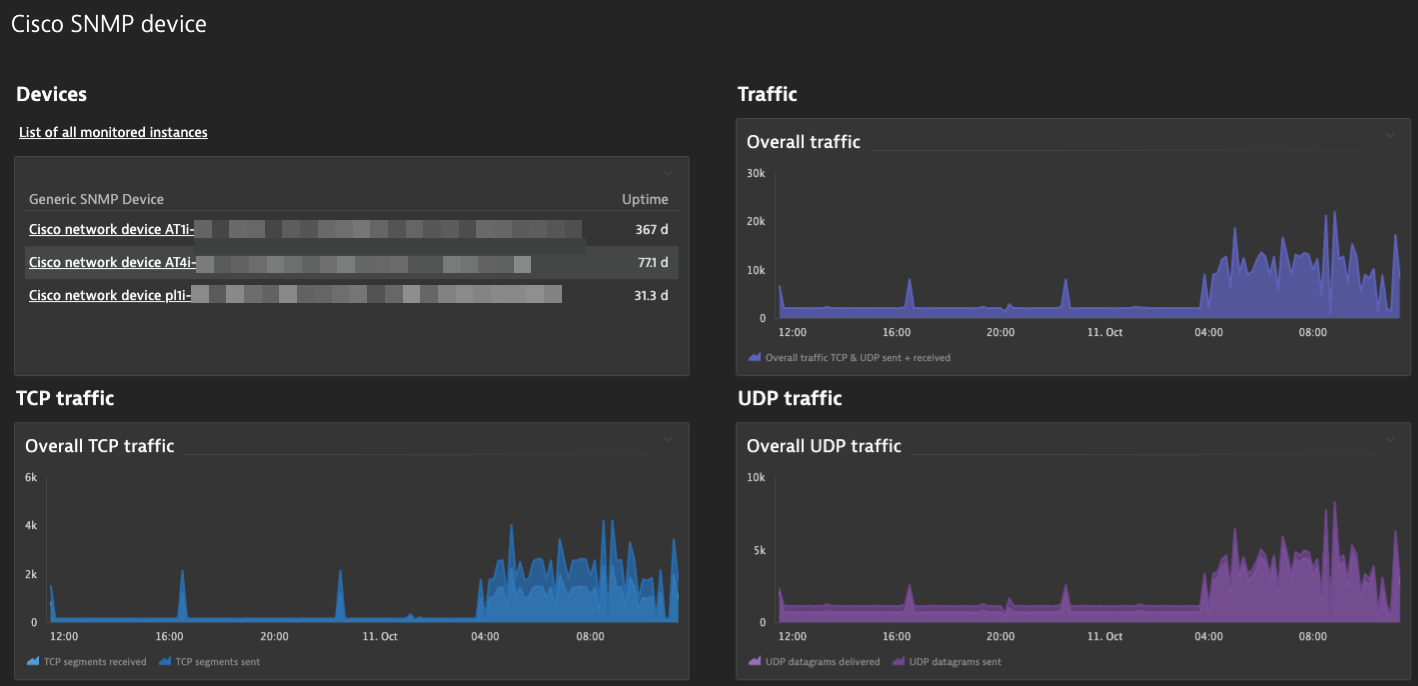
Monitor Cisco and any other devices
The Generic network device and the Cisco router extensions are designed to easily extend observability to all the basic and popular devices. The new declarative approach fits perfectly into any enterprise context, removing the extra effort involved in configuring dashboards/analysis screens manually for every single technology you need to monitor.
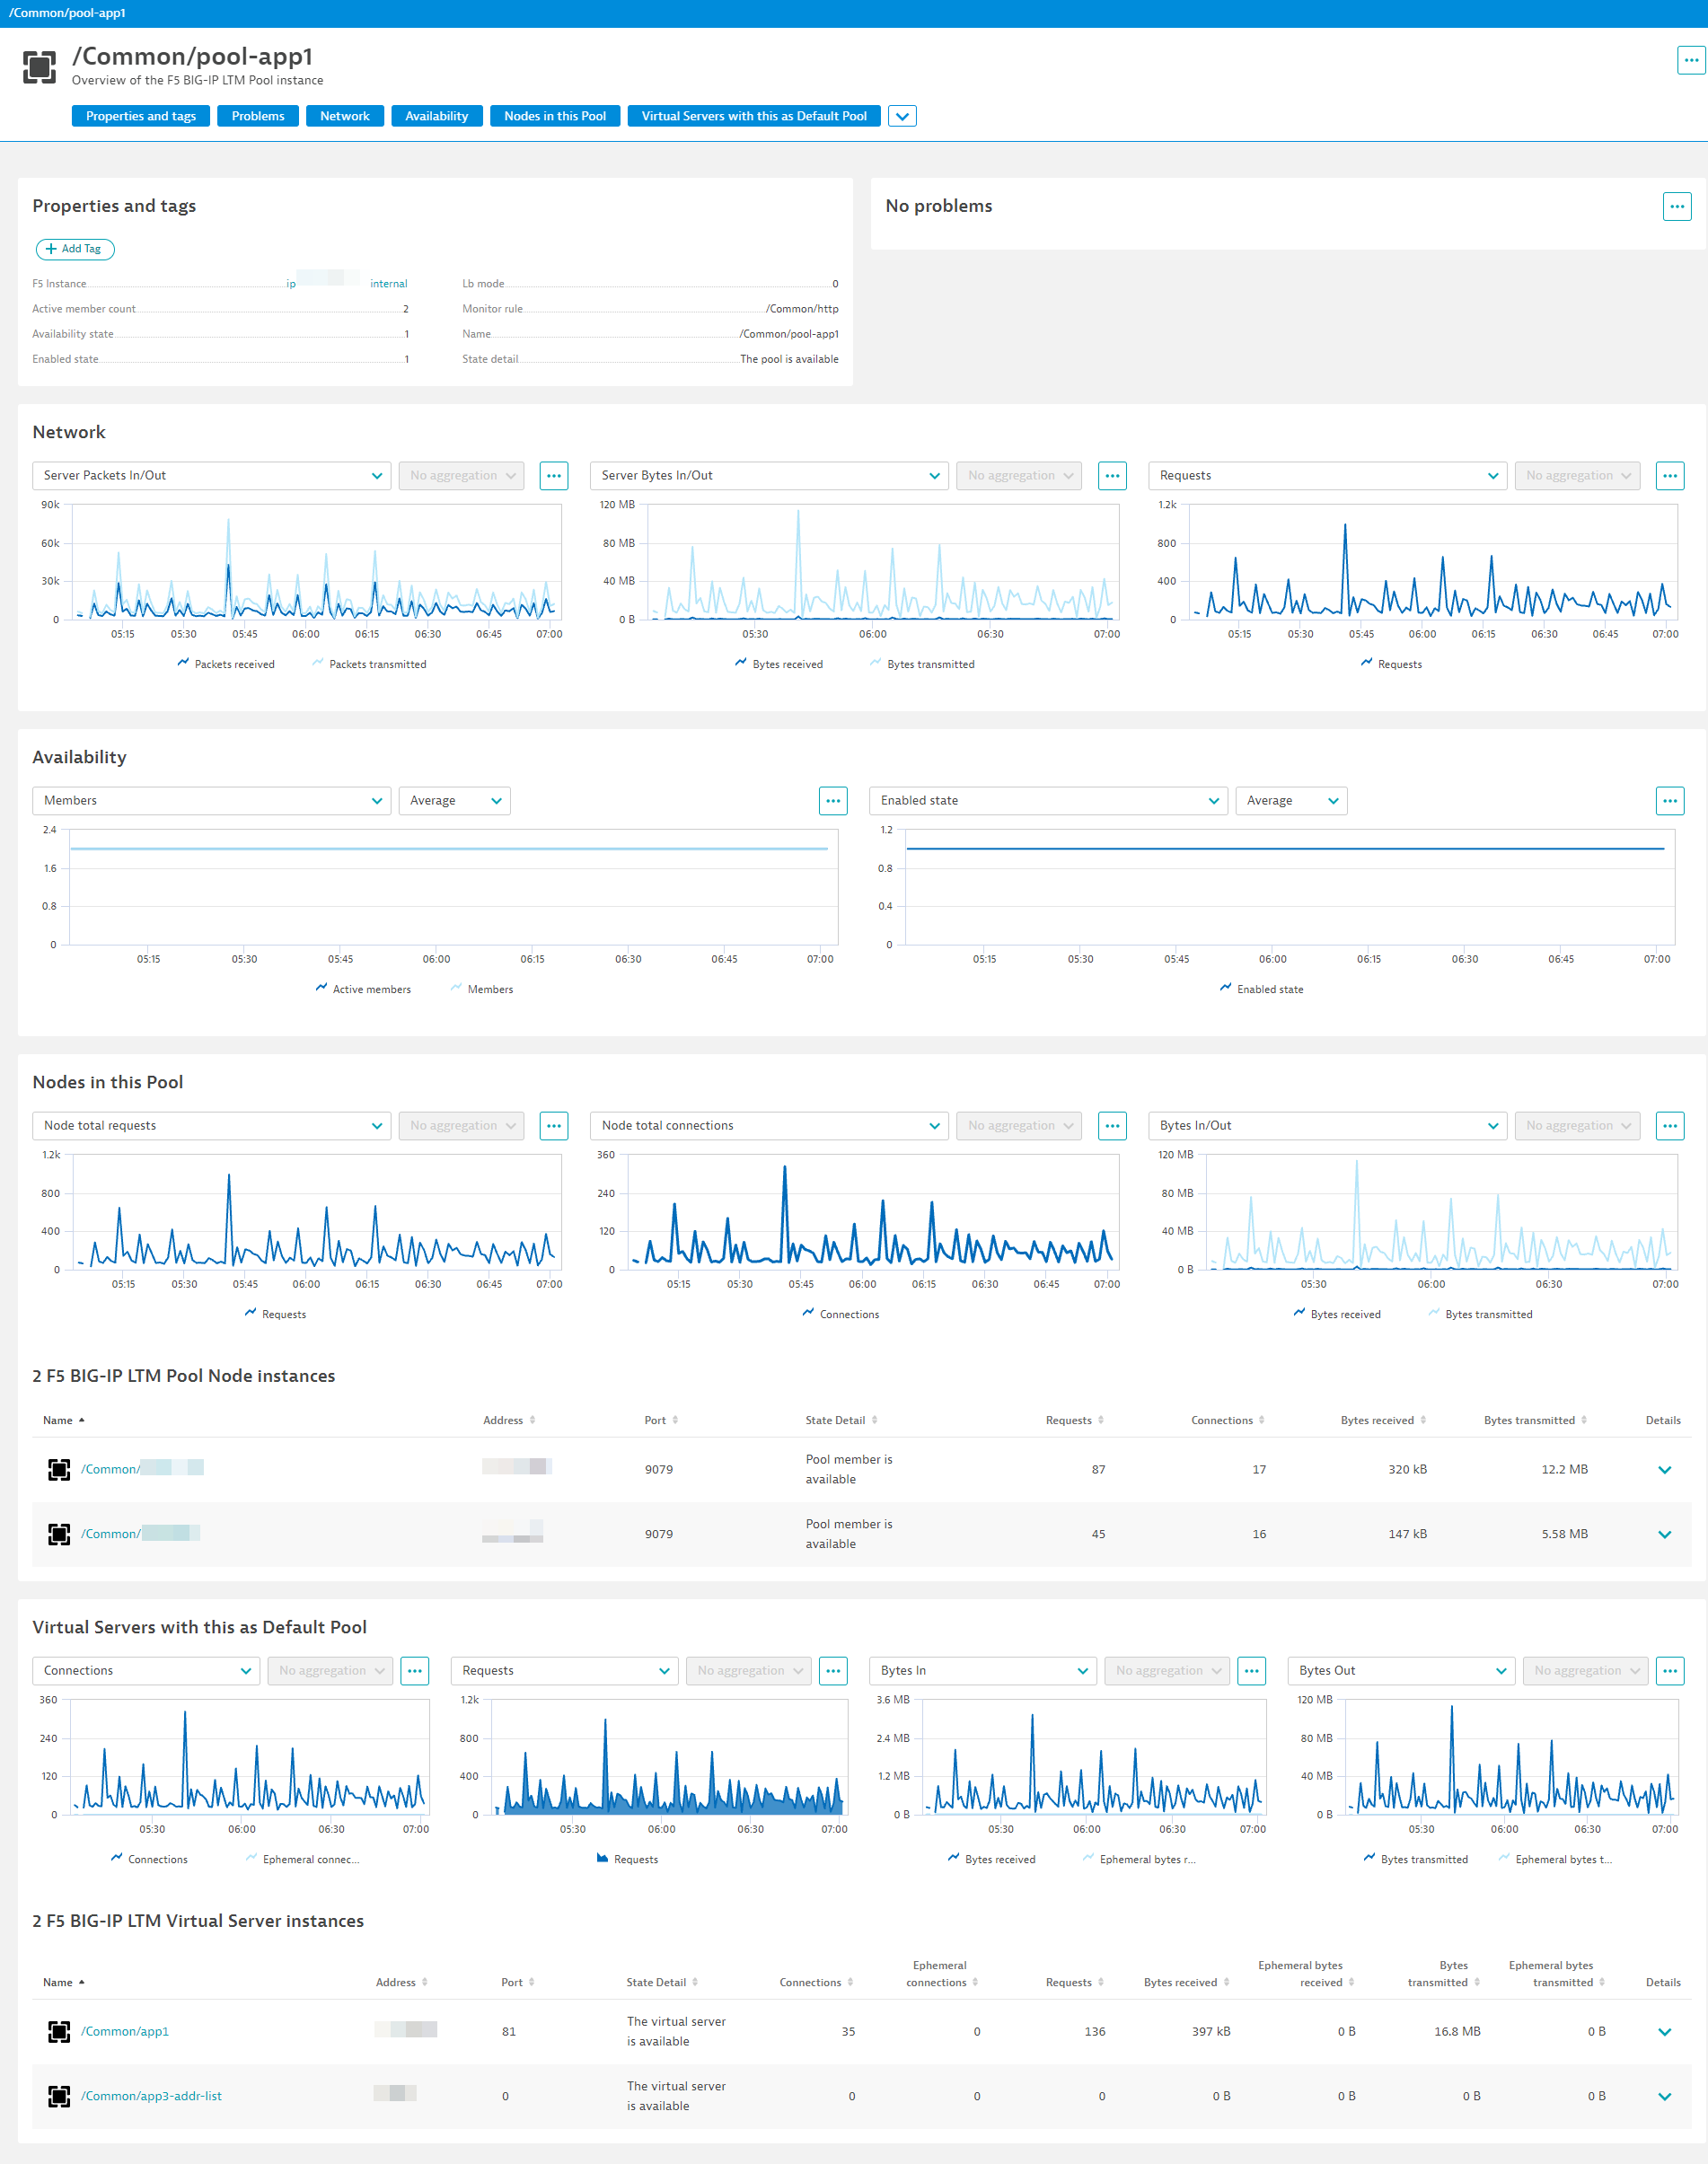
Advanced load balancer analysis
The F5 BIG-IP LTM extension offers a complete view, beyond simple metrics, into your Local Traffic Manager (LTM) platform. With a one-click deployment, you get insights into your BIG-IP device health and performance as well as the other moving parts of the LTM suite (such as virtual servers, pools, and nodes) that are configured on top of it.
Whether you’ve implemented persistence or host-based load balancing, whether you’re operating at Layer 4 or Layer 7, the BIG-IP LTM extension answers the questions that really matter such as “Is my load balancer performing well? Are users able to reach my applications?”
What’s next
Dynatrace provides ready-to-use solutions for all challenges in infrastructure monitoring. As the next logical step in that direction, we will offer SNMP traps support, as network infrastructure consists of multiple devices spread across different data centers and supporting a variety of services.
To complete this picture, additional data sources like synthetic network checks, the ability to fetch logs, and others will be added over time.
Further improvements will also include better and more exact AI-driven answers, especially those that leverage all the data that can now be collected by the new Dynatrace extensions.
If you think that we should extend these plans by adding more capabilities, please let us know via the Product Ideas forum in the Dynatrace Community. We also welcome your feedback, which enables us to improve while you can see the impact you have on Dynatrace.


Looking for answers?
Start a new discussion or ask for help in our Q&A forum.
Go to forum