What is IBM HTTP Server?
IBM HTTP Server (IHS) is a web server based on the Apache Software Foundation's Apache HTTP Server that runs on AIX, HP-UX, Linux, Solaris, JADE, Windows NT, IBM i and z/OS.
With Dynatrace you monitor and visualize metrics in the context of your web services that run on IBM HTTP servers. Keep an eye on IBM processes, CPU, and memory consumption.
Monitor your IBM server performance
With Dynatrace you get deep-level visibility into each of your web server process groups, including dependent applications and running services. When problems are detected, the Dynatrace anomaly-detection engine correlates host and network metrics with web-server specific metrics, busy workers, response sizes, and number of requests, to identify the root causes.
Dynatrace shows you all relevant information in an interactive infographic. Meta information like application version, configuration path, and used ports are included. See availability metrics and events like deployment changes and IBM restarts.
See IBM-specific metrics (without plugins!)
Just install the Dynatrace OneAgent to see the metrics you need. For IBM, Dynatrace shows you:
- Requests
- Response sizes
- Busy workers
System performance metrics (CPU, memory, and more) are also available.
You get details about network traffic, TCP requests, and connectivity, along with quality metrics like retransmissions, round-trip time, and throughput.
Analyze response time hotspots down to the module level
With deep process monitoring enabled, Dynatrace analyzes the response time of each IBM service running within each process. Each service page enables you to analyze response time hotspots so that you can see what activities are consuming the most time for each service.
Start IBM performance monitoring in under 5 minutes with our free trial!
Sign up, deploy our agent and get unmatched insights out-of-the-box.
Auto-detect your application environment and performance anomalies!
Dynatrace full stack monitoring extends web server monitoring beyond basic status metrics. With a single agent installed on your server, Dynatrace auto-detects all IBM web servers in your application environment. See the full picture of your application topology and identify dependencies between tiers in your application stack.
CPU saturation slowing down your database, your services, and your website? You'll receive a single notification that addresses the root cause of the problem, not multiple alerts for you to sort through and analyze. Using artificial intelligence, Dynatrace detects performance anomalies before they affect customer experience.
Visualize IBM service requests end-to-end
Dynatrace understands your applications’ transactions from end-to-end. Service flow shows the actual execution of each individual service and service-request type. While Smartscape shows you your overall environment topology, service flow provides you with the view point of a single service or service-request type.
Monitor real user performance without code changes
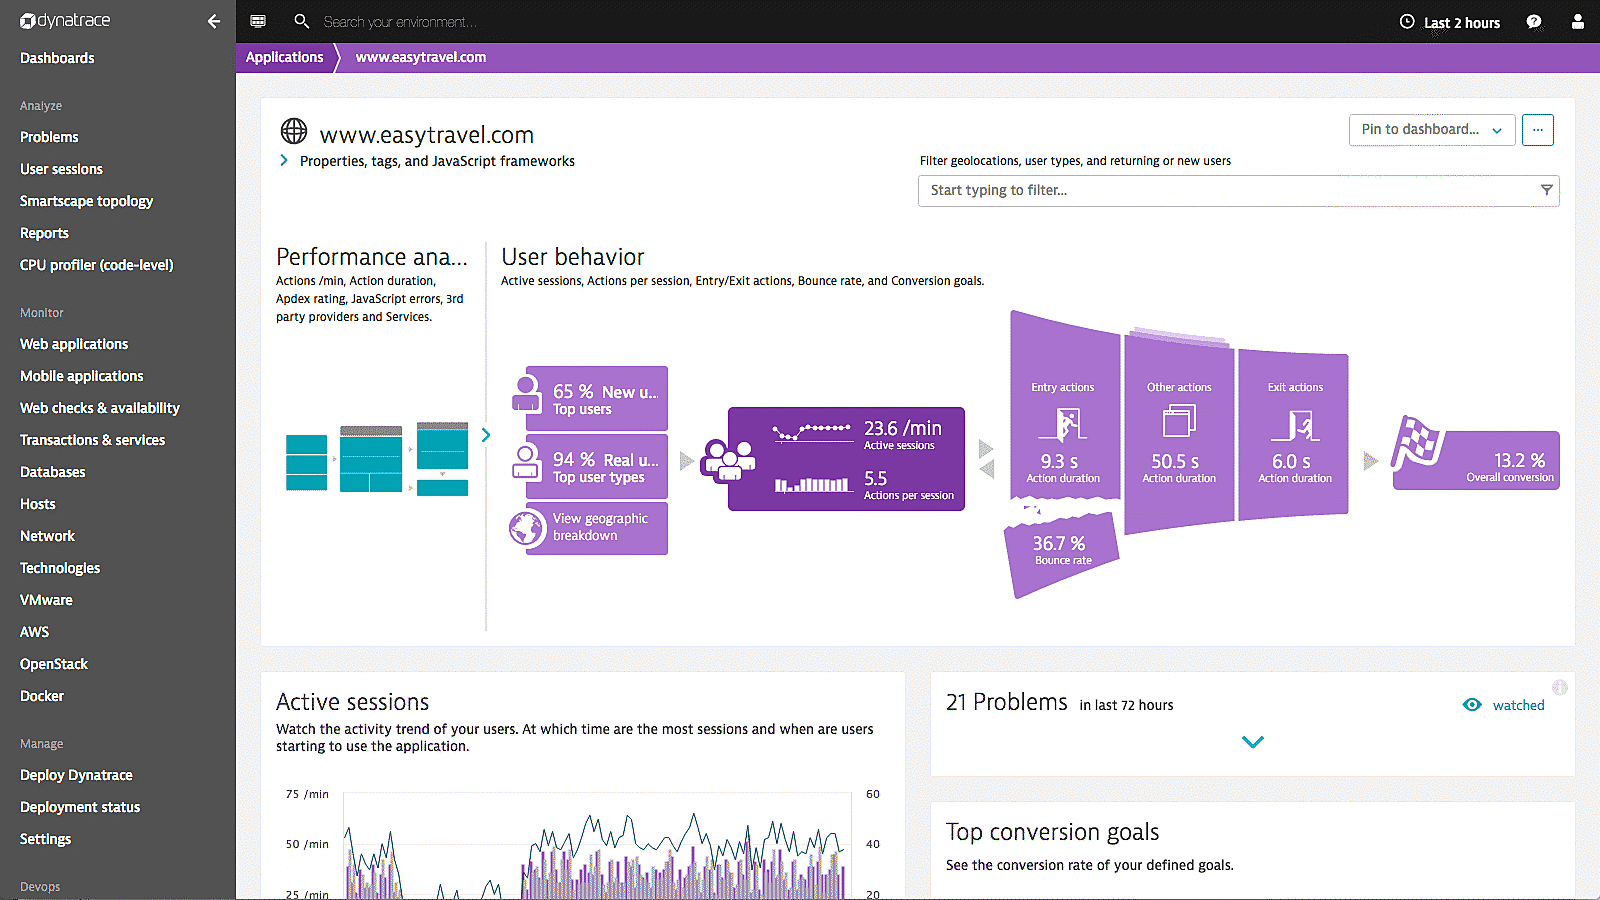
Dynatrace real user monitoring (RUM) collects metrics from your customers' web browsers and correlates it with server-side information obtained from Dynatrace OneAgent. Web browser data is collected by a JavaScript tag that is placed inside the HTML of your applications' web pages.
Dynatrace OneAgent JavaScript tag injection is performed automatically during installation. All you need to do to initiate injection is to restart your IBM processes following Dynatrace OneAgent installation. Dynatrace OneAgent identifies HTML content responses and automatically injects a small JavaScript tag into the head section of each page.
Dynatrace seamlessly integrates real user monitoring and synthetic monitoring:
- Analyze response times and resolve JavaScript issues by seeing your website as your customers do!
- Monitor the availability and performance of your web applications by recording synthetic monitoring using a simple point-and-click interface.


We’re intrigued by its capability to work almost out of the box as well as being able to monitor system aspects as well as application performance and user experience.
Try it free


