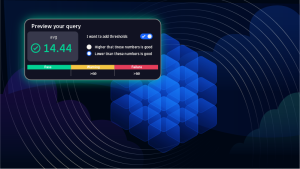
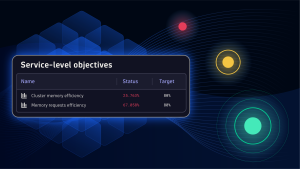
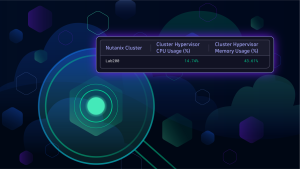
SLOs for Kubernetes clusters: Optimize resource utilization of Kubernetes clusters with service level objectives Read now
Unmatched scalability and security of Dynatrace extensions now available for all supported technologies: 7 reasons to upgrade your JMX and Python plugins Read now
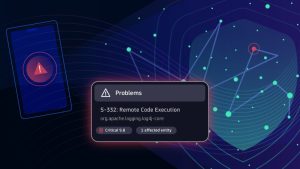
Dynatrace unveils Security Analytics to elevate threat detection, forensics, and incident response Read now
Dynatrace expands Davis AI with Davis CoPilot, pioneering the first hypermodal AI platform for unified observability and security Read now