
Many organizations are moving their Microsoft workloads to the public cloud or have already done so. Based on what Andy Jassy, CEO of Amazon Web Services, presented at re:Invent 2018, it seems that the majority is moving their workloads to AWS:

Many of our customers also run their .NET, ASP.NET, .NET Core, SQL Server, CRM, SharePoint … applications on AWS and have reached out to us in the past to ask about best practices around optimizing these workloads in order to run more efficiently and more cost effective.
I recently, helped one of our customers, a leading provider for cable and satellite television in the United States, optimize their Microsoft workloads running in different AWS Environments with Dynatrace.
In this blog I’d like to walk you through a couple of use cases I recommended to them.
Step #1: Install Dynatrace
After signing up for Dynatrace SaaS, or installing it on-premises (=Managed), there are two steps I recommend everyone to take
- Install OneAgents on your EC2 machines
- Setup the Dynatrace AWS CloudWatch Integration
- For EKS, install the OneAgent Operator
- For Fargate follow my blog Breaking the Monolith
- If you want to connect to Dynatrace via AWS PrivateLink follow this link
For more details, I suggest watching my latest YouTube Tutorial on Advanced Monitoring of AWS with Dynatrace.
Let’s have a closer look at the AWS environments from the above-mentioned customer and the data Dynatrace pulls in through the CloudWatch integration. It should give you an idea about their scope when it comes to running workloads on AWS:
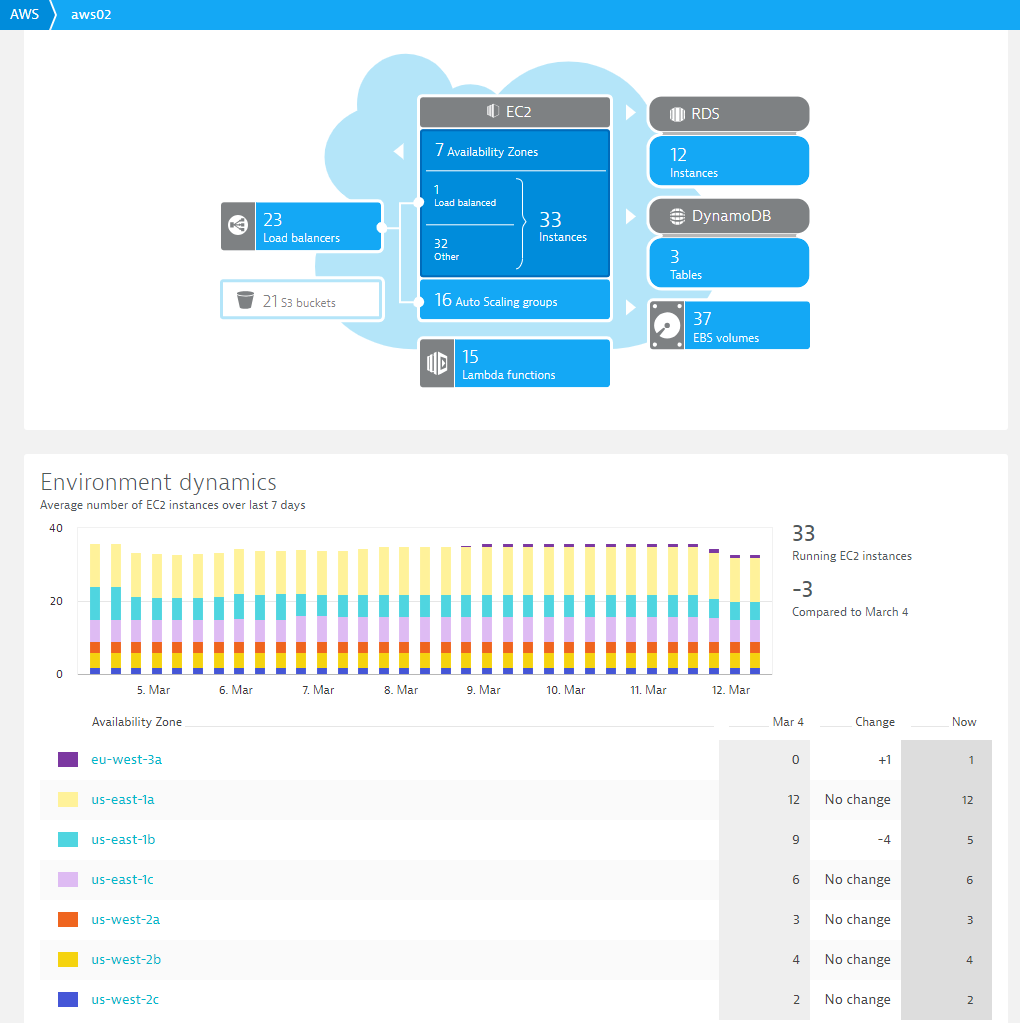
Tip 1: Not only does Dynatrace display this data on dashboards, the deterministic AI engine Davis®, analyzes and alerts on AWS specific problems, so that you don’t have to specify thresholds or alert conditions. Finally, you can also access this data through the Dynatrace REST API in order to integrate Dynatrace data with your other tools along the DevOps toolchain.
Tip 2: Our product team recently announced support for additional AWS Services like API Gateway, CloudFront, ECS and EFS. You can get access to these new capabilities by following the instructions in the blog Additional AWS service metrics by Dynatrace.
Step #2: Understand Resource Consumption, Spikes & Errors
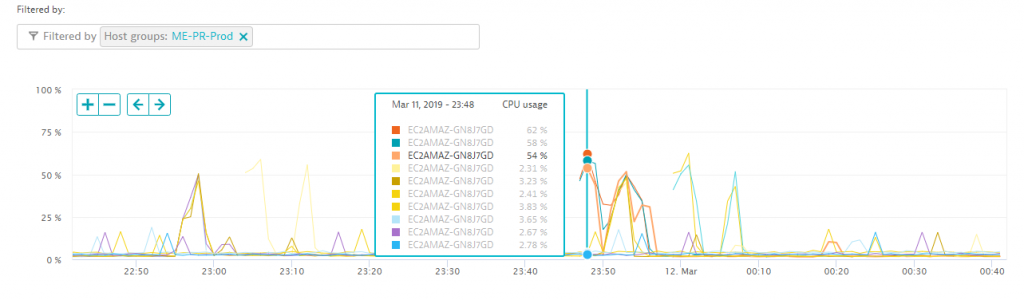
Dynatrace automatically pulls AWS tags for all monitored resources. Additionally, you can also specify your own tags or put your hosts into so called host groups. In this case, our client defined a specific host group for their PR (Play Ready) hosts, which metadata that can be used for filtering. The following is a CPU consumption chart of all hosts that have this specific tag. It becomes apparent that apart from a couple of spikes during night hours (up to about 60%), these hosts are mostly idle.
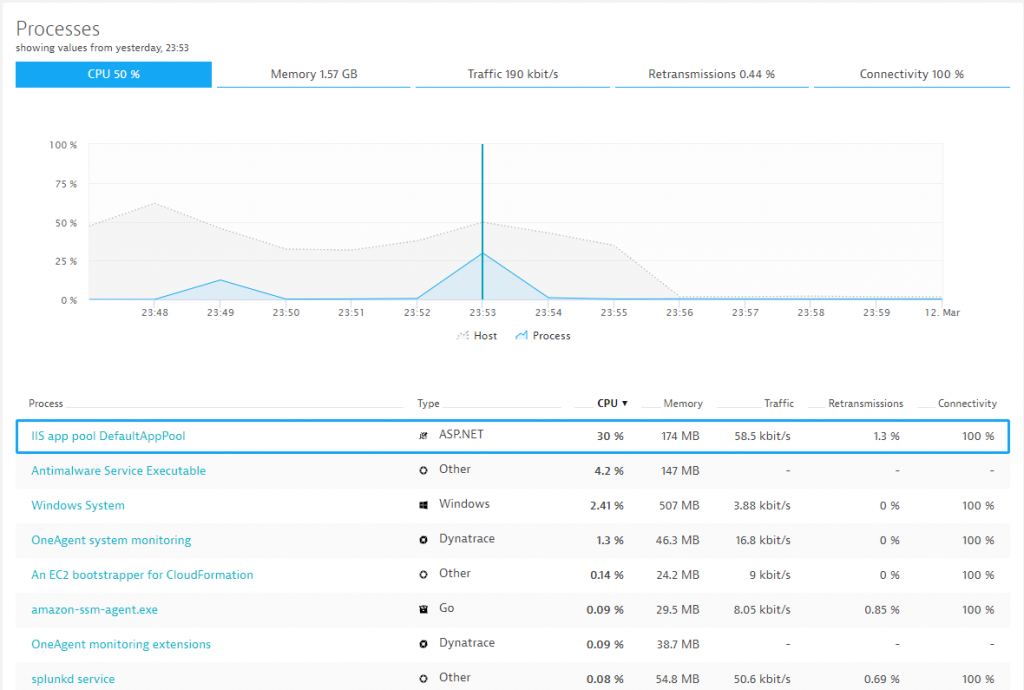
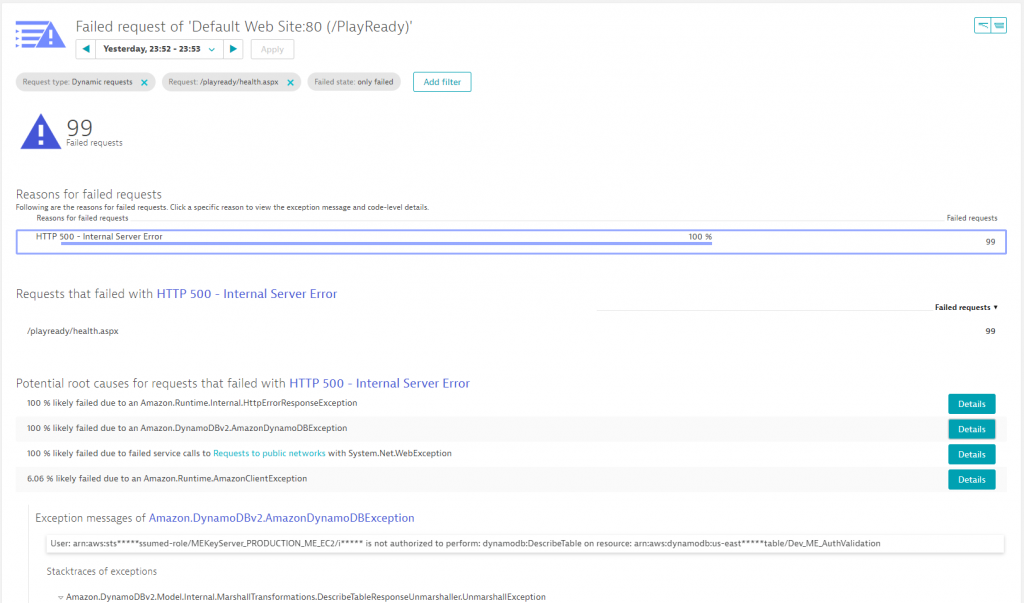
To find the reason for these spikes, we can simply drill into that machine and look at all performance metrics the Dynatrace OneAgent has automatically captured for all processes and containers running on that host. It turns out the IIS DefaultAppPool is partially responsible for it.
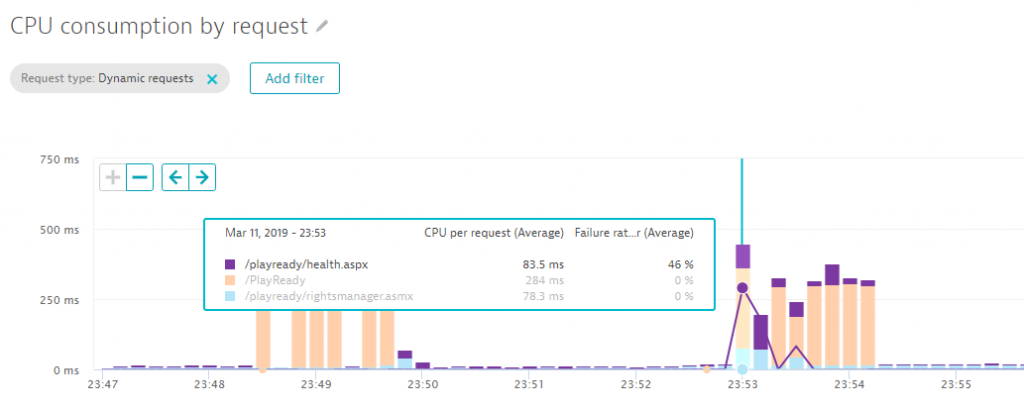
Thanks to the automatic full-stack instrumentation, we can drill into the services hosted by IIS. Dynatrace immediately shows us that the issue is related to the /PlayReady service. The following chart shows how much CPU is consumed per request and endpoint. We can see that requests to /PlayReady suddenly take up significant CPU resources, while the error rate of /playready/health.aspx jumps to 46% at the same time.
One additional click, and we get to see the actual root cause of the errors which turns out to be a temporary authentication issue with the backend DynamoDB service.
Let me recap what we just did:
- We started to learn more about resource consumption of a set of hosts over a period of time
- While resource consumption was very low, we could observe spikes during certain timeframes in the middle of the night
- The spikes turned out to be caused by an ASP.NET App running into errors when accessing DynamoDB
All this data is available out-of-the-box when installing a Dynatrace OneAgent on EC2 instances. No additional code or configuration change is necessary! The data available allows both operations and development to optimize workload execution and reduce resource consumption and therefore costs.
Action items for Dev & Ops:
#1: Understanding overall resource behavior allows you to properly size your EC2 instances and plan better for expected spikes during certain times of the day, week or month.
#2: Finding and fixing problematic code or configuration changes optimizes resource consumption as we have seen in the previous example
Step #3: Validate and Optimize Deployments
One of the reasons for moving to a cloud platform is on-demand elasticity and multiple availability zone deployments to achieve high availability and fault tolerance of your services. The only challenge is validating your deployment strategy and understanding whether it really provides the expected results. If there is an error, the challenge becomes trying to figure out where the root cause really is.
I advise users to leverage Smartscape, a live dependency map Dynatrace builds based on data from OneAgent, our 3rd party integrations and any additional dependency data that is sent to Dynatrace via our APIs & plugins. The following screenshot shows Smartscape for the PlayReady service we discussed earlier. On the left we see where the service is currently deployed including all vertical dependencies (processes, hosts and availability zones). On the right we see the horizontal dependencies this service has to other services, e.g: calling external services, NGINX, …:
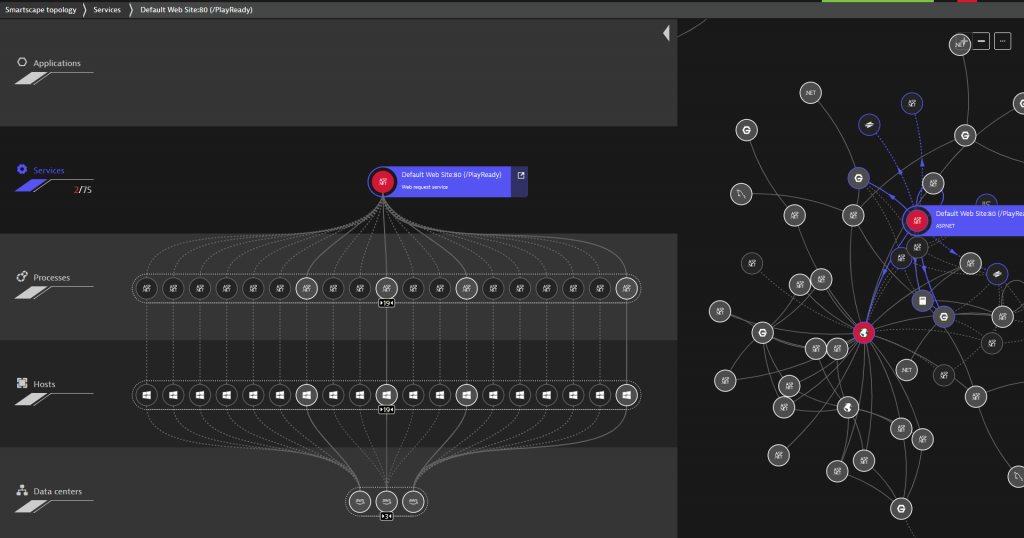
While the Smartscape visualization in the UI is great – its real value comes when leveraging the dependency data in other areas, e.g: Dynatrace Davis, the deterministic AI Engine uses the dependency graph to detect abnormal behavior along all dependency paths. I took the screenshot at a time an active problem was detected by the AI, and as we can see, a depending external service is also showing an issue. I will come back to this later in the blog.
While I love the Smartscape representation in the web interface, interacting with it through the Dynatrace Smartscape API is even more powerful. It allows us to integrate Dynatrace into the DevOps toolchain to implement use cases like:
#1: Pre-Deployment Check: Are all depending services available before deploying an update
#2: Post-Deployment Validation: Are all services updated? Are they deployed across all relevant availability zones? Are they receiving traffic?
#3: Regression Detection: Did we introduce a new dependency that was not planned? Are all services connecting to the correct backend services or databases?
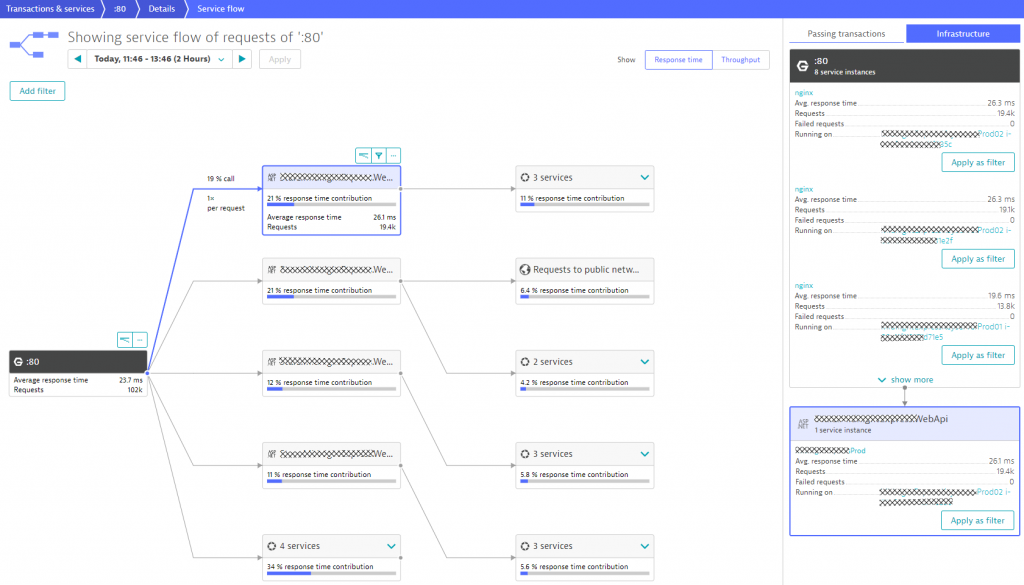
Smartscape also leverages end-to-end tracing data from the Dynatrace PurePath technology. This data can be analyzed with ServiceFlow as can be seen in the next screenshot. It shows us how transactions are flowing through the different architectural components. What we can observe is that the frontend NGINX cluster (8 instances in total) is not equally distributing the load to the MidnightExpress.WebApi. Two instances receive about 19k requests in the selected 2h timeframe, the remaining 6 receive only about 13.8k. This could be due to a planned canary release, but if it isn’t, this is a great way to validate the deployment.
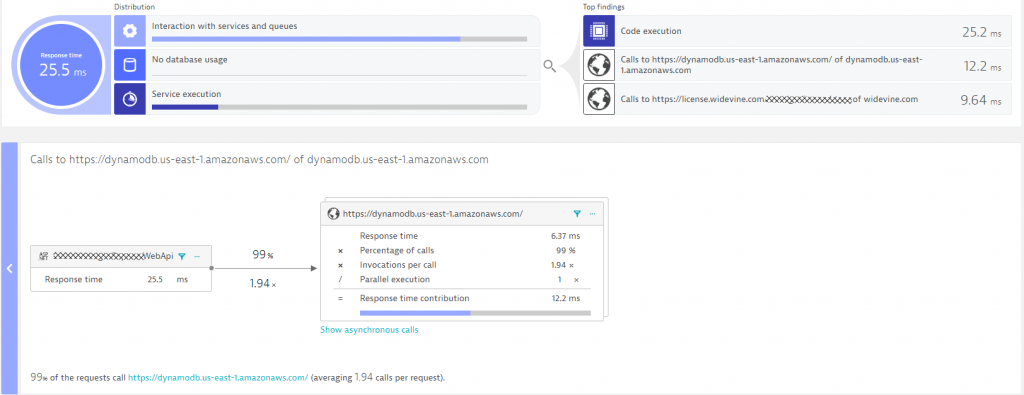
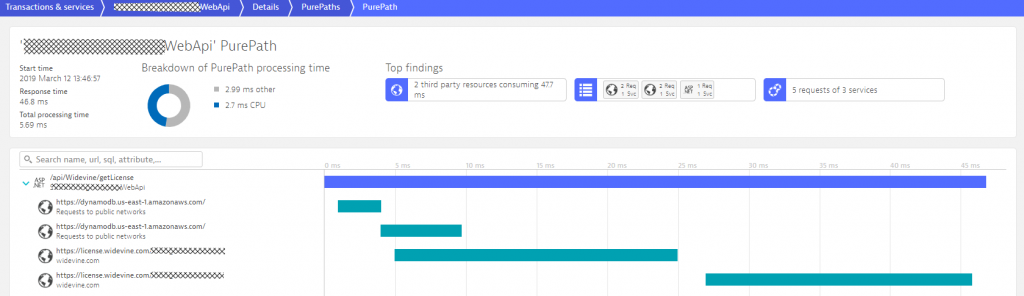
If we detect hotspots (performance or error) in any tier, Dynatrace gives automated response time & failure hotspot analysis. This is great for developers to figure out how to optimize their code, either by becoming more efficient in their code execution or in the way they access other services or databases. The following screenshot shows the Response Time Hotspot Analysis for the MidnightExpress.WebApi. The top contributor is code execution, but we also see that accessing DynamoDB & a license API from widevine is a performance contributor. It even seems that there are about 2 calls to DynamoDB for every incoming request.
Developers can now drill into the PurePath details to learn whether they can optimize this code, e.g: reduce duplicated calls to an external service or optimize their own algorithms. Here is the PurePath view showing the sequence of API calls issued by their ASP.NET code. A click on Code level shows Developers which methods call these APIs, whether there are duplicated calls and how much time is spent. This is a great indication where to start optimizing this service.
Let me recap what we just did:
- We started to learn more about actual deployments and dependencies between services
- We learned that traffic is not equally distributed across all frontend NGINX servers
- We know that the WebApi service makes multiple calls to DynamoDB and the external License Service
Now let’s investigate what actions we can derive from this data.
Action items for Dev & Ops:
#1: Compare actual deployment with the desired state, e.g: do we have enough service instances available in the required availability zones?
#2: Validate traffic routing and optimize routing rules to distribute load evenly
#3: Optimize service implementation, e.g: reduce calls to depending services
Step #4: Diagnose & Optimize Database, Exceptions and Web Requests
I have been doing a lot of writing around using Dynatrace for diagnostics. If you want to learn more about the different diagnostics options, I encourage you to watch my Advanced Diagnostics with Dynatrace YouTube Tutorial. I just wanted to show you what Dynatrace can do when using some of the diagnostics options on our client’s Dynatrace Tenant.
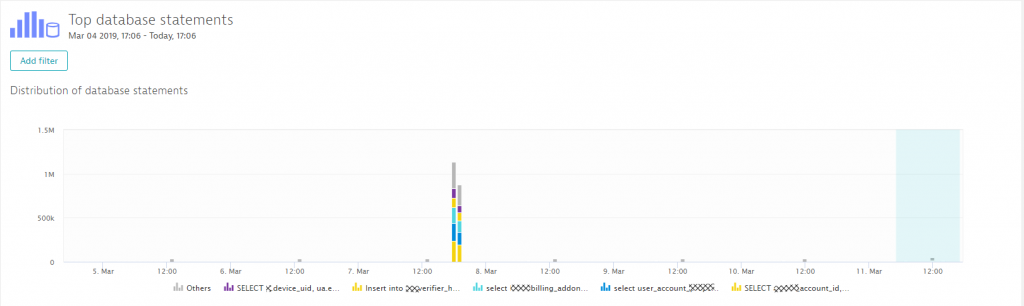
Analyzing the top database statements gives us an overview as to which database was accessed when and how (select, update, delete, insert, …). The following two screenshots show an interesting observation I made regarding this environment. When doing the analysis on database activity over the last 7 days, we could clearly see a huge spike on March 7th in the late afternoon.
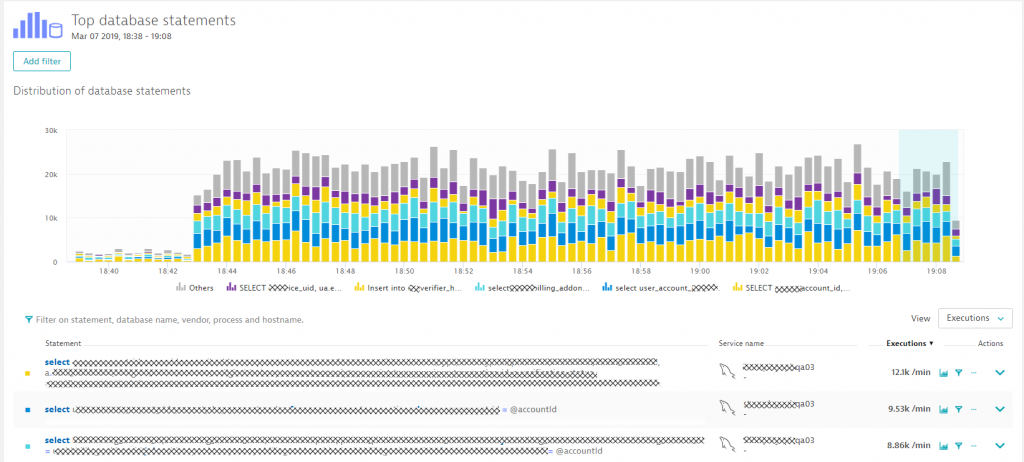
Zooming in shows us which statements were executed and how that compares to the situation before this spike kicked in. Dynatrace shows us the SQL statements, and we can switch between executions, response time or failure analytics.
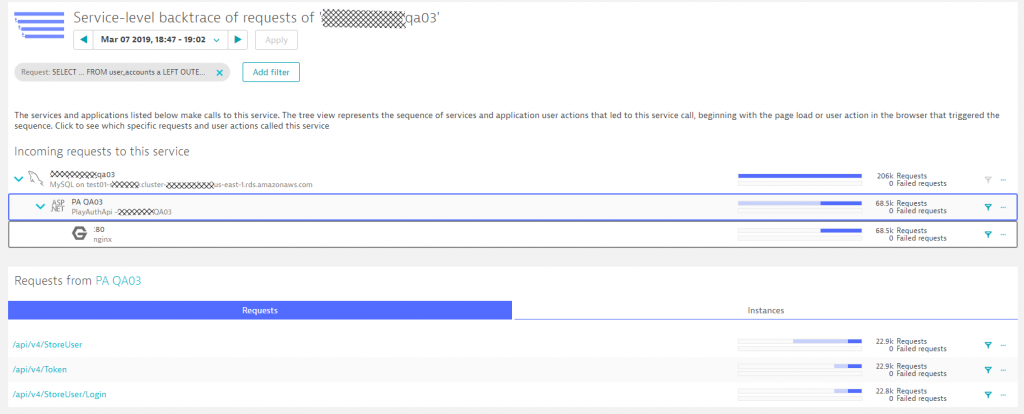
From any diagnostics view in Dynatrace we can analyze the so called “Backtrace” – which essentially shows us the reverse ServiceFlow starting for example from a SQL statement tracing it back to the origin of the call. In our case we can see that most of these calls came from /api/v4/StoreUser. What’s interesting though is that every single one of the 22.9k calls to this specific API resulted in 4 calls to that SQL statement: a classical N+1 query issue. This becomes apparent if you look closely at the blue bars in the backtrace, which shows how many requests on a particular service resulted in calls to the next service.
From here we can drill down to the PurePath as you have seen earlier to give developers more insights into where they are making these duplicate calls!
The last thing I want to show you on diagnostics is that we can do the same for exceptions. The following shows the number of exceptions thrown during a particular timeframe. We can see the spike just before midnight on March 8th. These were all the exceptions we analyzed earlier in the blog – those around the authorization issue when calling DynamoDB. What’s great though is that we can use the Exception View to analyze any abnormal behavior and then drill into the PurePath to fix it.
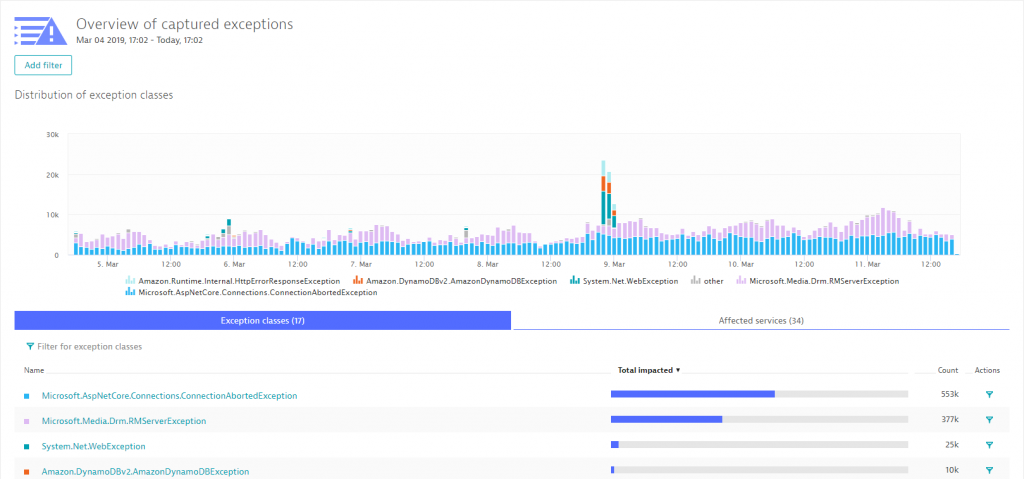
A last word on exceptions: Exceptions are important and necessary, but they also come with a cost. Every exception means additional memory needs to be allocated and it means that special error handling gets executed. One of the goals I see modern development teams set for themselves is to lower the overall number of exceptions in production. Most of them are typically related to misconfiguration or deployment problems, e.g: depending services not available.
Let me recap what we just did:
- We saw how easy it is to analyze database or exception hotspots
- We learned how to leverage the backtrace to see where these calls or exceptions came from
- We know that we always have PurePaths available to give developers more data to address any potential issues with e.g: excessive database queries or unnecessary exceptions
Now let’s summarize what actions we can derive from this data.
Action items for Dev & Ops:
#1: Understand database access behavior of certain services and plan for this accordingly
#2: Optimize database access: eliminate excessive or duplicated calls, e.g: N+1 query
#3: Set goals to reduce the number of exceptions
Step #5: Let the AI do its magic 😊
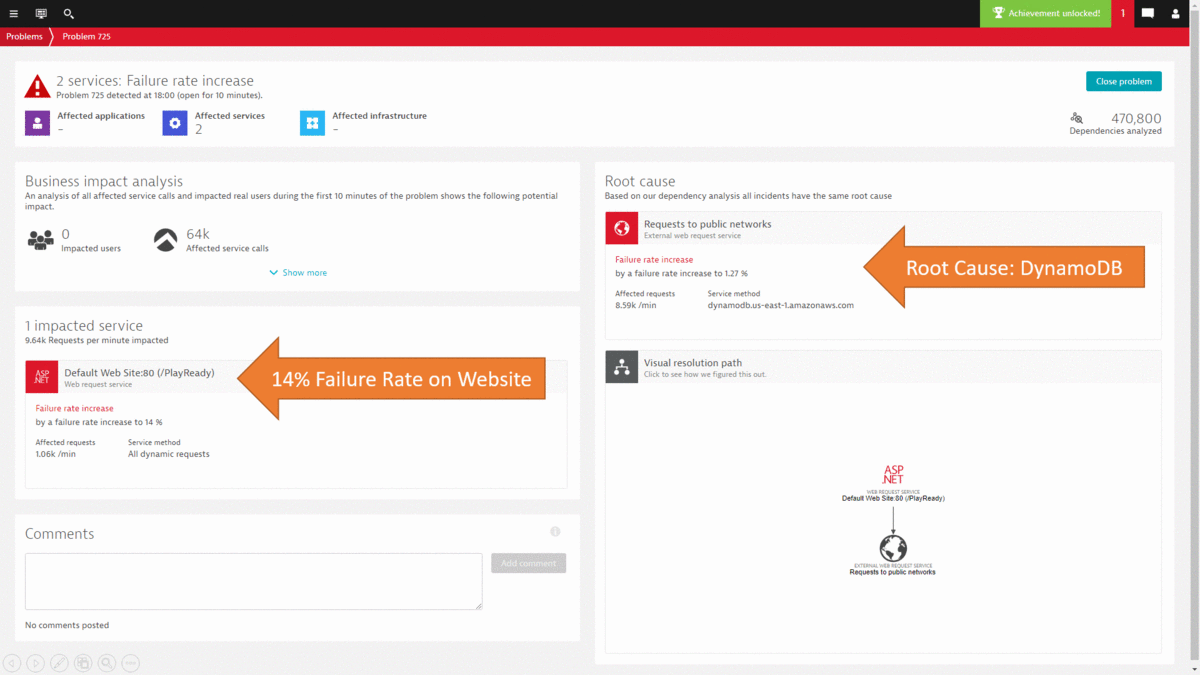
While I could go on and show you more use cases on how to leverage the Dynatrace data either in the UI or through the REST API, I want to leave you with how most of this can be automated thanks to the deterministic AI as part of Dynatrace Davis. In step #2 we went through a lot of data to end up at the DynamoDB exception, showing us that there was an authorization issue that caused requests to fail. The same problem was also detected by Dynatrace Davis and the following animated gif shows how the problem ticket looks like, how the DynamoDB was identified as the actual root cause and how it brings us straight to the exception and the source code in the PurePath.
If you want to learn more about Dynatrace Davis, how it works and how you can best leverage it, I suggest you check out my YouTube Tutorial on AIOps Done Right with Dynatrace.
Conclusion: Let’s Optimize with the help of Dynatrace
If you are moving workloads into the cloud, whether they are related to Microsoft as explained using this customer example or any other technology, remember to keep optimizing your deployments. If you don’t want to do everything manually, remember that Dynatrace AI does most of the heavy lifting already for you out-of-the-box.


Looking for answers?
Start a new discussion or ask for help in our Q&A forum.
Go to forum