
Dynatrace Blog
Drive your business forward in the digital age.


Leverage Dynatrace AIOps in GitHub CI pipelines to prevent critical incidents

Proactive self-monitoring ensures seamless operations for Dynatrace Managed at scale
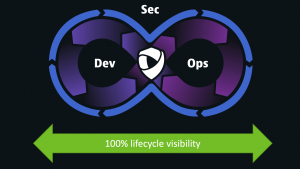
The top eight DevSecOps trends in 2022

Simone Biles: How this game changer twists challenges into triumphs

Kubernetes made simple? Kelsey Hightower and Andreas Grabner discuss the future of cloud-native technologies

Perform 2022: Recognizing customer and partner digital gamechangers

Max Tegmark on artificial intelligence: The ultimate technology for game-changers

New Prometheus-based extensions enable intelligent observability for more than 200 additional technologies

Dynatrace Application Security automatically detects and blocks attacks in real time

Common SLO pitfalls and how to avoid them

Dynatrace SaaS on Azure now Generally Available

Advance DevSecOps practices with a vulnerability management strategy

IT teams seek observability for, and control over, serverless architecture
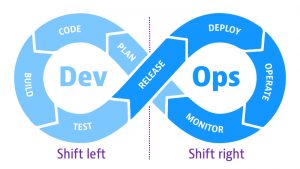
Shift left vs shift right: A DevOps mystery solved
DevOps orchestration: the solution to improve quality and increase speed in SDLC
AIOps capabilities drive intelligent cloud observability
Why vulnerability management enhances your cloud application security strategy

Service Level Objectives (SLOs) at Scale (Tips and Tricks)

Optimizing your Kubernetes clusters without breaking the bank

How Dynatrace uses Dynatrace to combat the Log4j vulnerability (Log4Shell)

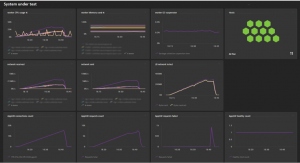
Release readiness through AI-based white box resiliency testing with JMeter and Dynatrace