
Building on its advanced analytics capabilities for Prometheus data, Dynatrace now enables you to create extensions based on Prometheus metrics. This allows teams to extend the intelligent observability Dynatrace provides to all technologies that provide Prometheus exporters. Without any coding, these extensions make it easy to ingest data from these technologies and provide tailor-made analysis views and zero-config alerting.
Many technologies expose their metrics in the Prometheus data format. Among these, you can find essential elements of application and infrastructure stacks, from app gateways (like HAProxy), through app fabric (like RabbitMQ), to databases (like MongoDB) and storage systems (like NetApp, Consul, Memcached, and InfluxDB, just to name a few).
This creates challenges in gaining actionable insights for these technologies across heterogeneous and dynamic environments:
- Achieving global visibility requires extra components and introduces new requirements for security and access control.
- Effective analysis of metrics requires more context, especially understanding of the dependencies between applications and respective components and how they relate to other telemetry data.
- Manual approaches to keeping alerting configurations up to date are impossible at enterprise scale.
- Multiple Prometheus servers might be required, creating significant maintenance efforts.
Easily gain actionable insights with the Dynatrace Extension for Prometheus metrics
Our monitoring coverage already includes Prometheus in Kubernetes and integration with the recently introduced Amazon Managed Service for Prometheus.
Now we’re excited to announce the release of Dynatrace Extensions support for Prometheus metrics. No matter whether you’re using official, custom-made, or third-party Prometheus exporters, you can now easily collect metrics for intelligent observability of your environment, enabling you to:
- Achieve global visibility and visualize metrics with state-of-the-art dashboards.
- Reduce alert noise and accelerate your mean time to repair (MTTR) for infrastructure incidents.
- Analyze Prometheus metrics in full context of topology, traces, logs, user sessions, and more.
- Leverage auto-baselining to reduce alert noise and minimize configuration efforts.
- Benefit from the scale, manageability, and security of the Dynatrace platform for large ecosystems.
Declarative extensions and Dynatrace Hub help you scale and optimize your time to value
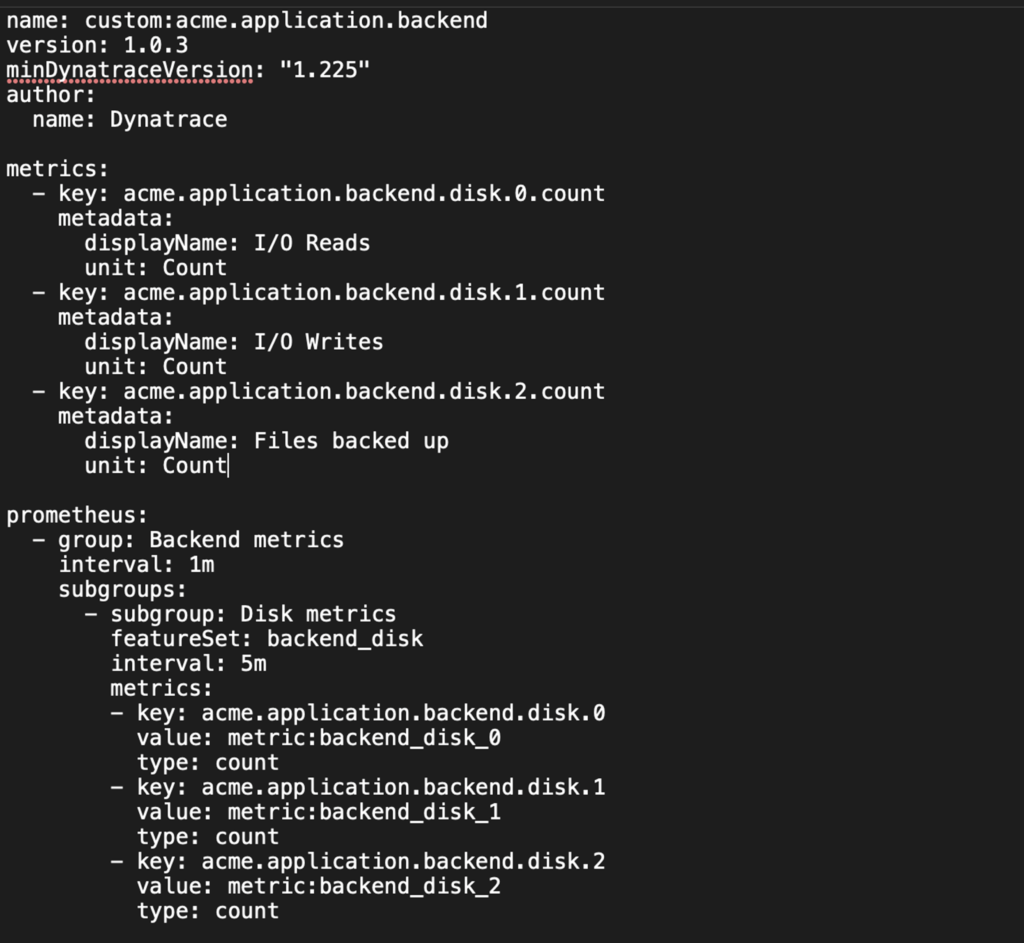
Extensions allow you to define relevant metrics as well as add elements such as topology dependencies, dashboards, Unified Analysis views, and pre-defined alerts. Setting up extensions for Prometheus-compatible technologies is as easy as listing Prometheus metrics.
Without any coding skills required, you can declare extensions in a human-readable YAML format and activate them in your environment via the Dynatrace Hub.
Dynatrace connects straight to the Prometheus exporters on your systems. It’s easy—no intermediaries and no redundant moving parts. You control which metrics are scraped, so you don’t need to worry about redundant metrics.
Alternatively, if you’re already using a Prometheus Server to gather data from your distributed systems, you can now seamlessly make this data work for you in Dynatrace as well—use your Prometheus server as the endpoint for scraping metrics.
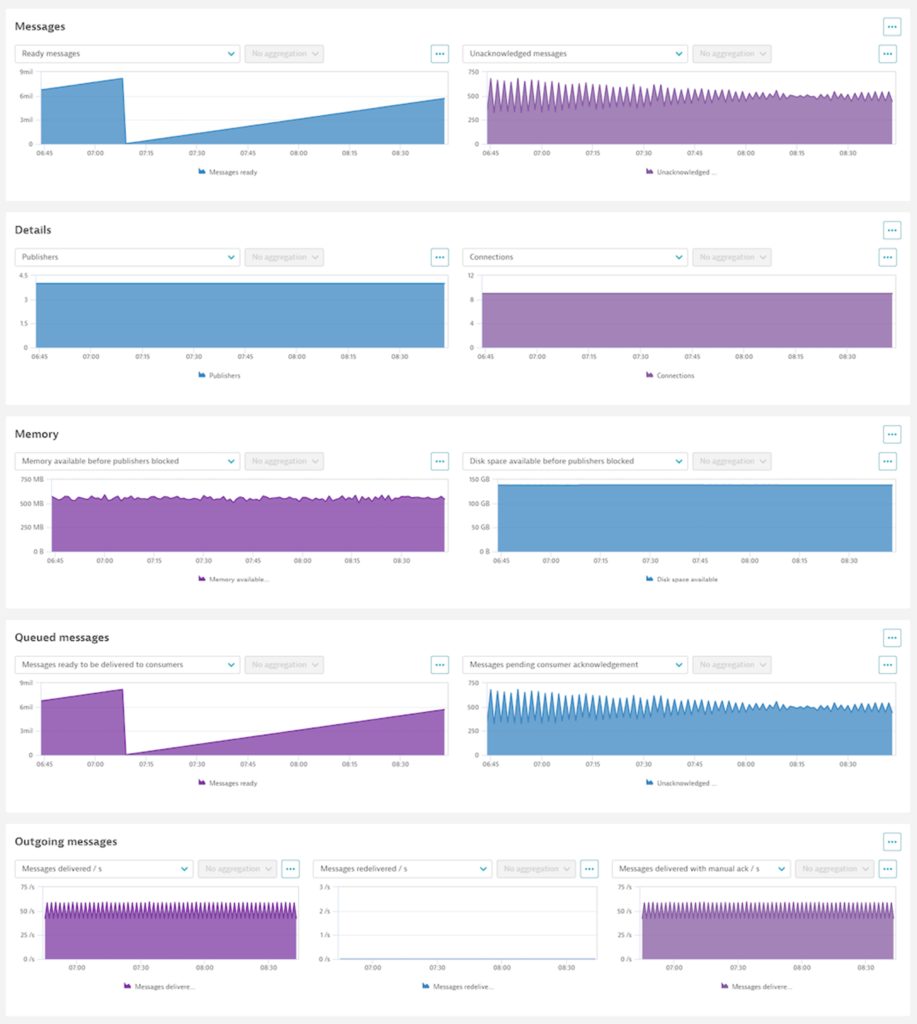
Showcase: Intelligent observability for RabbitMQ with Prometheus metrics
The RabbitMQ Prometheus Extension showcases the capabilities of the new extensions and can be used as a template to jumpstart creation of your own extensions.
This extension enables you to monitor RabbitMQ outside of Kubernetes with data obtained either from a Prometheus server or directly from a RabbitMQ Prometheus exporter. By monitoring specific RabbitMQ nodes, you can easily identify and mitigate performance issues. Moreover, you can effortlessly adapt this extension’s capabilities to your specific use cases.
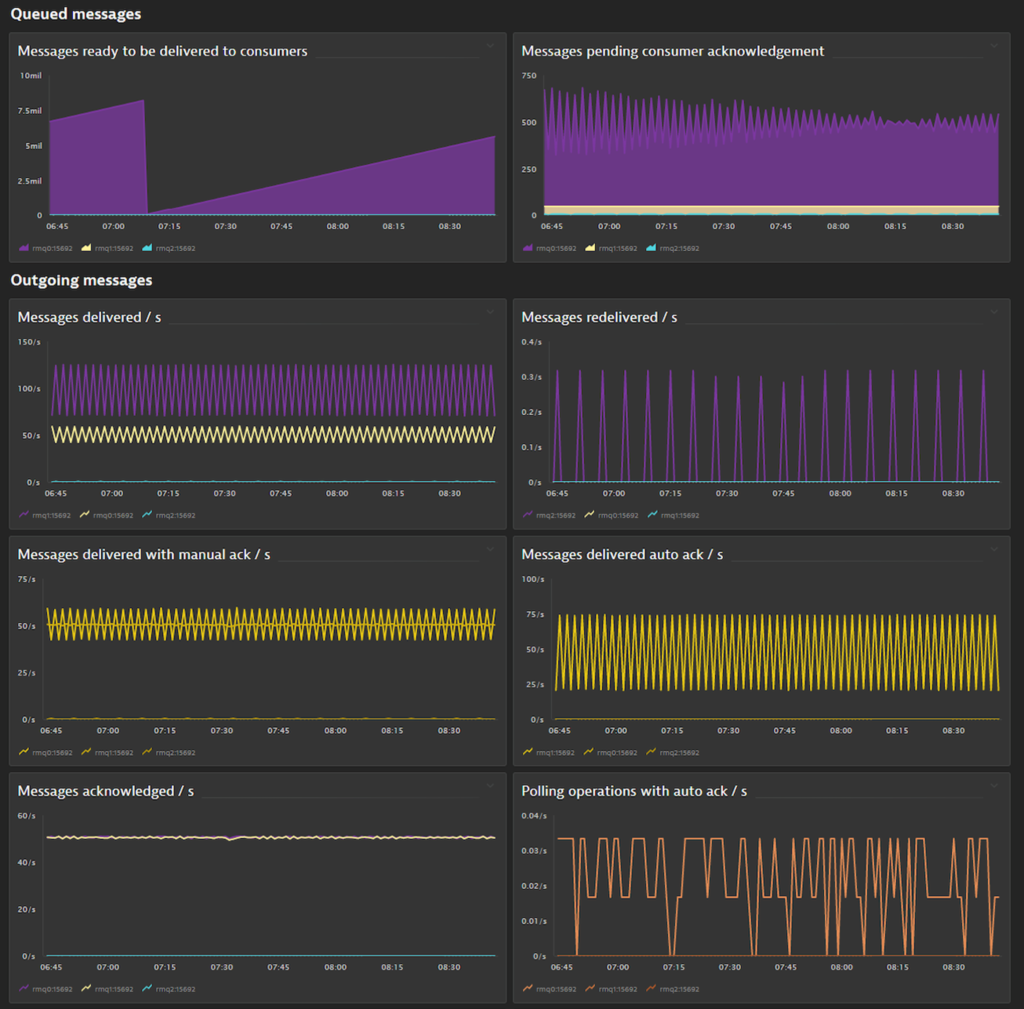
The extension carries all the configurations you need to analyze any possible problems or metric anomalies. As soon as a problem is detected, you have all the tools needed to dive deep and analyze the root cause on the Unified Analysis page. Everything is presented in the context of your RabbitMQ topology, both host and instance.
This extension package contains:
- The Prometheus data source configuration
- Customizable dashboard
- Specialized Unified Analysis page
- Topology definition and entity extraction rules
- Predefined alerts
Get started now!
Dynatrace makes it radically simple to ingest all the monitoring data you need by integrating with a wide variety of platforms, applications, programming languages, and data formats.
Setting up a Dynatrace Extension to scrape Prometheus endpoints allows you to monitor all your instrumented applications together with all the infrastructure components and services already integrated into Dynatrace.
We’re further extending the support of extensions for additional protocols and technologies, and improving the process of creating extensions, so be sure to stay tuned.
To start leveraging your Prometheus metrics in Dynatrace, please visit:
If you aren’t a Dynatrace user, consider signing up for a free trial to bring all your monitoring data into one platform.


Looking for answers?
Start a new discussion or ask for help in our Q&A forum.
Go to forum