
This guest blog is authored by Raphael Pionke, DevOps Engineer at T-Systems MMS. Credits on content go to him and the work he has been doing around performance & resiliency testing automation. I, Andreas Grabner, helped to bring the blog to life!
Our Application Performance Management (APM) and load test team at T-Systems MMS helps our customers reduce the risk of failed releases. To do so we have successfully established AI-based White box load and resiliency testing with JMeter and Dynatrace, helping identify and resolve major performance and scalability problems in recent projects before deploying to production.
In recent years, customer projects have moved towards complex cloud architectures, including dozens of microservices and different technology stacks which are challenging to develop, maintain, and optimize for resiliency. Therefore, we implemented Dynatrace in almost all major applications for our customers to gain visibility from end-user to code-level and to reduce time with problem fixing and pro-active scalability optimizations by using Dynatrace’s AI-based root cause analysis.
Our customers usually involve us 2-4 weeks before the production release. While this seems very late in the development cycle, our white-box release readiness validation approach allows us to point out concrete recommendations for fixing scalability bottlenecks as well as performance and resiliency improvements.
Black box load testing, where load gets generated against a system you don’t get any insights from while putting it under load, is unimaginable nowadays. Any testing that’s done without getting insights with an observability platform or monitoring solution ends up consuming too much time to analyze problems. It also lacks automation capabilities due to missing data and therefore doesn’t scale. Our solution to modernize this legacy approach is an approach we call white box testing. In white-box testing, we combine open-source load testing tools such as JMeter with Dynatrace’s observability and analytics capabilities. This allows us to provide our services to customers with a focus on these three key pillars:
- Scalability: Our solution uses scalable cloud infrastructure.
- Automation: Single load test executions can be repeated and tracked. Each step is automated from provisioning infrastructure to problem analysis.
- Transparency: We rely on deep insights Dynatrace provides, including distributed tracing of single requests.
Now let’s jump into more technical details on how our solution works and how we connect JMeter with Dynatrace to enable automated root cause detection and resiliency validation:
Step 1: Integrating JMeter with Dynatrace
The Dynatrace documentation and video tutorials give a good overview of integrating any HTTP-based testing tool with Dynatrace. Here’s how we have implemented and extended those practices:
Test context through web request header
We first add the “x-dynatrace-test” header to each request, which contains the current test step and thread group/use case name:
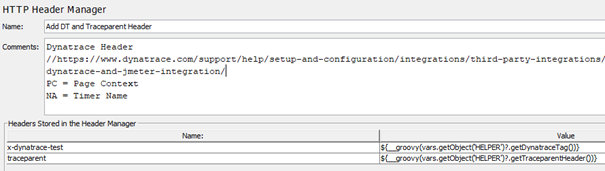
This header is parsed by Dynatrace and can be used during analysis to differentiate between load test requests and other requests (e.g., from other test tools or real users).
Leveraging the W3C Trace context header
While the test step, use case, and thread group name context are helpful we also want to speed up the analysis of individual requests that fail. When JMeter reports an error, it should only be a single click to analyze the captured distributed trace (a Dynatrace PurePath).
A decent solution is the W3C Trace context standard, created by Dynatrace, Google, Microsoft, and others. This request header consists of different components to uniquely identify each individual section of an end-to-end distributed trace. In our case, the parent id and the trace ID were the most important ones.
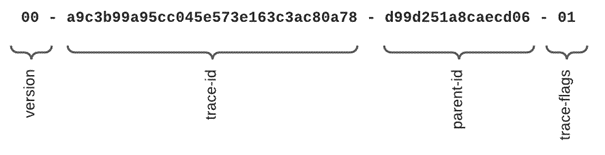
We generate a unique trace ID for every single request across all threads and JMeter agents. On one side we add this value as an additional HTTP header that is then picked up by Dynatrace. On the other side we save this trace ID together with the failed request and other meta information (screenshot, timestamp, etc.) to form part of our test results:
{
  "TimeStamp": "2021-11-24 14:11:00",
  "VUID": "VU-4",
  "Sample": "0010_Startseite_Labelkauf_RT",
  "ThreadGroup": "Labelkauf - Basic load",
  "APM-TracingId": "00-19c0383f590caeebffbaa09b819f50bd-1637762145174fff-01",
  "SamplerClass": "org.apache.jmeter.protocol.java.sampler.JSR223Sampler",
  "CurrentUrl": "https://mycompany.com/send-parcel/gw/restweb/nepal/portal.html?type=ShipmentEditorProductSelection",
  "failedOnLabeledWebElement": "Section fuer MyCompany Application",
  "Screenshot": "Labelkauf/0010_Startseite_Labelkauf_RT-20211124-141101-VU4-10.175.18.82.png",
  "responseCode": "500",
  "responseMessage": "javax.script.ScriptException: org.openqa.selenium.TimeoutException: Expected condition failed: waiting for visibility of element located by By.cssSelector: section.mm_section.mm_section-primary.position-relative (tried for 20 second(s) with 500 milliseconds interval)",
  "responseData": ""
}
This tracing ID can then be used in the Distributed Traces view in Dynatrace to look up the correlating Dynatrace PurePath for that W3C Trace Context ID. With another click, Dynatrace shows us the full distributed trace (=Dynatrace PurePath) making it easy to identify why a request was slow or failing and which backend services or databases were involved:
The error log of the JMeter load test contains a message about a missing element, which can be traced down to an exception in the application code with the help of the W3C Trace Context Id.
Dynatrace back-end listener for JMeter:
Dynatrace engineering open sourced a backend listener for JMeter that they use internally. It automatically sends JMeter metrics to the Dynatrace cluster via the Metrics Ingest API. These metrics can be used to validate the load test plan or target load and to correlate between different application metrics. The screenshot below shows a Dynatrace dashboard showing JMeter metrics alongside metrics natively captured by Dynatrace:
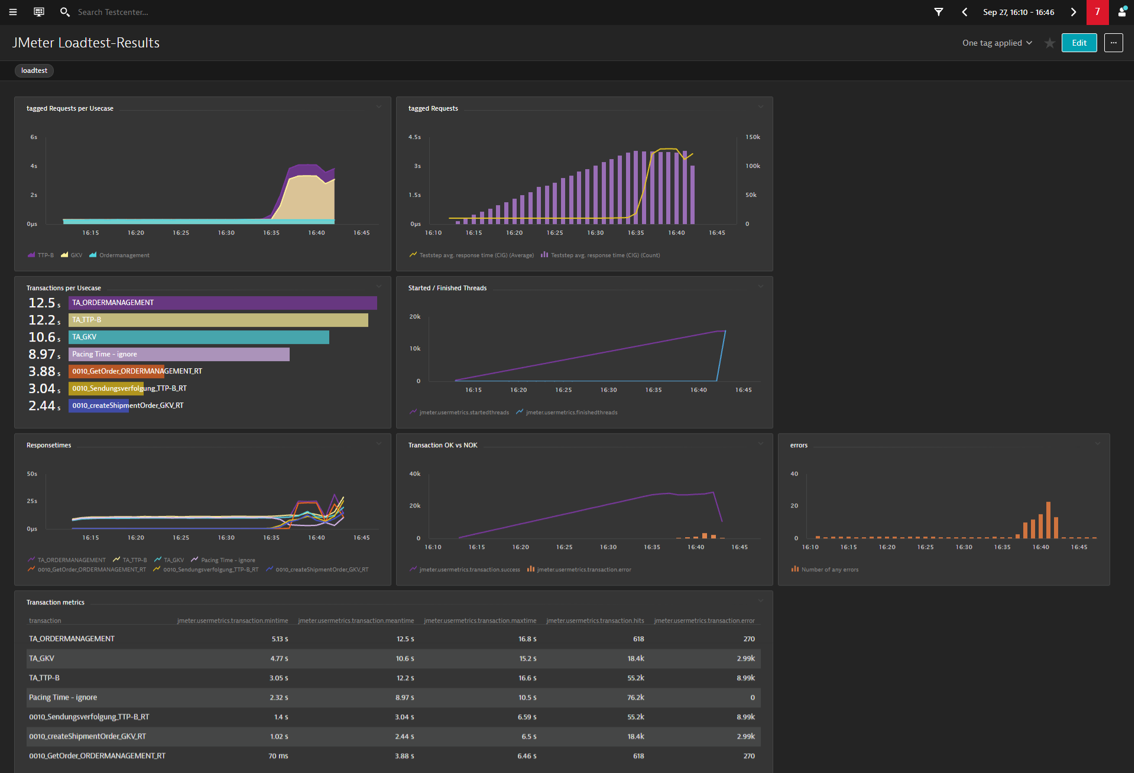
As you can see here, we have all metrics on one single dashboard and can share them at once together with all team members. In this example, the application has reached its limit near the 90 percent load.
From such kind of dashboard, we can easily read out the tagged web requests for each use case with response time and count. In the given example, the goal was to find the maximum of concurrent requests per hour and to investigate the response time behavior over the test run time. From the graphs can be read that the response times have increased significantly at the end of the test.
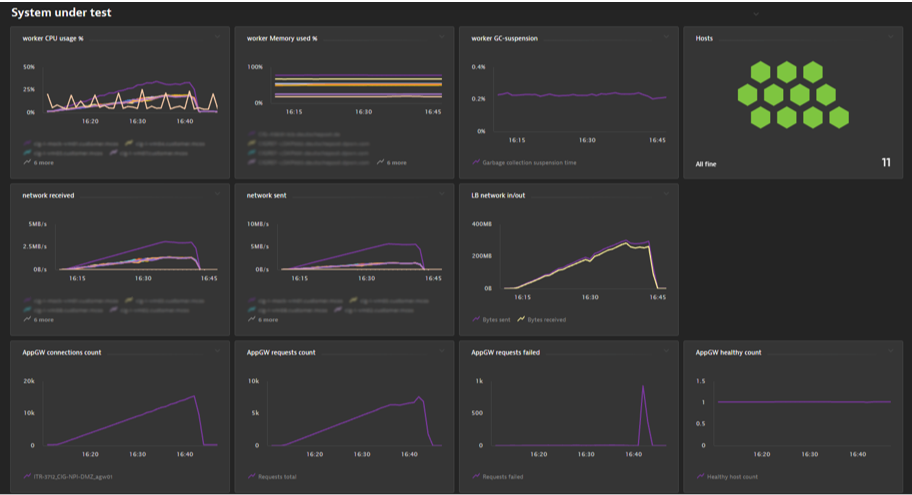
The dashboard combines the load test metrics from JMeter with CPU/Memory/JVM metrics for the JMeter infrastructure (Agents and Controller) and the application and infrastructure metrics captured by Dynatrace. The application under test uses an Azure Application Gateway and a load balancer in front of the worker nodes, which are also part of this dashboard as Dynatrace provides automated support for pulling in metrics from cloud services such as Azure.
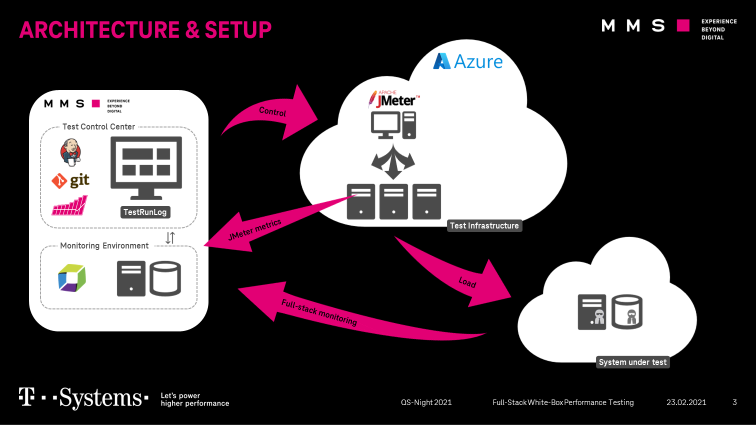
The white box load testing project setup
After explaining how we integrate JMeter with Dynatrace and what we can do with the data once it is in Dynatrace let’s switch over to explain how we automate performance test execution and analysis as part of our load testing projects. The following illustration gives an overview of our architecture and setup:
Each load test project is defined in a separate git repository with all necessary metainformation:
- Property files for workloads,
- Test data,
- Test plan and
- a Jenkinsfile.
Our Jenkins instance has a seeder job, which creates the jobs by reading all git repositories automatically.
Terraform and Ansible to provision infrastructure and configure Dynatrace
The test infrastructure and the Dynatrace configuration are provisioned by terraform. The “azurerm” terraform provider handles all infrastructure-related tasks. The new Dynatrace terraform provider (https://github.com/dynatrace-oss/terraform-provider-dynatrace) is used to apply all necessary Dynatrace configuration steps:
locals {
  apps = [
    { name : "ABC", zone : "1809_ABC" },
    { name : "DEF", zone : "3328_DEF" }
  ]
}

resource "dynatrace_calculated_service_metric" "teststep-metric" {
  count            = length(local.apps)
  name             = "Teststep avg. response time (${local.apps[count.index].name})"
  enabled          = true
…
 }

resource "dynatrace_calculated_service_metric" "usecase-metric" {
  count            = length(local.apps)
  name             = "UseCase avg. response time (${local.apps[count.index].name})"
  enabled          = true
…
  }

resource "dynatrace_request_attribute" "x-dynatrace-test_NA" {
  name                       = "x-dynatrace-test NA"
  enabled                    = true
…
}

resource "dynatrace_request_attribute" "x-dynatrace-test_PC" {
  name                       = "x-dynatrace-test PC"
  enabled                    = true
…
}

resource "dynatrace_dashboard" "golden_signals" {
  dashboard_metadata {
    name   = "${local.apps[count.index].name} – Jmeter loadtest results"
    owner  = "Dynatrace"
    shared = true
    filter {
      timeframe = "-1h to now"
      management_zone {
        name = local.apps[count.index].zone
      }
    }
  }
}
This file shows how to implement a starter package for each new project.
After creating the test infrastructure, we use Ansible as a configuration management tool to install docker, prepare the Jenkins Agents and the Dynatrace OneAgent.
Test Result Analysis
Each test run is documented in our self-developed test management tool to track configuration changes between different test runs:
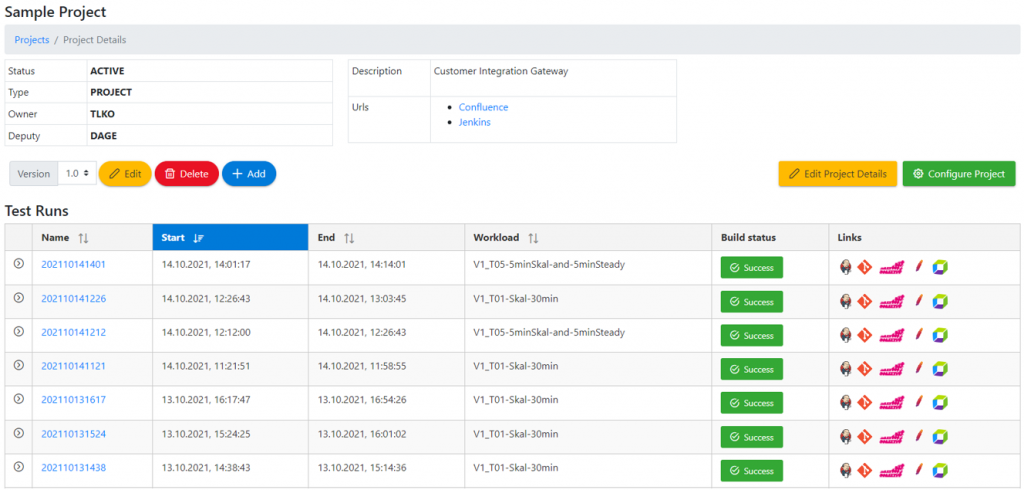
The test management tool we developed can be used to call different user interfaces of our test automation, i.e. Jenkins, Git, JMeter, the Dynatrace dashboard together with the test timeframe and our self-developed ReportEngine test report:
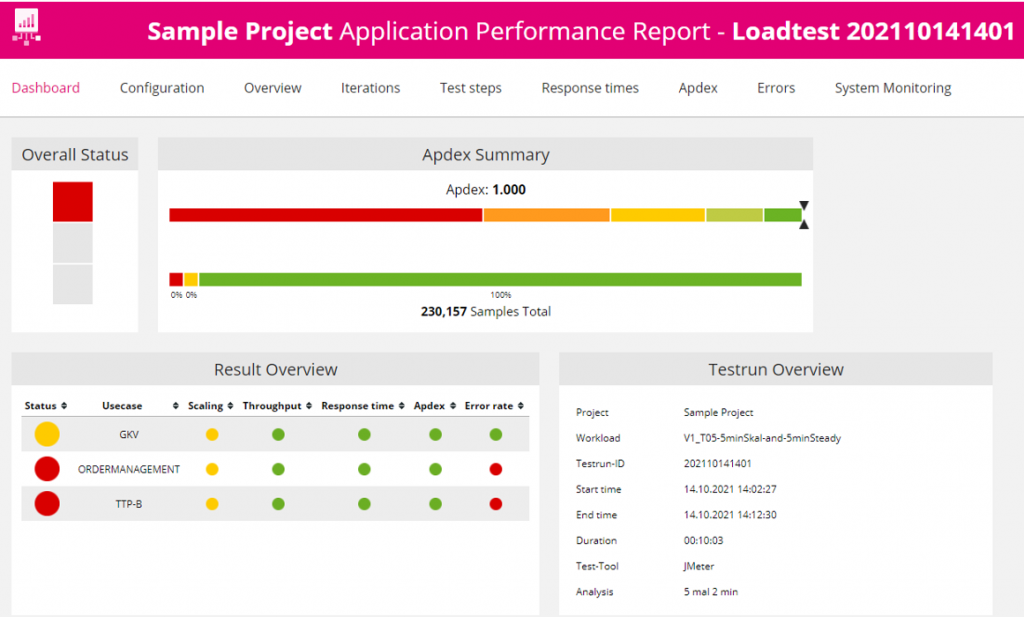
The result overview currently shows data from JMeter split by Use Case by parsing the JLT raw data.
Next Steps: Collaboration on Keptn
We always strive for more and easier-to-manage automation. Therefore, future projects will use a dedicated Jenkins pipeline library to reduce the manageable code in the Jenkinsfiles and to iterate faster.
Some already established and running load test projects are currently migrating to continuous load testing with pipeline integration rather than involving the load test team for manually triggering tests only when publishing major releases.
Our team is also collaborating with Dynatrace to standardize some of this functionality through the open-source project Keptn. At the core, Keptn uses an SLO (Service Level Objective) scoring approach to automate the analysis across multiple metrics (SLIs). This is functionality we intend to better integrate into Jenkins and our reporting capabilities. Furthermore, Keptn solves the interoperability challenges between multiple tools such as configuration management, infrastructure, deployment, testing, and observability tools. As switching or integrating new tools in an automation process is always a lot of work, we expect Keptn to help us lower the automation efforts in our current Jenkins pipelines. As Dynatrace also offers Keptn orchestration capabilities to their enterprise customers as part of their Cloud Automation solution the entry-level barrier for many organizations is very small!
I, Andreas Grabner, want to say Thank you to Raphael Pionke for his work and contribution to the performance engineering community. It was great collaborating on this blog post and I am looking forward to working closer with you on integrating your best practices into Keptn.


Looking for answers?
Start a new discussion or ask for help in our Q&A forum.
Go to forum