
Atlassian tools are a key to success for many organizations when it comes to improving collaboration between their teams, managing projects, automating delivery pipelines or handling customer support requests. Many organizations start small and increase their usage of Atlassian tools such as JIRA, Confluence, ServiceDesk, Bitbucket or OpsGenie as their companies and projects grow. Unfortunately, monitoring and optimizing end user productivity with these tools is too often an afterthought and only comes up in case end users are really feeling the pain.
In my role as technical partner advocate I recently got to visit the Atlassian office in San Francisco. In a meeting with their Technical Architect Team they raised the following questions:
How does Dynatrace help our customers …
- … to become more productive with our products?
- … to ensure success of an upgrade, e.g: Upgrade to latest On-Premise Confluence version?
- … when migrating from On-Premise to our Cloud/SaaS offering?
During that meeting I didn’t have access to a Dynatrace installation monitoring Jira or Confluence but I followed up with a slide deck showing the following use cases based on our own internal installation of Jira and Confluence. In addition to the 3 questions they asked me, I was focused on the following use cases that Dynatrace supports out-of-the-box:
- Understanding End User Behavior
- Optimizing End User Productivity
- Detecting Deployment Problems
- Lowering Operational Costs
- Pro-Active Alerting
Before digging deeper into each use case, have a look at the following animation, which shows me navigating through the real user monitoring data captured when installing a Dynatrace OneAgent on your servers that run your Atlassian tools:
If you happen to use Atlassian’s SaaS-based offering we give you the same end user visibility with our recently announced Dynatrace SaaS-vendor RUM Monitoring.
Now let’s dig into these use cases. Let me show you one-by-one how Dynatrace supports Atlassian users, administrators and operators!
Understanding End User Behavior
End User Behavior is not only great for eCommerce platforms. If your developers spend hours a week in Jira to track their user stories, or if your analysts constantly update project deliverables and documentation in Confluence then it is important to understand how these tools are currently used. Understanding the behavior allows you to start educating team members on aspects they are currently not using or start optimizing workflows where it takes too many steps to complete a task.
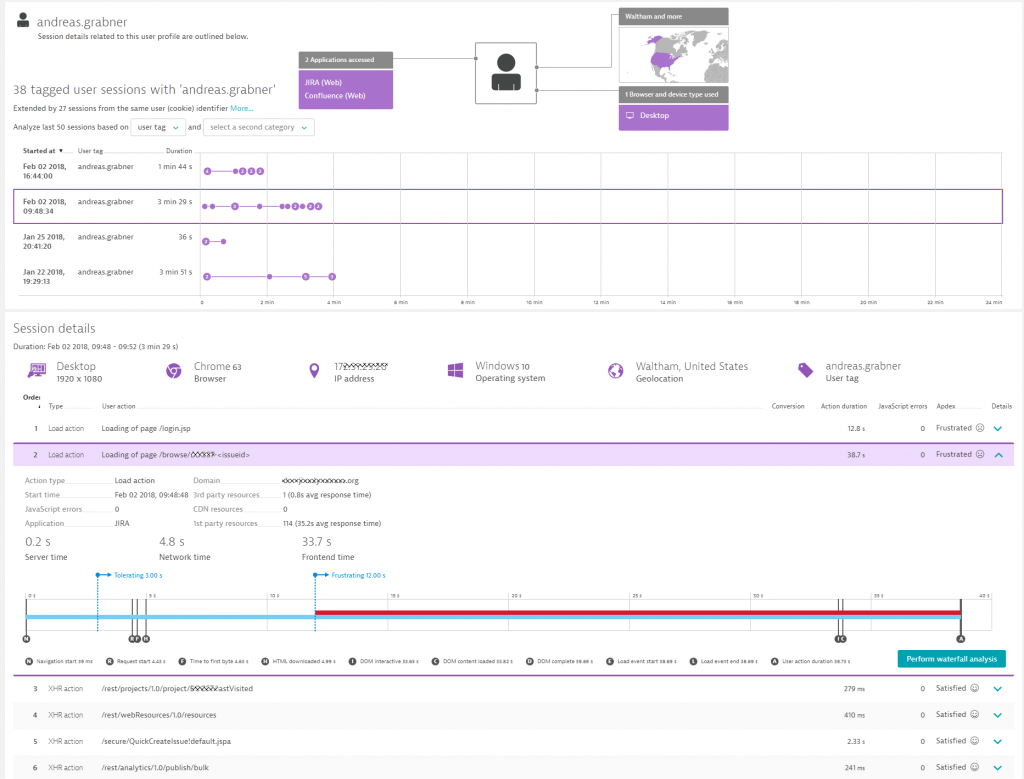
Dynatrace automatically captures every single user session and every single user interaction. That is: every time they browse to your Atlassian tools and interact with the software Dynatrace captures it. The following screenshot shows my user account on Jira and every single browser session I had open over the last few months. I picked the one from February 2nd, showing what I did step-by-step on that Jira instance. Also, it seems I wasn’t that happy as load time was very high (38.7s) to load that particular ticket:
Analyzing individual users is great to review, if somebody complains that “JIRA is really slow today for me”. Taking a step back and looking not only at individual users, but at all users and their actions, allows us to answer questions such as: what are the most frequently visited Confluence spaces or Jira projects? What is the page load time of the most frequented projects and shall we optimize them to reduce the overall time users are waiting to see content?
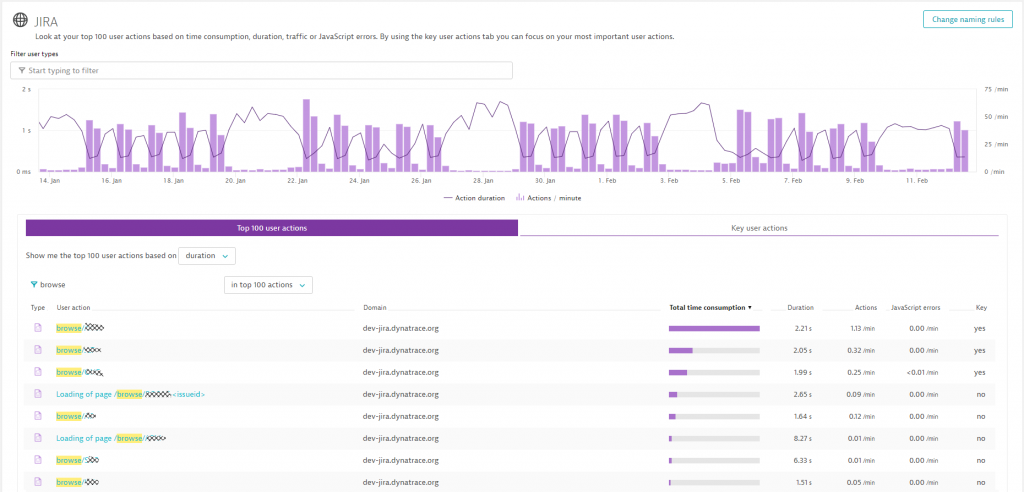
In the following screenshot I asked Dynatrace to give me an overview of those project and ticket pages (/browse/*) where my users spent most of their time (Total time consumption). Seems we should optimize when people browse through our APM Jira project as this is clearly a hotspot:
There are many other interesting questions we can answer:
- Which pages have the highest error rate? And does it prevent users from continuing their workflow?
- What are the top entry point pages? What are the pages users dropped out?
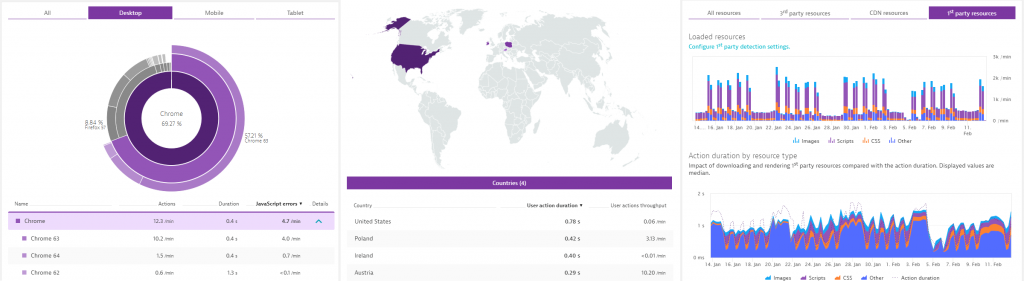
- Which browsers and devices are used to access Atlassian tools? Are they on the supported list?
- Where do our users access our software from? Do we support remote locations good enough considering we have very large attachments or images?
Optimizing End User Productivity
I think I already hinted at a lot of data Dynatrace provides to start optimizing your End User Productivity. It is about optimizing page load times for frequently visited pages, fixing JavaScript errors and educating them on using supported browsers and devices from locations that have enough bandwidth to support the type of content you host on your sites. The following shows you how Dynatrace gives you full Waterfall Analysis of each individual page on your Atlassian services and how you can navigate through individual or aggregated waterfalls (across multiple user sessions) to learn why these pages are loading slow. This is like sitting on each of your user’s browsers and opening the browser developer tools. Last step in the following animation also shows you the drill down capabilities to the backend services in case slow response is because of slow server responses caused by slow code execution:
If you want to learn more about optimizing user experience and therefore productivity check out what you can do with our Real User and Synthetic Monitoring data.
Detecting Deployment Problems
So, what’s a deployment problem? That’s when you deploy tools and don’t properly follow deployment or scaling guidelines, when you make configuration mistakes or over time, run into a situation where you run your software next to some other software and both were never meant to share the same underlying infrastructure or shared services, such as a database. Such mistakes often either result in bad performance or failing requests. It’s not always obvious that you are suffering from these problems. Why? Because not every single user always complains, but simply changes their behavior – OR – because not every problem is visible to your end users, e.g.: a failing AJAX call that refreshes a status on your screen.
Dynatrace gives us several options to detect these types of problems. First, the Dynatrace AI simply automates the detection of any problems that either impacts your end users (High Response Time, Failure Rate, Outage …) or your infrastructure (High CPU, Memory, Disk, Network …). Dynatrace also monitors your log files – and in this case the log files written by the Atlassian tools and automatically detects in case something in these logs indicates an error. Here are a couple of examples for you as seen on our Jira & Confluence installation:
#1: Somebody deleted a Jira User we use for automated scripts
#2: Database Restart results in several users not being able to open their tickets
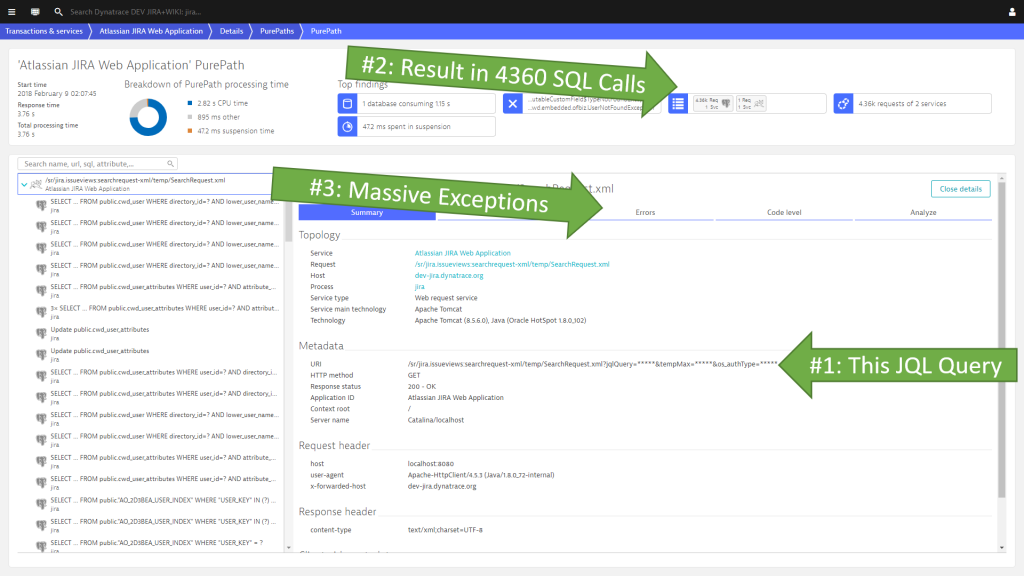
#3: Bad JQL Query results in massive load on database and internal exceptions
Lowering Operational Costs
There are probably more reasons why operational costs might be too high – but the top two that come to mind are:
- You run on overprovisioned hardware you don’t need and therefore pay too much
- You have configuration and deployment problems causing higher resource consumption than necessary
With the Dynatrace OneAgent we automatically monitor your end users, services and also your underlying infrastructure. This allows us to see how many resources your services are really consuming during low and peak loads. That’s valuable input to validate whether you are running on over- or under- provisioned hardware.
#1: What’s our real CPU, Memory, Traffic for JIRA, Postgres and Nginx?
#2: Where are our CPU Hotspots that we can optimize?
Other areas of reducing operation costs have been shown earlier in this post, e.g.: Optimizing your pages by reducing size of resources (images, CSS, JavaScript), leverage browser caching as well as optimizing searches to have less impact on the database!
Pro-Active Alerting & Self-Healing
It’s good to know we have all this data to look at when we want to optimize our current installation of Atlassian products. The data we have also gives us more confidence in case we upgrade or migrate to see how that change has impacted our end users or SLAs.
As more of you run 24/7 operations, you must rely on systems that don’t only get optimized if somebody looks at them. They need to be available all the time to do your job. But, what if Jira or Confluence goes down on a weekend or during your night shift? How can you fix the problem then, if the Atlassian Expert is not around?
The Dynatrace AI is the answer to that question. Thanks to the automated anomaly and root cause detection we can not only give pre-analyzed data to your Atlassian Experts, we can integrate these problems in your remediation workflow, e.g.: create a Jira ServiceDesk ticket in case your Confluence, JIRA, Bamboo or OpsGenie services are not working as expected.
We can also go a step further. Thanks to the Automation API all the data you see in the Dynatrace Web UI is also accessible through REST. This allows you to fully automate remediation actions. For example, Dynatrace detects Jira having issues connecting to PostgreSQL because another hung process is filling up disk space. You can write an auto-remediation script that Dynatrace triggers for you that automatically kills that process, cleans the disk and makes sure PostgreSQL is running smoothly again.
For more information on pro-active alerting and self-healing check out my blog post on “Self-Healing and Auto-Remediation with Dynatrace”. Watch the following animation that shows you what is possible:
Give it a try! It only takes 5 Minutes to install!
I hope this blog post gave you a good overview of the capabilities of Dynatrace when it comes to monitoring and optimizing the tools you need in your day to day life to keep your business running. All it takes is 3 steps and 5 minutes on your end
- Sign-up for the Dynatrace SaaS Trial (or ask us about our On-Premise offering)
- Install the Dynatrace OneAgent on your servers
- Start your analysis! It’s as simpl as that!
If you have any questions don’t hesitate to ask. We are a proud Atlassian partner and have other partners, such as Addteq, that help our joint customers to get the most out of their investment!


Looking for answers?
Start a new discussion or ask for help in our Q&A forum.
Go to forum