
Aditya Ranjan, Cloud Enthusiast and Application Performance Specialist, has been helping companies like UBS, Länsförsäkringar and Adecco Group, as a consultant to improve their application performance delivery. In his current work at HCL one of his focus points was to redefine the continuous delivery feedback loop by applying Dynatrace on SAP Cloud Foundry and leveraging the “power of the Dynatrace UFO” to radiate quality and performance feedback to the responsible engineering teams at HCL. Now let’s pass it over to Aditya to explain his recent experience:
“Good application, More business. Bad application, NO Business.”
The first time when I heard this, I didn’t realize the gravity of it until I read about how Uber’s driver app was frequently crashing in United States. Though Uber was aware of this, they were still working on the fix. But today’s applications are no longer confined to one geography, nor is the business. With technology connecting one part of Earth with others, the availability/performance of the application becomes essential to keep the business running.
And this is just one part of it. A business doesn’t always run on availability of the service, but also on the value add it provides …. read features. Pre-2000, I had a Sony Walkman, sometime after 2003 I was using an iPod and now an iPhone. Just as it started with waterfall, then agile and currently we have DevOps. New features at a faster pace is the name of the game.
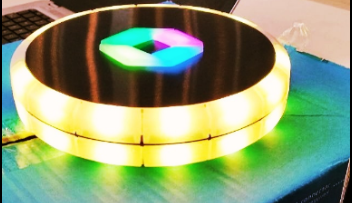
If you are somebody who codes and pushes multiple builds a day, but at the same time is concerned about its quality and the health of the existing environment, Dynatrace along with the Pipeline State UFO is made just for you. Dynatrace provides 3rd generation application monitoring solutions to ensure and enhance digital experience across all channels (web, non-web, mobile), platforms (SaaS, PaaS, IaaS) and technology stacks (Java, .NET, Node, Serverless, …). Dynatrace also integrates with your automated testing tools and acts as a Quality Gate in your Continuous Delivery pipeline. The Dynatrace UFO visualizes the quality state of the end-to-end delivery pipeline. With the help of different colors, rotating and morphing effects, it shows the status of the current build being pushed through the pipeline as well as the current health state of your production system.
Continuous Delivery on SAP Cloud Foundry with Dynatrace
At HCL, we have been on our digital transformation journey for quite some time. At the time when SAP announced its association with Cloud Foundry, we were evaluating various PaaS offering. The reason we narrowed it down to SAP CF was due to its flexibility to extend their ERP solution with custom-developed apps. It allowed us to write extensions that leveraged the business data managed by SAP, stored in SAP Hana. These were some of the deciding factors to move forward with SAP.
Insight #1: How we build on top of SAP CF
The first custom extension application we developed on SAP CF was developed using Node.js. We also decided to leverage SAP IDE Git client as to link to our source code repository.
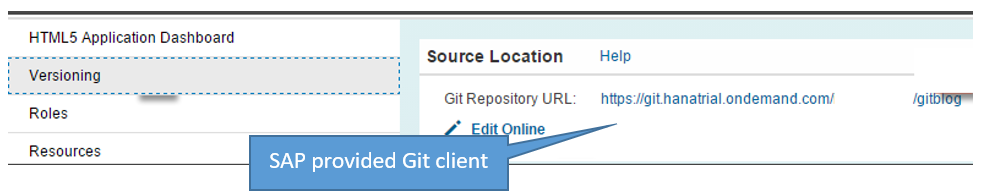
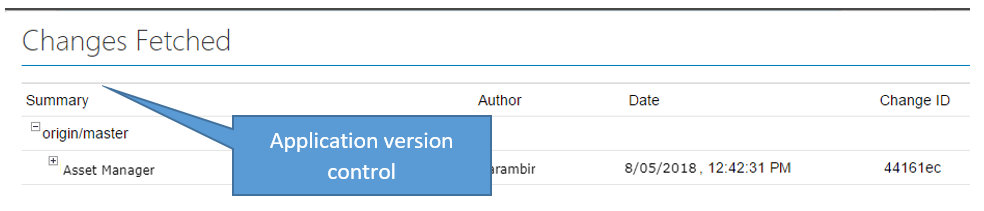
The Git client makes it easy to fetch the latest version of code changes from other developers in our distributed team:
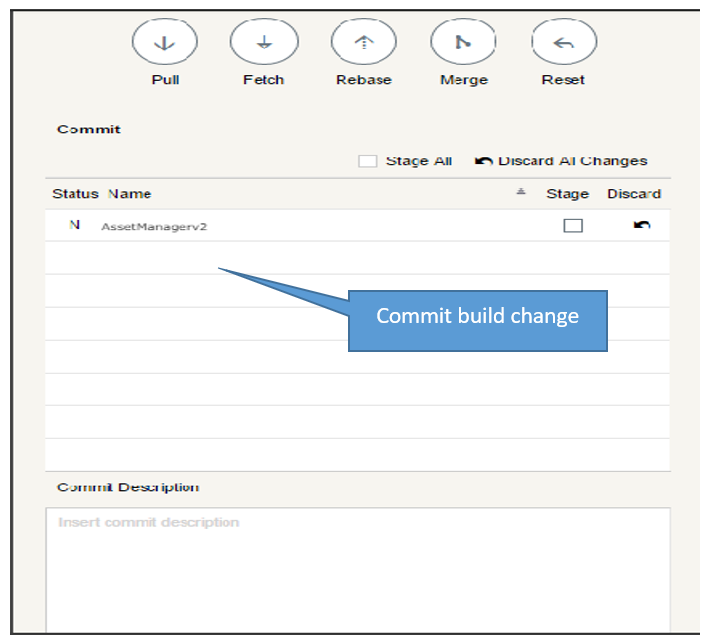
If a developer has local changes that haven’t been committed to origin/master yet the Git client makes it easy to push that change to the remote branch:
Insight #2: Full Stack Monitoring with Dynatrace
Every deployment of any application or extension should automatically be monitored by Dynatrace. Dynatrace provides different ways to monitor environments. If you control the underlying infrastructure the preferred way is to simply install the Dynatrace OneAgent on all hosts. For Cloud Foundry Dynatrace also offers a Bosh-Add On which automates the installation of OneAgents every time Cloud Foundry deploys applications.
In our case we run our application on top of SAP Cloud Foundry. The preferred way for this setup is to setup the Dynatrace OneAgent for PaaS:
Step 1: Generate your PaaS token in Dynatrace.

Step 2: Create a user-provided service in SAP Cloud Foundry
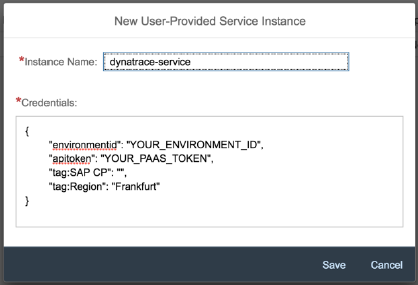
Step 3: Bind the service to your application.
If you are, just as we are, running a Node.js app on SAP CF, make sure to use the Dynatrace Node.js Buildpack for Cloud Foundry. For other technologies check with the Dynatrace Documentation on How do I monitor Cloud Foundry applications?
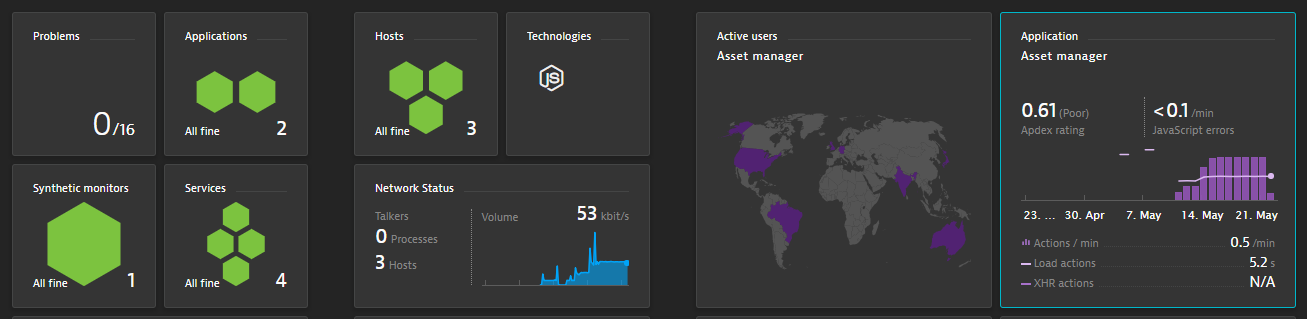
This is it! Your monitoring is up and running! The following shows the default Dynatrace dashboard showing application, service and end-user health. As Dynatrace automatically starts multi-dimensional baselining we will be informed about any potential problems that a deployment may have on individual service or application health or on end-user experience!
Insight #3: Connecting the Dynatrace UFO
Even though we like looking at the Dynatrace dashboards, we rather want to have our Dynatrace UFO “radiate” the important health status to our different teams. Its easy peezy to enable that integration 😊:
Step 1: Connect the UFO to a 2000mA USB charging adapter
Step 2: Configure UFO Wi-Fi settings so that the UFO connects to your network.
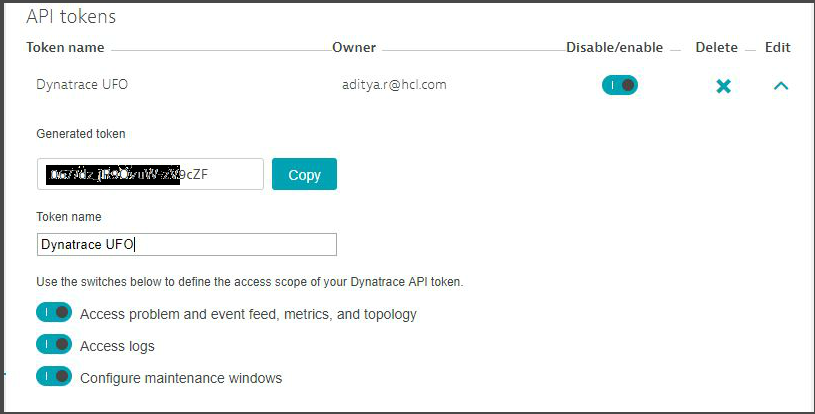
Step 3: Integrate UFO with Dynatrace using the API key token.
The UFO will poll the Dynatrace Problem REST API every 30 seconds. Depending on the number and impact level of your open problems the colors will light up like this:
- green: no open problem
- all red: 1 open problem affecting end users
- all purple: 1 open problem affecting services
- all blue: 1 open problem affecting infrastructure only
- 2 or 3 red segments rotating: 2, 3 or more opten problems affecting end users
- 2 or 3 red purple rotating: 1 open problem affecting services.
- 2 or 3 red blue rotating: 1 open problem affecting infrastructure only
- mixtures of above, where use impact where severity is in the order of user impact, services, infrastructure
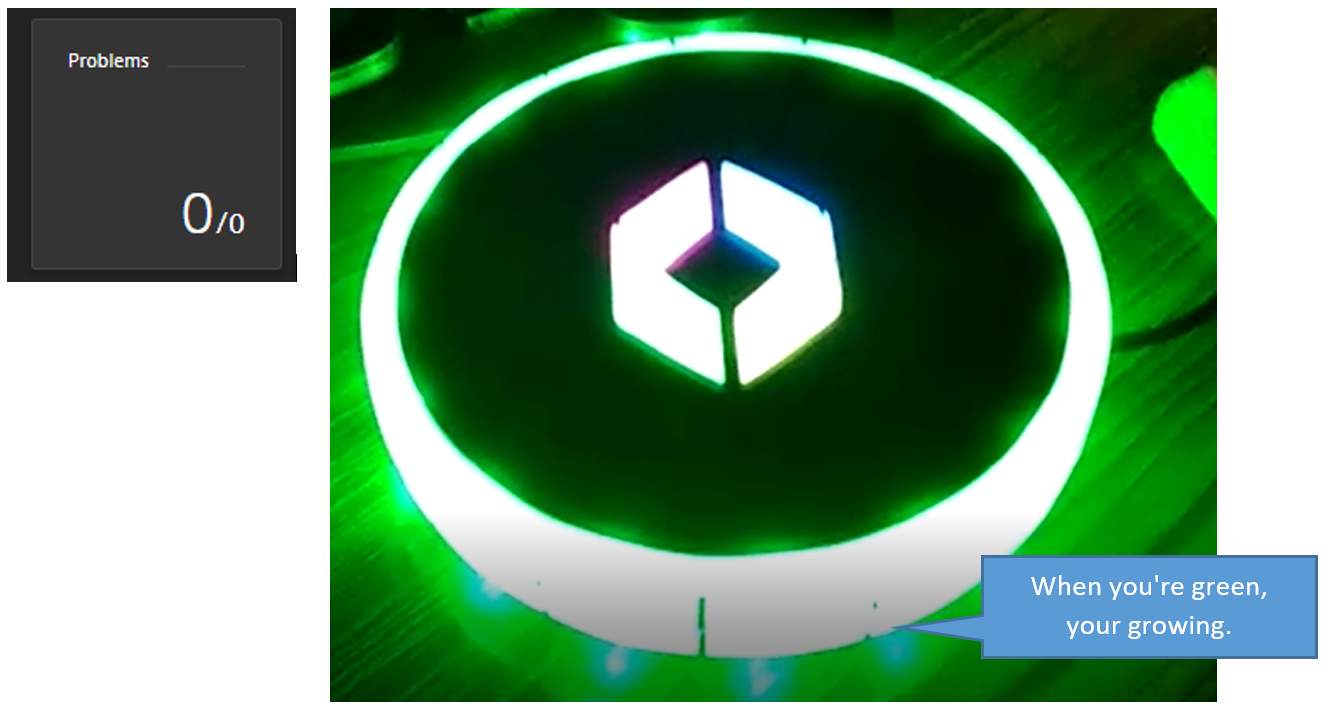
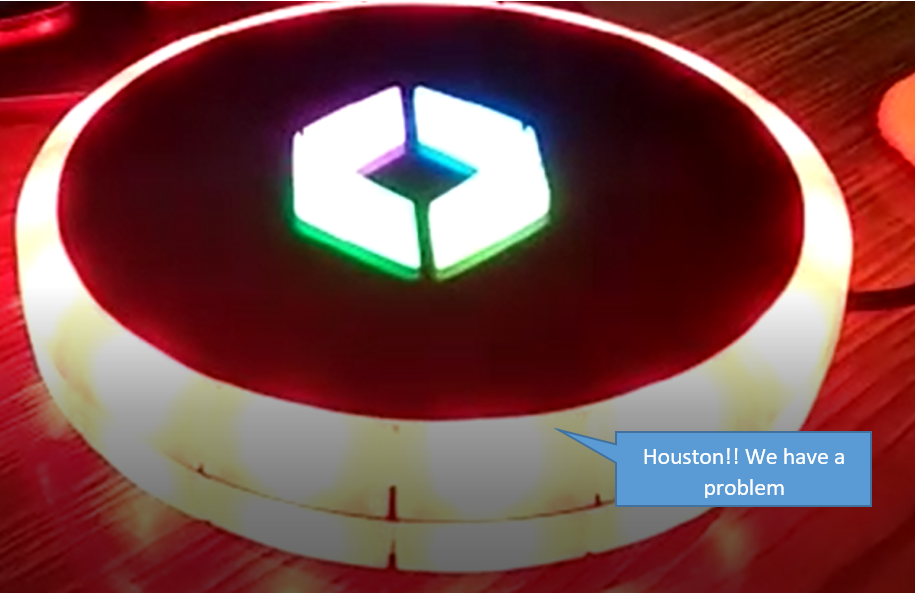
So, when your environment is all healthy and has no open problem, UFO will turn all green.
If we deploy a bad build we can rely on Dynatrace to make us aware of any potential impact. In our scenario, we rely both on Dynatrace Real User Monitoring but also leverage Dynatrace Synthetic as an early warning indicator especially after a deployment. In case there is a problem with a deployment, Dynatrace AI automatically detects it and opens a new problem ticket with all relevant information. As the UFO polls the currently opened problems, the UFO colors immediately reflect the health status of your system.
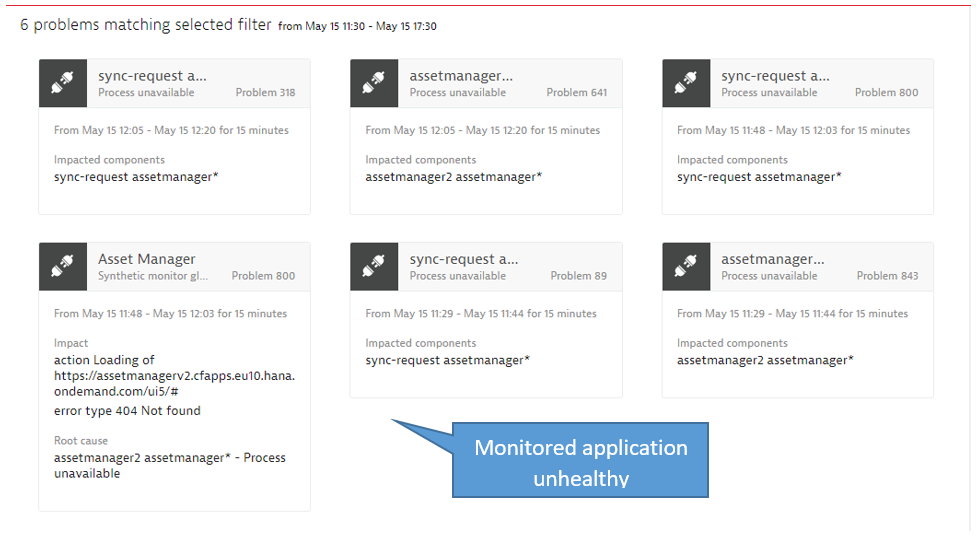
If the UFO lights up in RED, all engineers can immediately draw their attention to the problem ticket details. Learning more about impact the actual root cause:
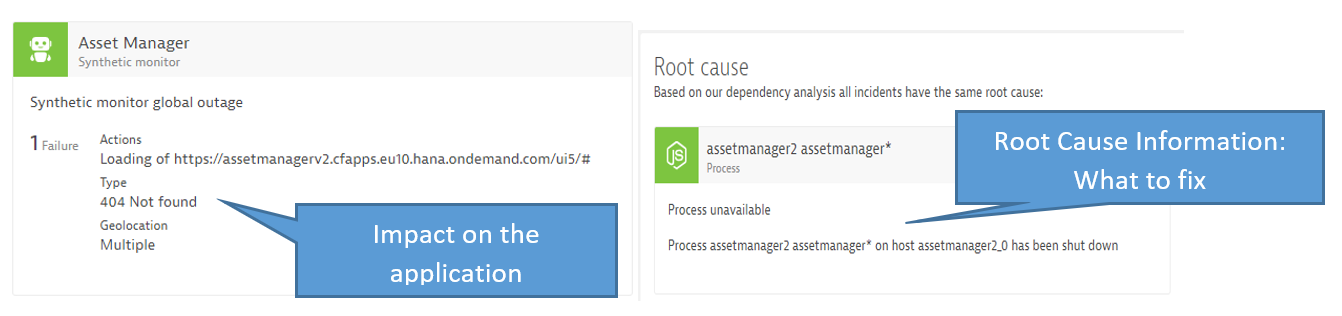
Knowing the problem, such as an accidentally shutdown process, makes it easy to fix. Once fixed, Dynatrace automatically detects the positive impact of that fix, e.g.: our Synthetic tests and our Real Users are experiencing normal performance and availability of that application. Once the impact is eliminated, Dynatrace will close the problem ticket which also causes the UFO to go back to green (the desired state). The ticket itself gives us more insights into how the fix was applied and how it brought the application back to its normal state.

Continuous Feedback Redefined! It worked for us!
For some, the UFO may look like a little toy, but it had a major impact on how we deal with quality and system health impact that our code changes have. It is easy to ignore email alerts in your local inbox – but it is hard to ignore a red flashing light that can be seen by everyone in the office. If it is RED, our teams start collaborating to find a quick solution to the current problem. It is part of the cultural shift that we have heard the folks at Dynatrace talk about when they introduced the UFO years ago in their engineering labs.


Looking for answers?
Start a new discussion or ask for help in our Q&A forum.
Go to forum