
Monitoring and observability are important topics for any developer, architect, or Site Reliability Engineer (SRE), and this holds true independent of the language or runtime of choice.
In my role as Developer and DevOps Advocate, I have the luxury of interacting with many different people on a daily basis. Whether these are open-source developers I meet through my work on the CNCF project Keptn or Dynatrace partners and customers who I try to help get the most out of their investment in our Software Intelligence platform.
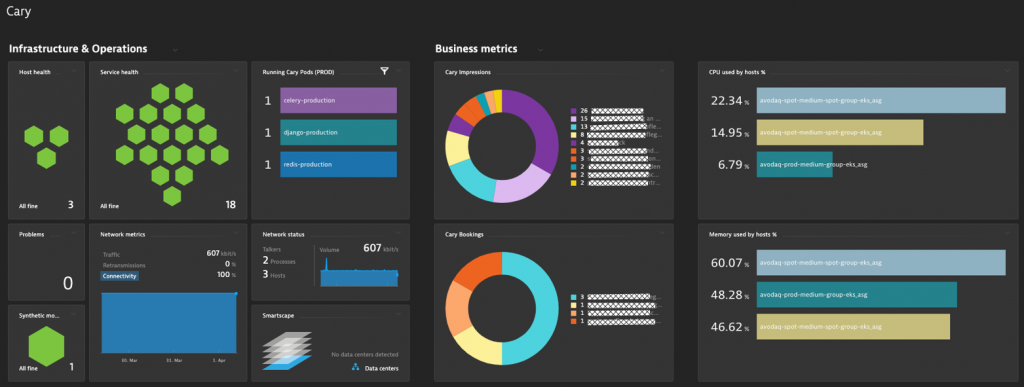
The idea, and most of the content for this blog, comes from one of our Partners; Stephan Dannewitz, DevOps & Site Reliability Engineer at avodaq AG. In a recent exchange of ours, he showed me how he enabled monitoring & observability for https://cary.video – an easy-to-use video chat platform targeted towards care facilities. CARY is a Python-based App using the Django Web Framework. The image below is of a Dynatrace dashboard Stephan created for the CARY team, showing key business metrics as well as infrastructure health metrics in a single place. All data is captured through the Dynatrace OneAgent that is deployed on their k8s clusters where CARY runs.
One of the reasons Stephan showed me this project was because he was an early adopter of the auto instrumentation capabilities Dynatrace brought to the Python runtime a couple of months ago. David Lopes, Global Extension Architect at Dynatrace, was instrumental for this type of instrumentation, which he also blogged about in End-to-End request monitoring for popular Python frameworks.
Following David’s instructions on how to use the open source OneAgent SDK for Python Auto Instrumentation, Stephan has now automated distributed tracing in production getting PurePaths for every request that’s processed by CARY. All of this without any Python code modifications. This is great for his developers when they do troubleshoot and the source for the business metrics such as feature usage, top users, …:
If you’re developing, testing, operating, or if you’re a business owner of a Python-based application then I encourage you to read the rest of the blog. Stephan walks us through the steps and some best practices to get automated observability into your apps using Dynatrace.
Step 1: Install OneAgent
With Dynatrace everything starts with installing a OneAgent. You can install a OneAgent on your local workstations, in your VMs, your PaaS or roll it out on your OpenShift or k8s clusters through an Operator. For Stephan, it was installing the OneAgent Operator on k8s which automatically takes care of a full rollout of OneAgent on all k8s nodes giving full visibility into k8s itself, all workloads, pods, logs.
For more information check out Dynatrace OneAgent.
Step 2: Auto-Instrument your Python Code
As mentioned at the start, the OneAgent SDK for Python Auto-instrumentation enables auto-instrumentation of your Python code (starting with autodynatrace 1.0.61) without any required code changes. Python has a lot of special frameworks though. Many are supported by auto-instrumentation and are listed under supported technologies. Those special frameworks – such as Django – require some additional settings to be auto-instrumented!
To enable auto-instrumentation for any Python set the environment variable AUTOWRAPT_BOOTSTRAP=autodynatrace. That’s it!
This gives you full monitoring of your Python code including common technologies such as Flask, FastAPI or Tornado!
Guidance for Django
For Django in particular – which is what Stephan is dealing with – you just add “autodynatrace.wrappers.django” to the INSTALLED_APPS. That’s it!
There’s a good list of additional environment variables that control how the auto-instrumentation works, e.g., AUTODYNATRACE_CAPTURE_HEADERS allows you to have Dynatrace OneAgent capture all request headers of incoming web requests.
Stephan shared his full list of configuration changes for all of you who also want to have auto-instrumentation for Django:
Set the following Environment Variables:
- AUTOWRAPT_BOOTSTRAP=autodynatrace (required!)
- AUTODYNATRACE_FORKABLE=true (if you use processes that have multiple workers)
- AUTODYNATRACE_CAPTURE_HEADERS=true
Tip from Stephan: In their case it was necessary to enable monitoring of all gunicorn workers by passing the flag –preload when launching gunicorn.
Dynatrace tagging tips
Dynatrace automatically extracts lots of metadata about every host, process, and service., which can be used for automated tagging and naming. Out-of-the-box Dynatrace captures k8s labels and annotations as well as information about the k8s namespace, pods, etc.
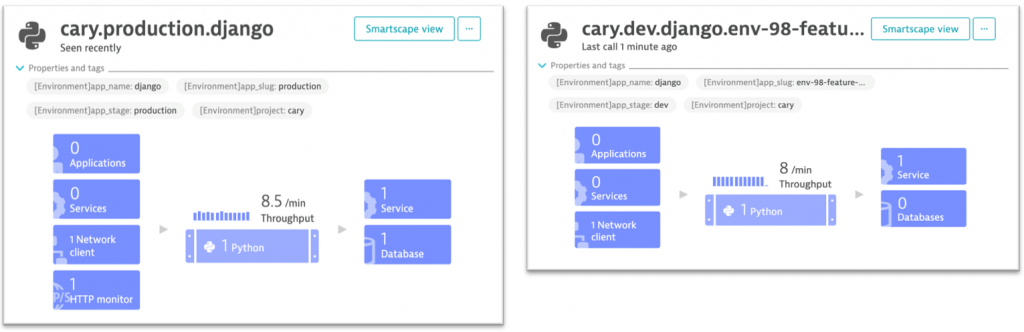
If you want to pass in more specific metadata such as “app_name”, “app_stage”, “app_slug” or “project” or want automated tags passed to your process, do it like Stephan using DT_CUSTOM_PROP and DT_TAGS respectively. In the screenshot below, you can see the automated tags as well as the well-formatted service name that is also based on the passed meta data:
If you want to learn more about tagging and metadata check out Best Practices for Tagging.
Step 3: Analyze your data
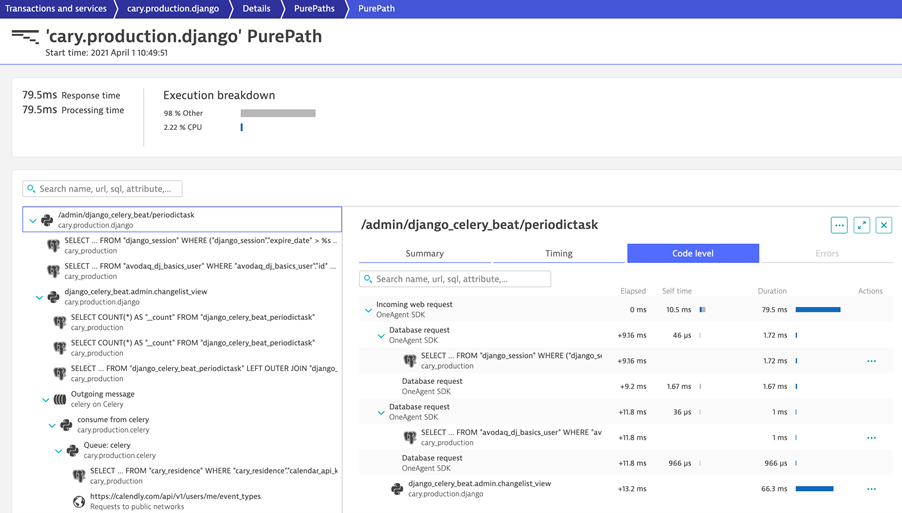
Yes – that’s it. Once you deploy your apps and a OneAgent is monitoring that environment you get automated metrics, traces, and logs. If your app has a user-facing web interface, you also get automated end-user monitoring capabilities.
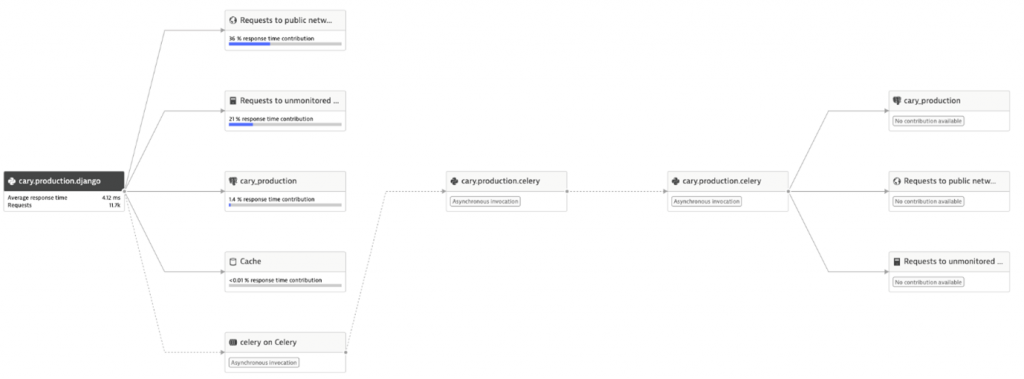
Stephan loves the automated Service Flow visualization with embedded diagnostics options. Especially in distributed systems, this is a great way to identify flow of requests, communication hotspots, errors, unintentional dependencies and more.
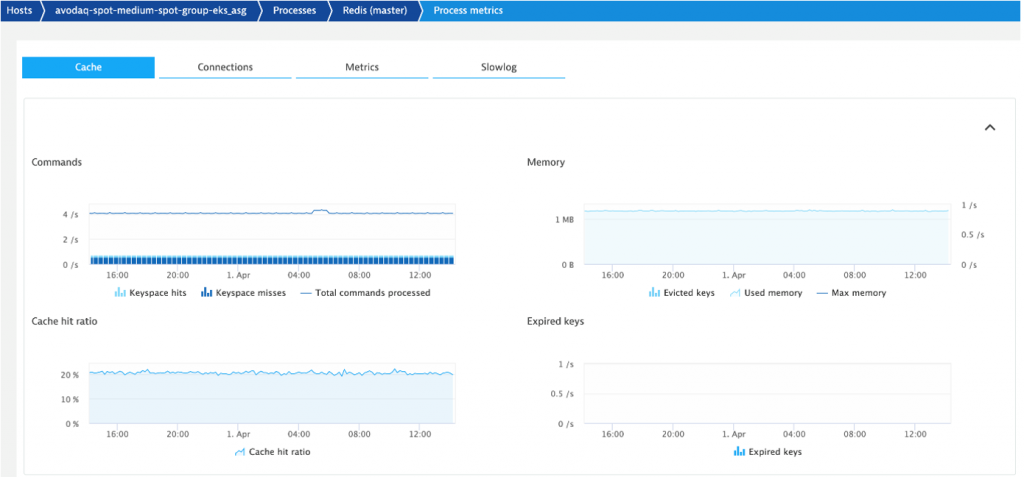
Besides the automated code-based instrumentation giving you code level visibility the Dynatrace OneAgent also gives you all the key metrics from k8s, your pods, processes, or depending on services such as Redis.
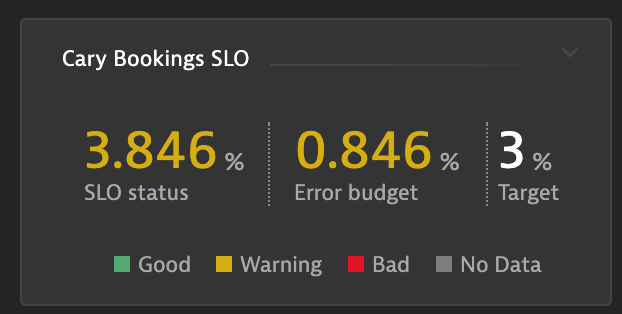
Step 4: Think SLOs
The last screenshot Stephan shared was from one of his dashboards he uses to monitor important Service Level Objectives (SLOs). Dynatrace has a built-in SLOs capability where any metric can be converted into an SLO giving you an easy status on how your services are matching up with your operational and business expectations. The data allows you to make better decisions on whether you have enough “error budget” to rollout a new release or whether you should rather focus on improving stability of the current system.
If you want to learn more about Dynatrace’s capabilities that supports SRE (Site Reliability Engineering) then check out Wolfgang Heider’s blog on SLOs for Confident Deployments.
Now go and “observe” your Python app
It is truly simply to get monitoring & observability into your Python based app.
- Sign up for a Dynatrace Trial
- Leverage the Open Source SDK from David Lopes
- Follow the steps in this blog by Stephan Dannewitz
Thanks Stephan for the great insights. Truly a please working with you and the rest of the avodaq AG.
The Developer’s Guide to Observability
Modern observability is no longer just an operations tool; it’s built for developers. When you bring observability into your IDE, pipelines, and AI driven development workflow, you can surface how code behaves in context across services, environments, and teams.


Looking for answers?
Start a new discussion or ask for help in our Q&A forum.
Go to forum