


























Kick-start your app creation
Whether you’re a beginner or a pro, Dynatrace Developer has the tools and support you need to create incredible apps with minimal effort.
Go to Dynatrace Developer
 Couchbase
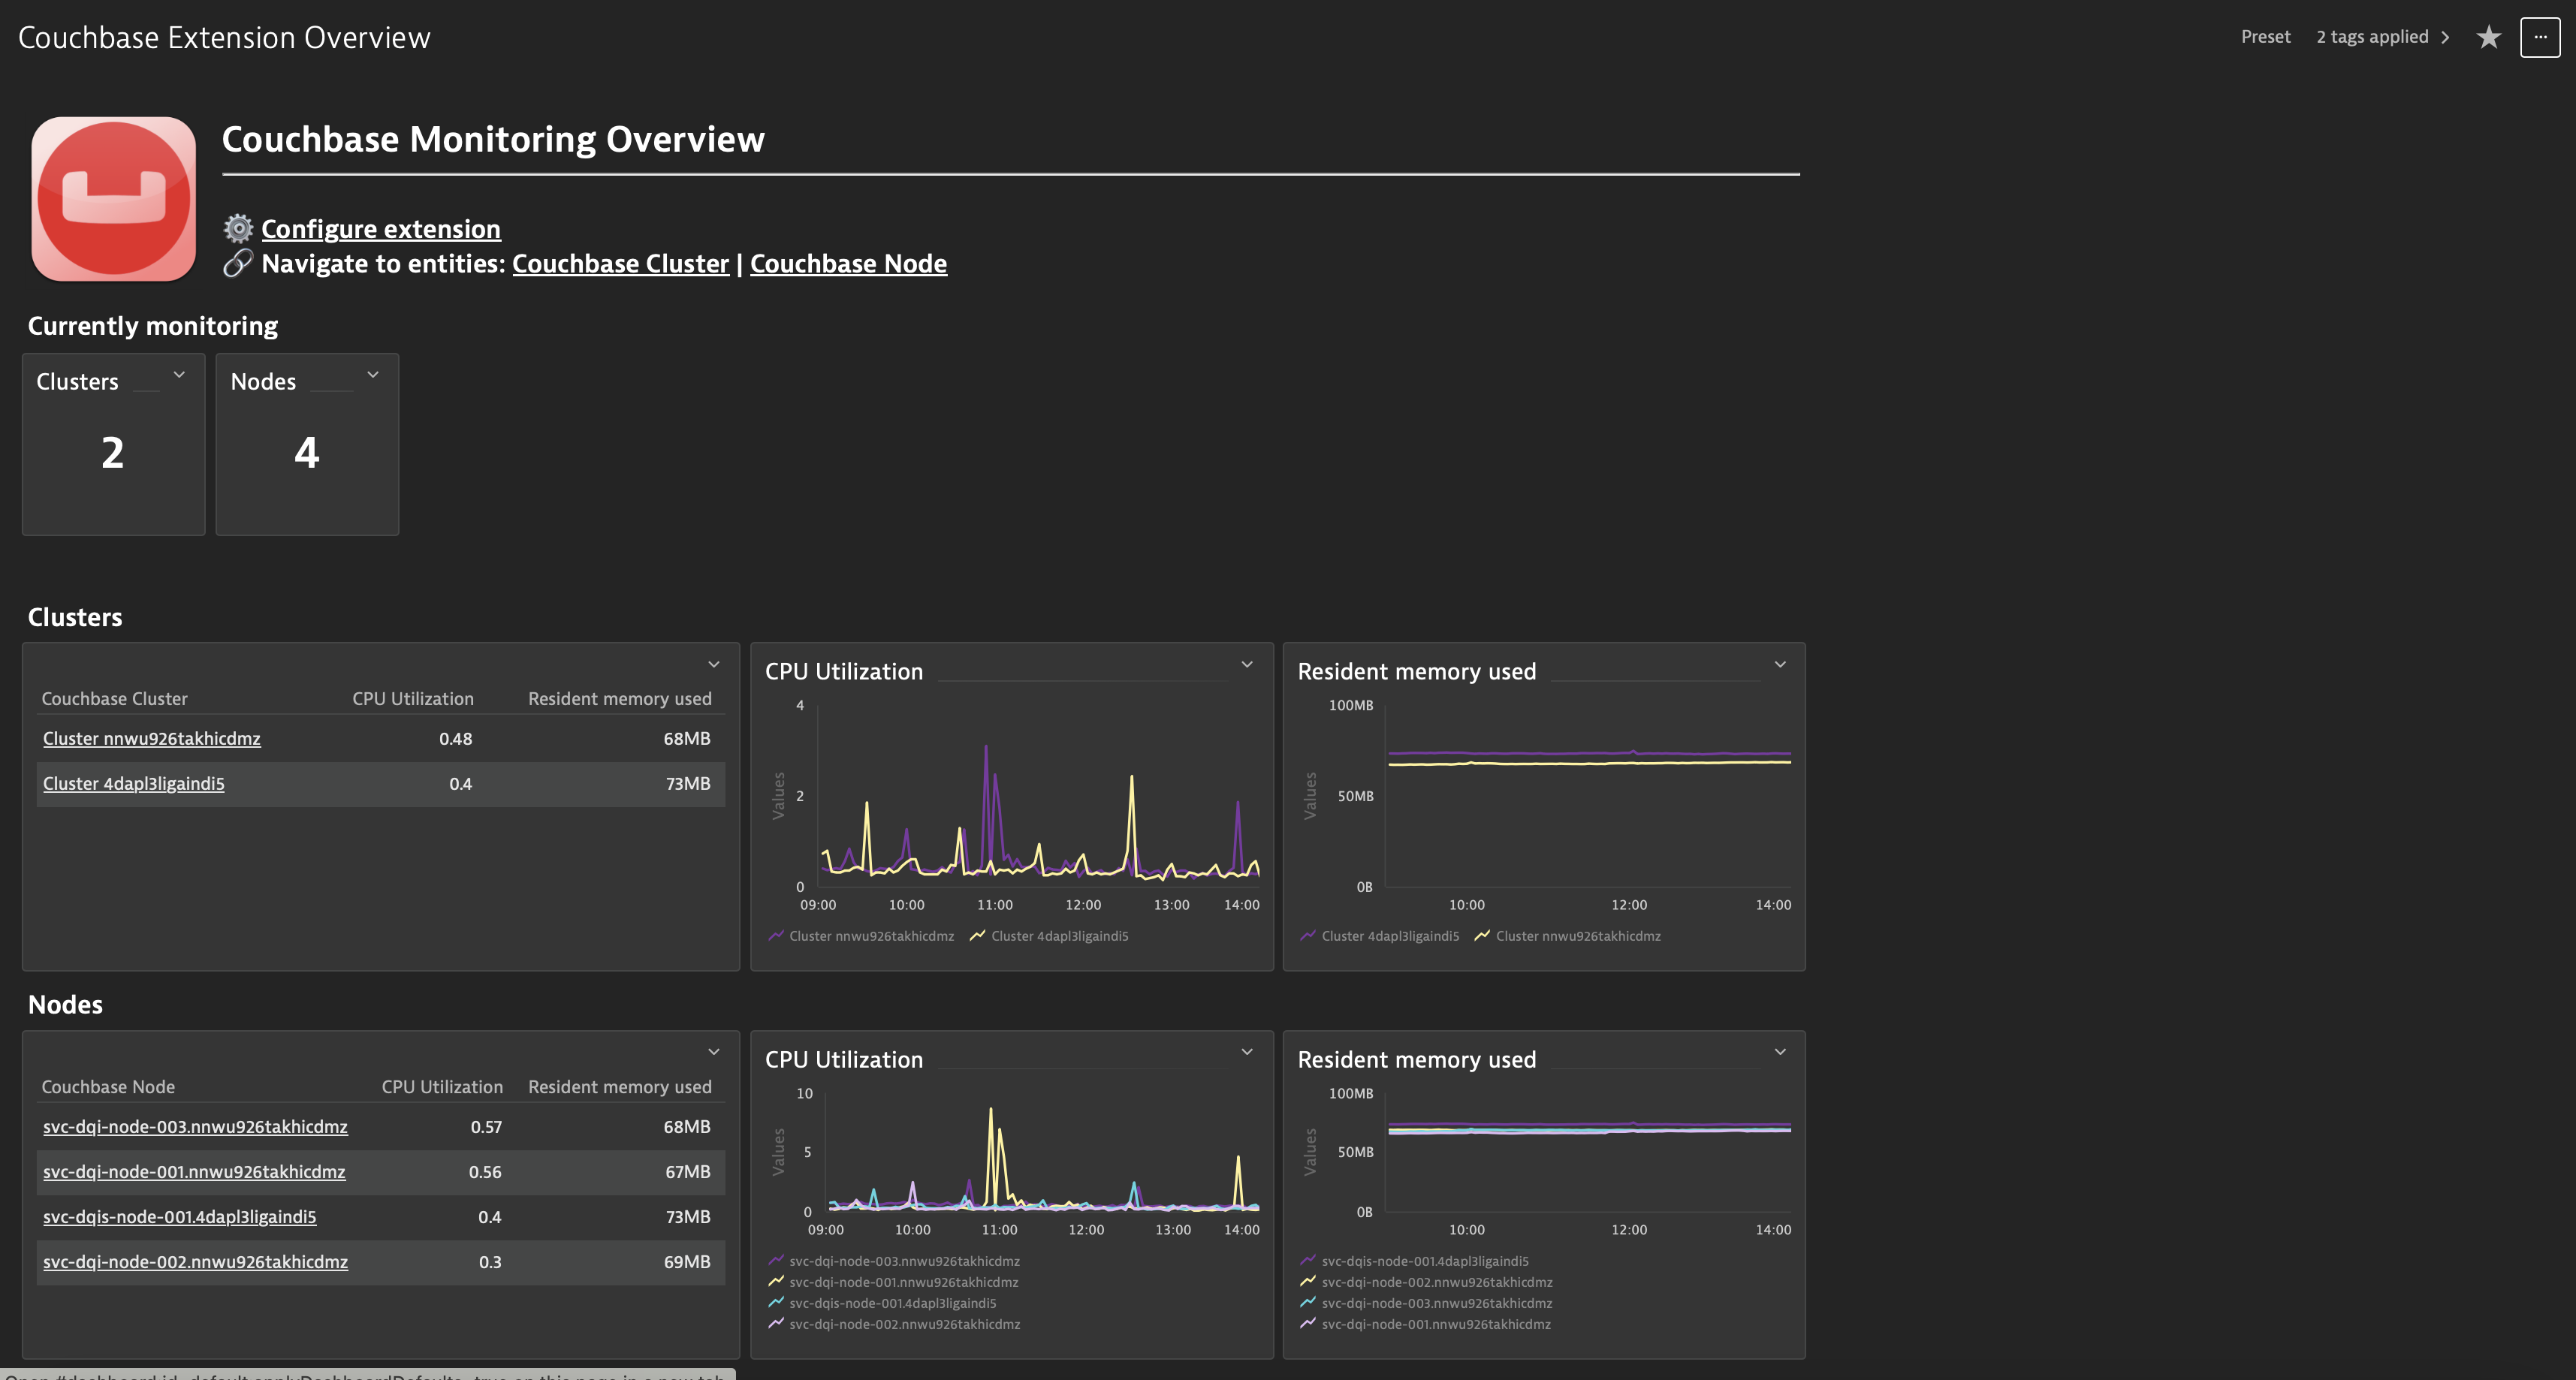
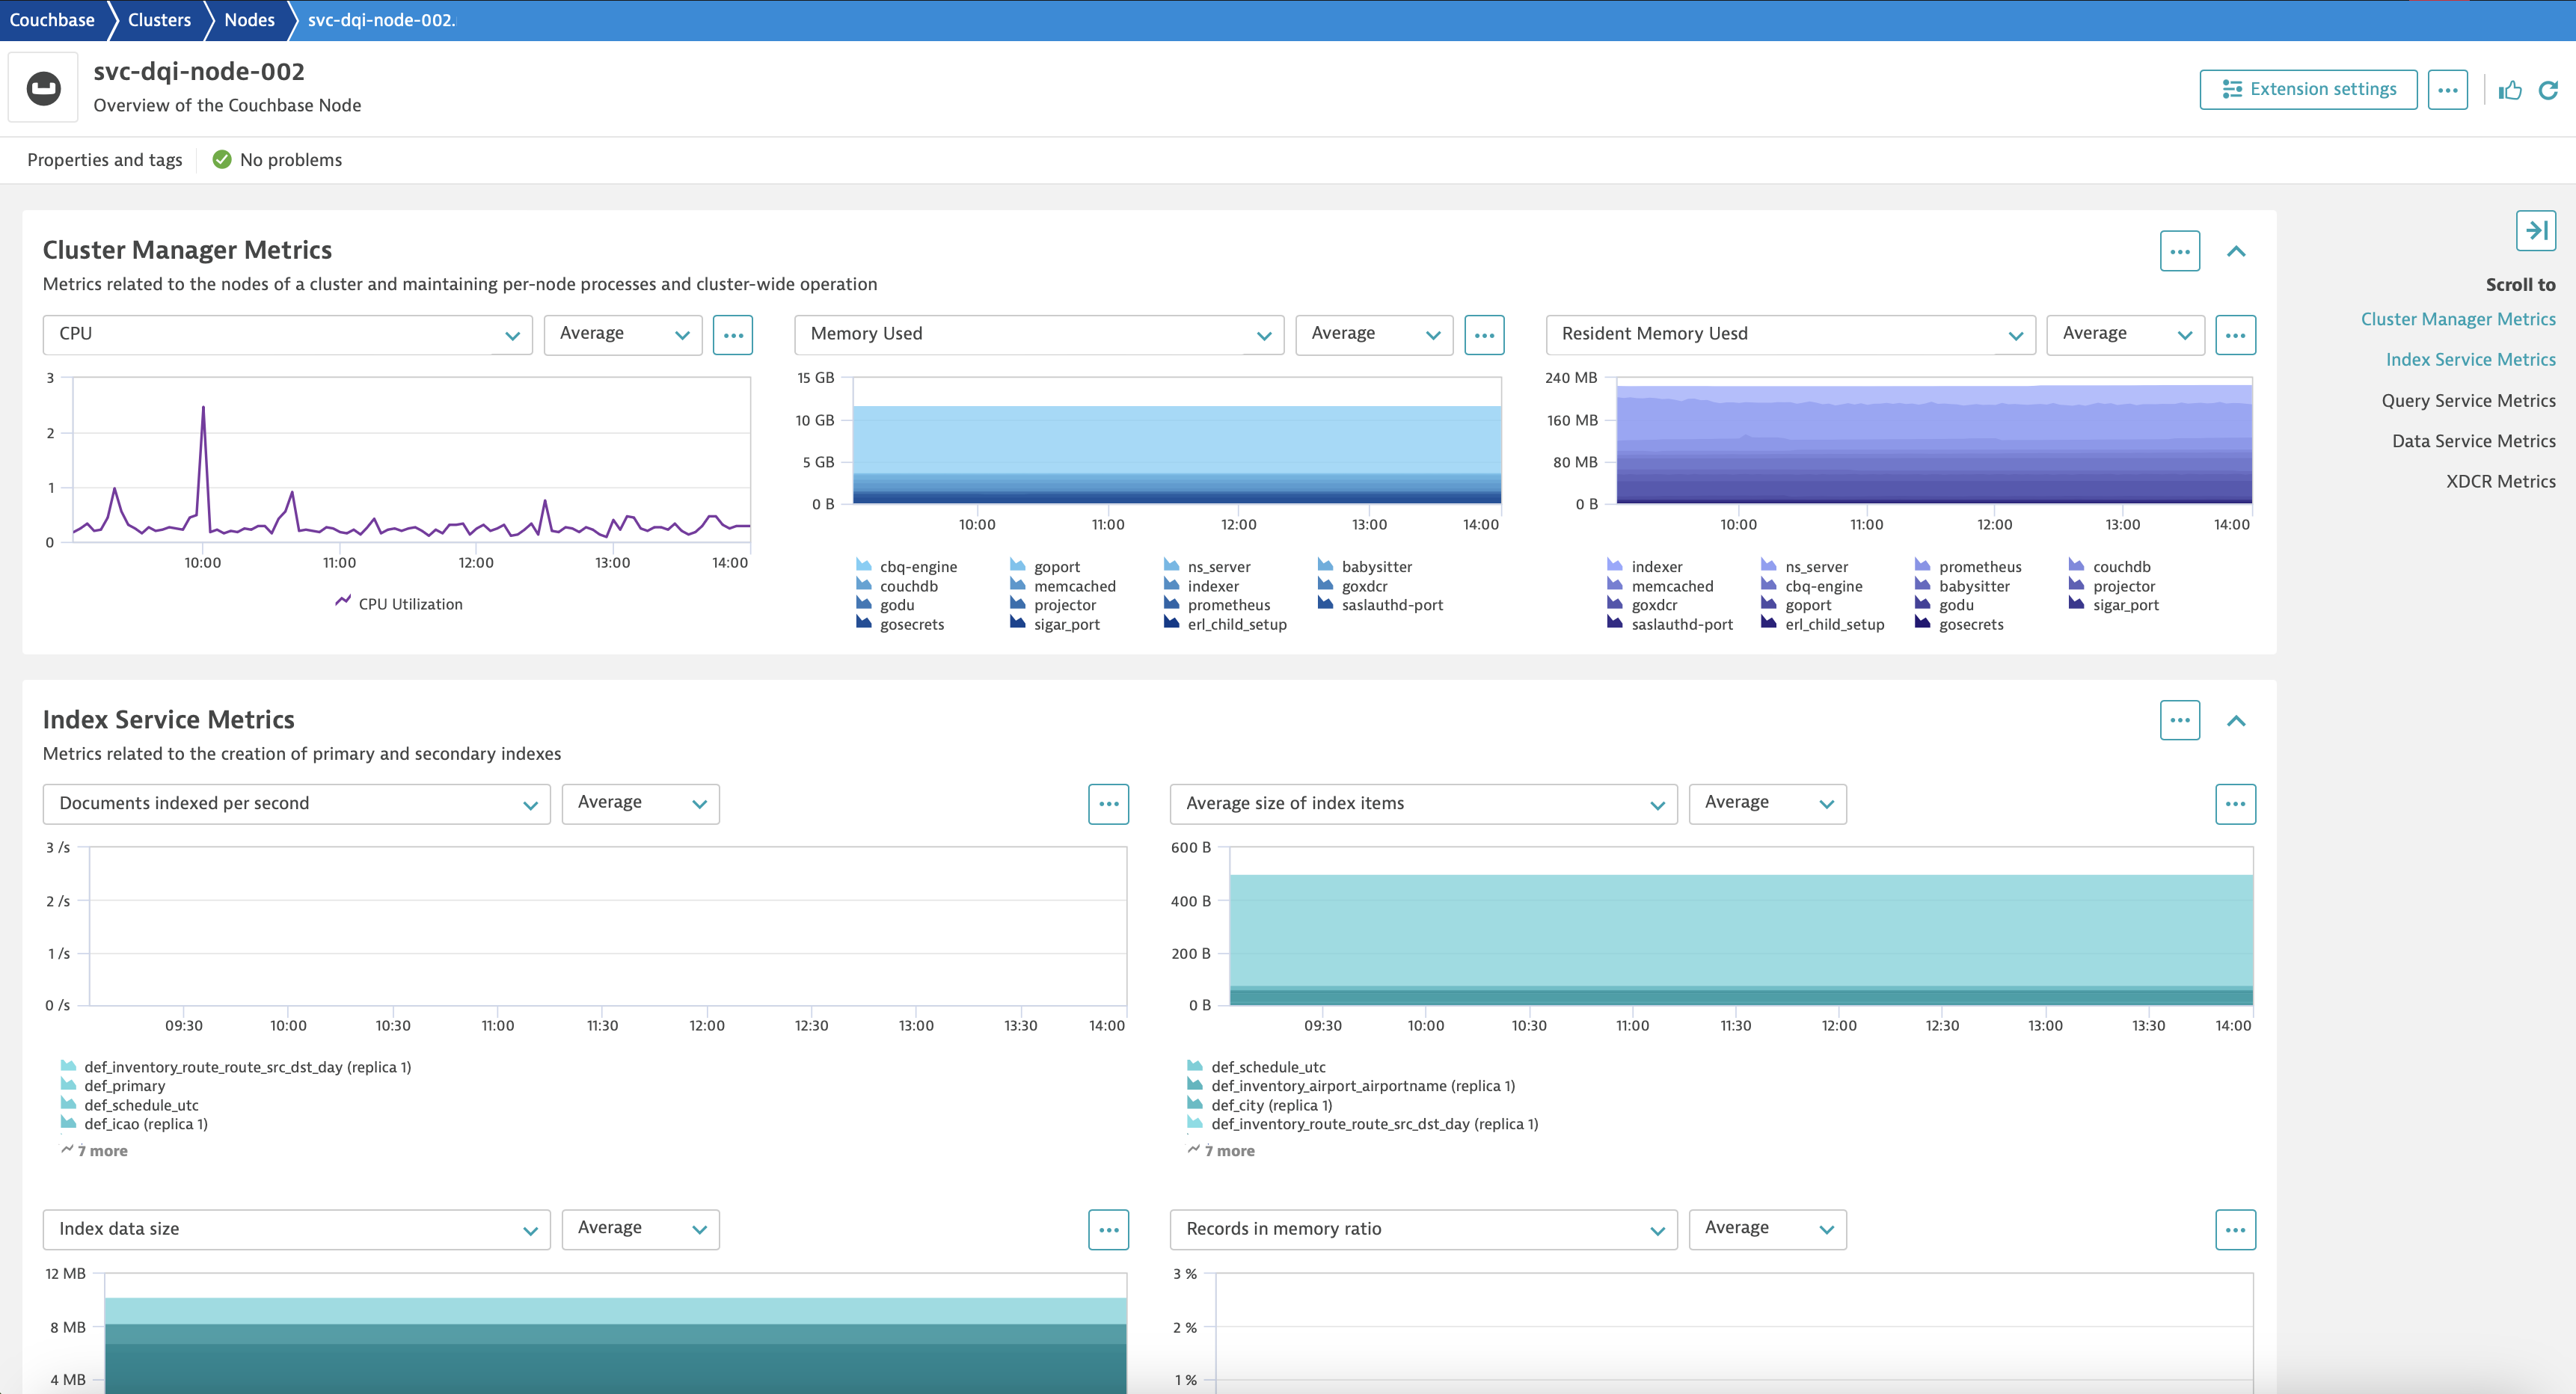
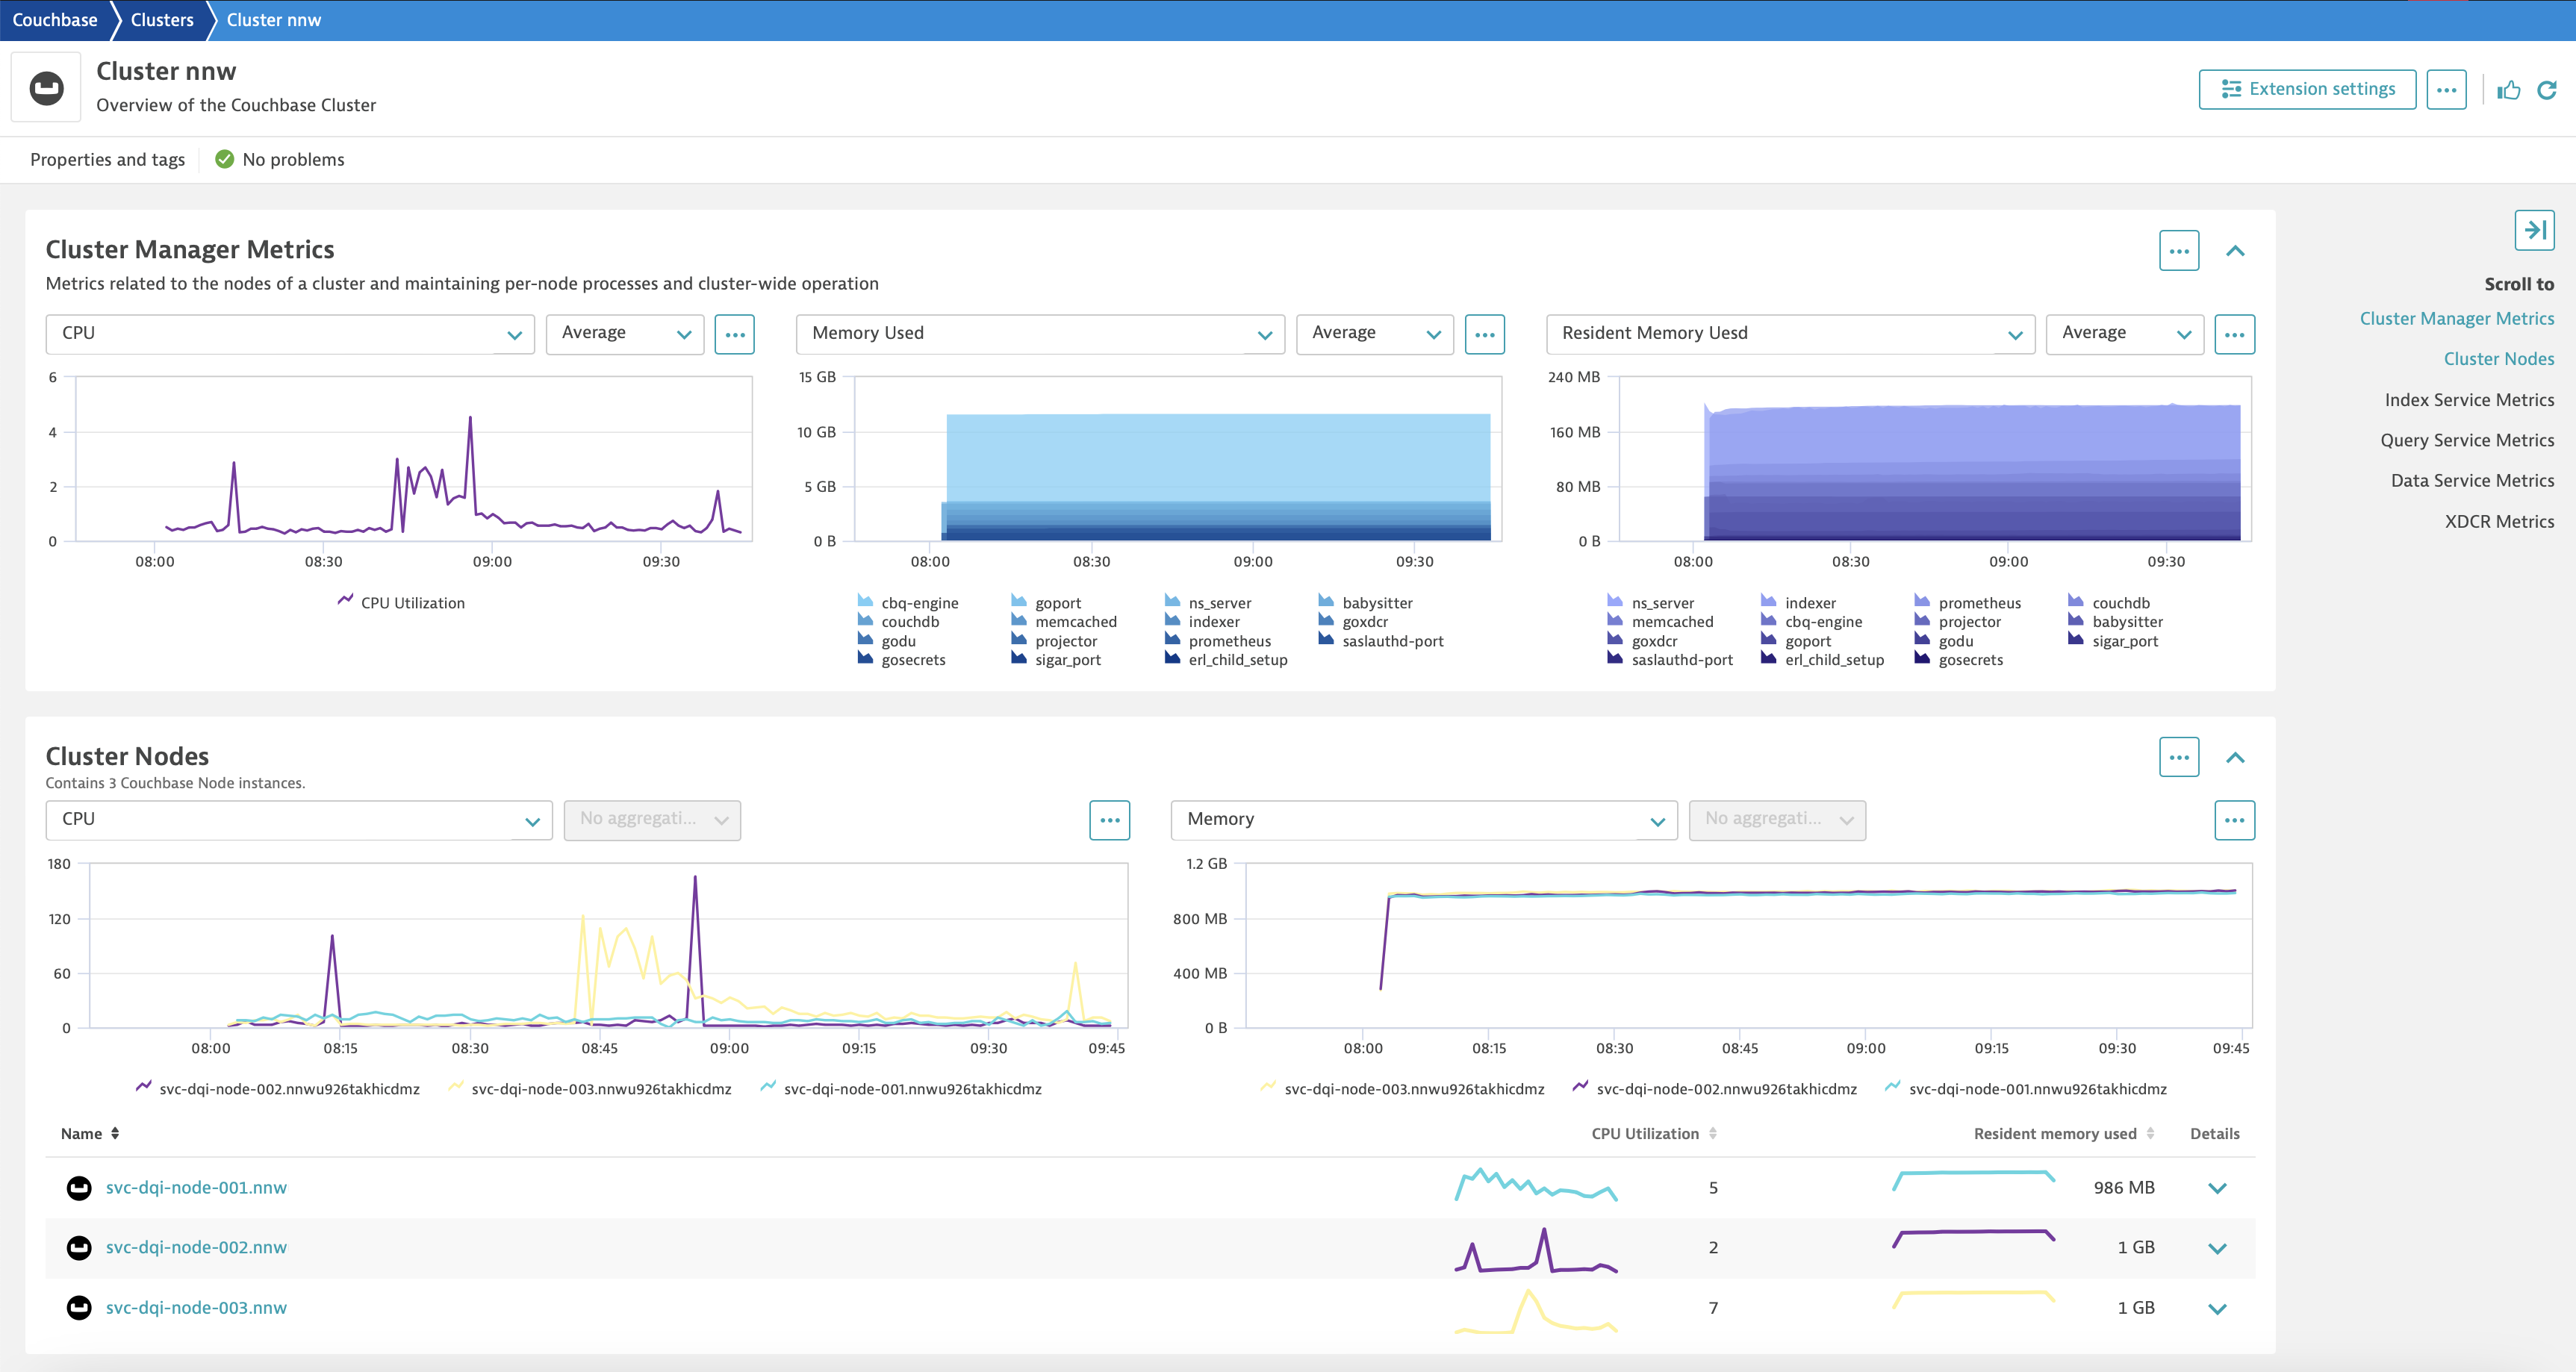
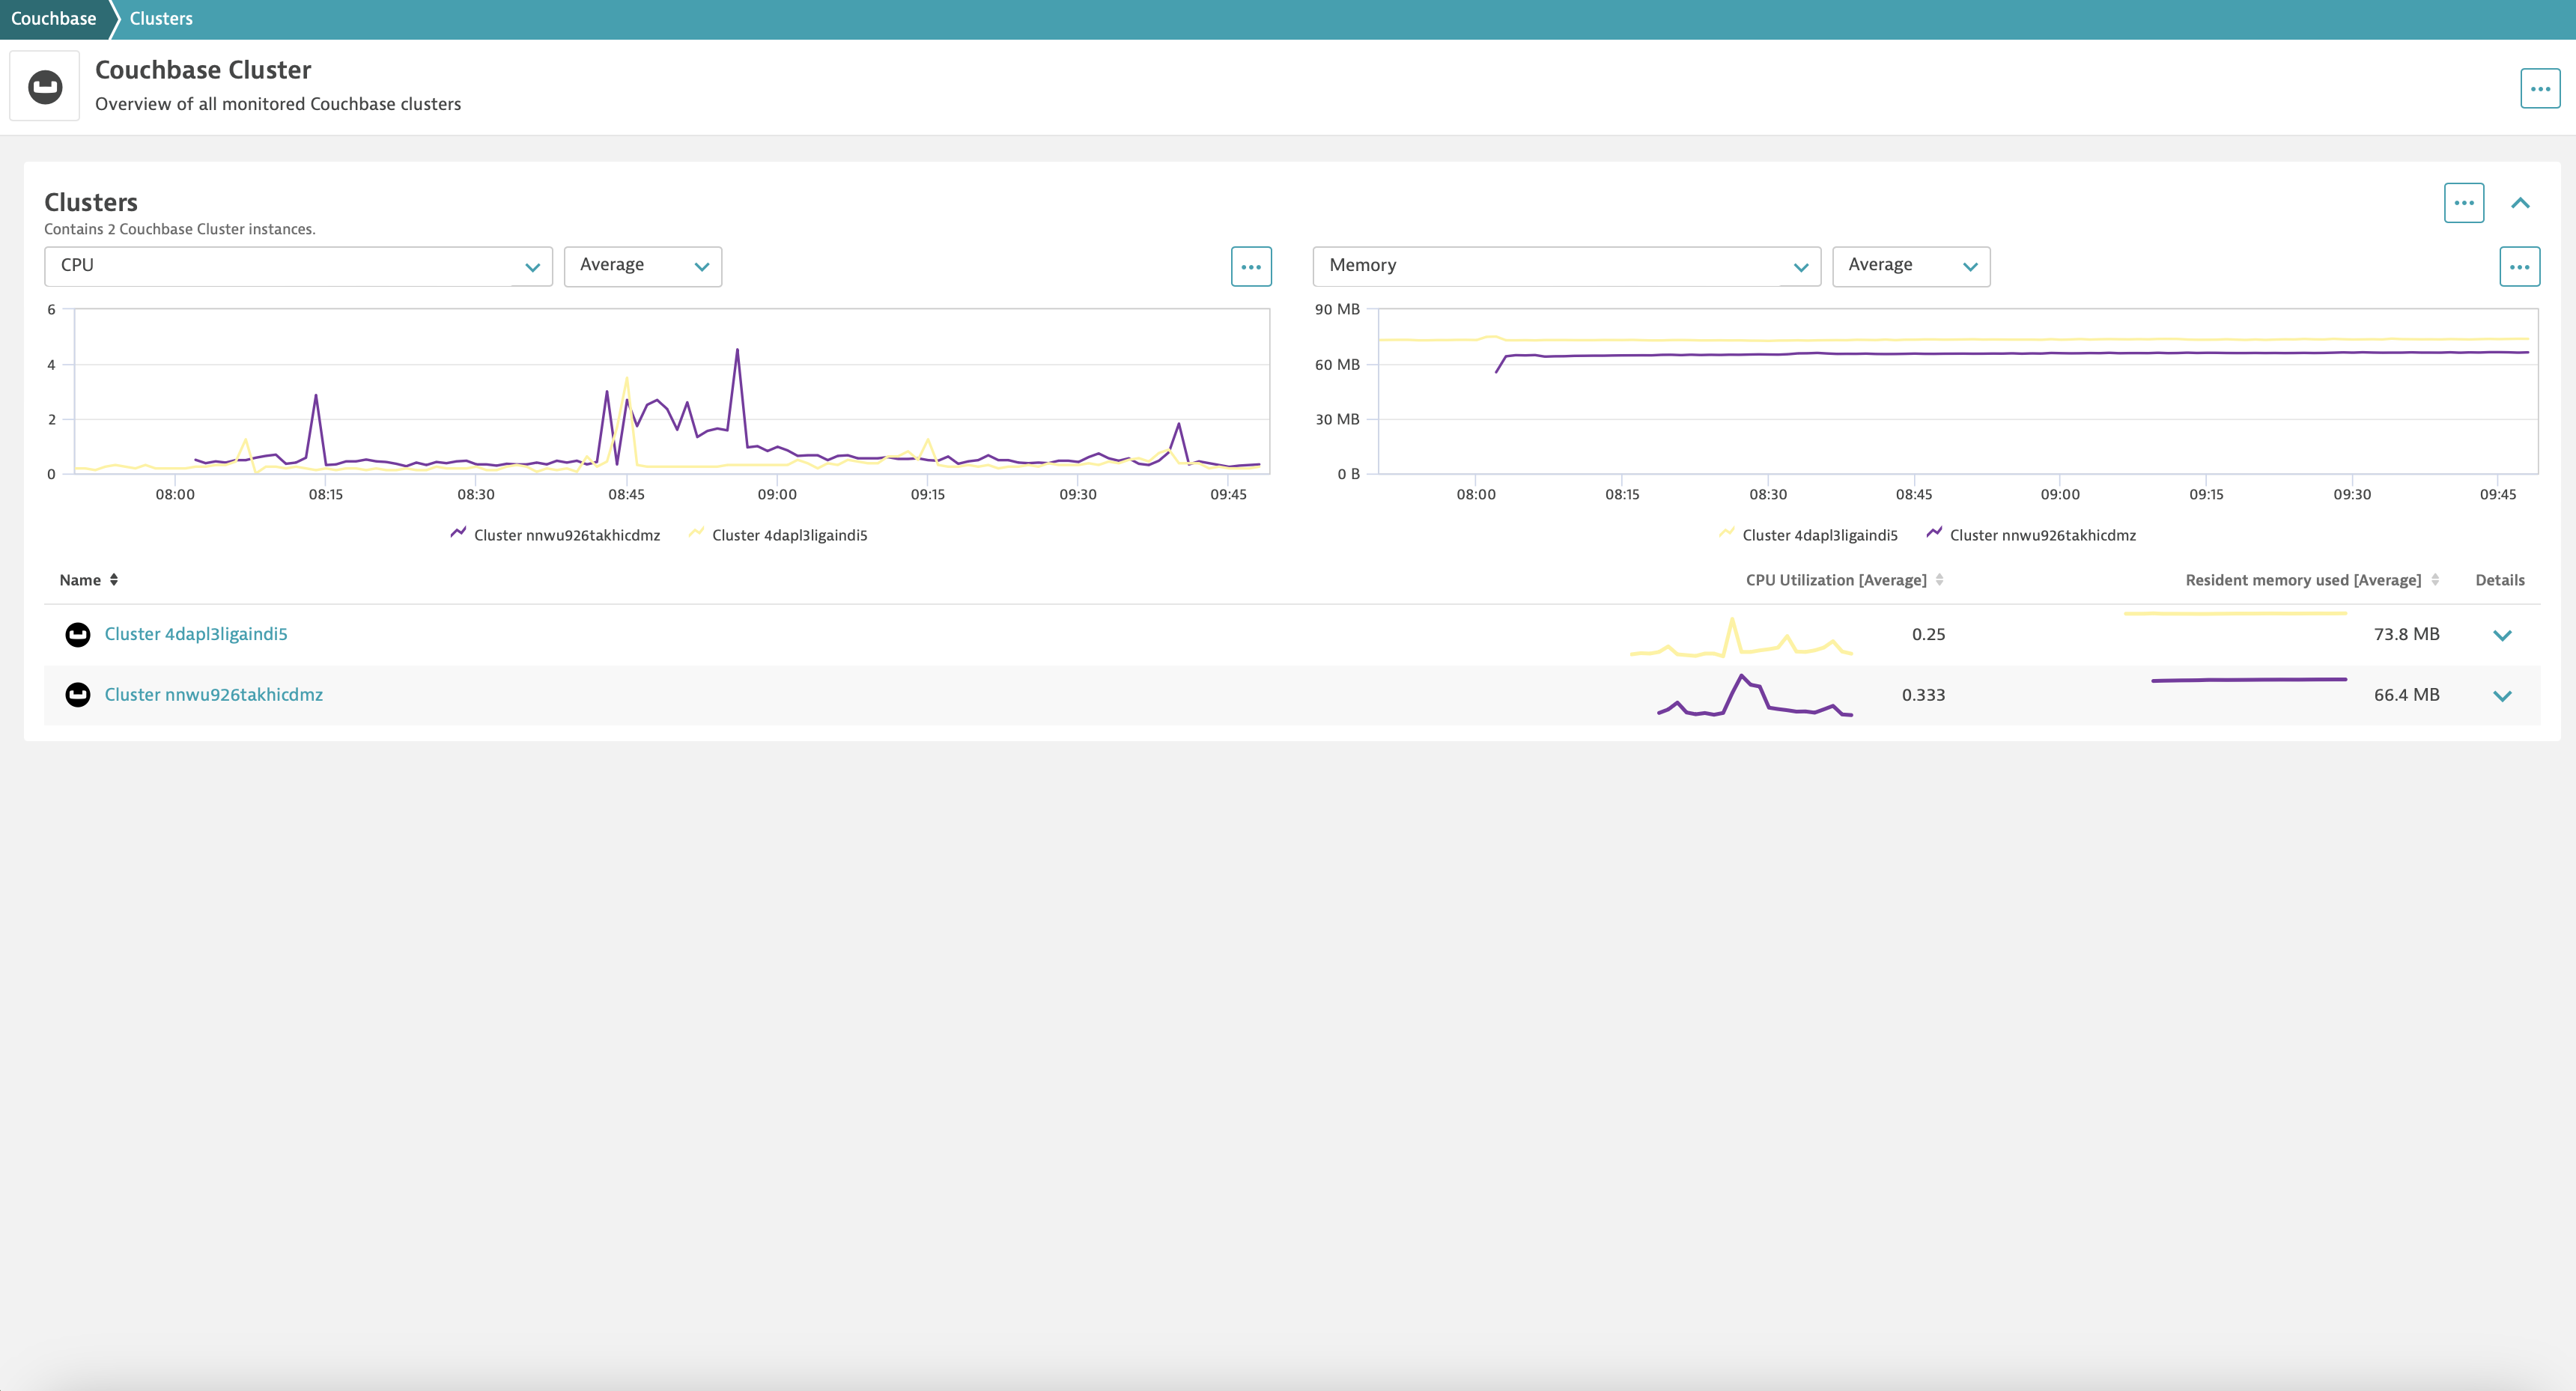
The Couchbase extension is designed to monitor Couchbase databases. It provides monitoring metrics at the cluster and node level.
Monitoring Cappella is handled by deploying the extension on an ActiveGate.
For more information on the installation and configuration, please see Couchbase extension in the Dynatrace Documentation.
The extension requires:
Below is a complete list of the feature sets provided in this version. To ensure a good fit for your needs, individual feature sets can be activated and deactivated by your administrator during configuration.
| Metric name | Metric key | Description | Unit |
|---|---|---|---|
| Channel cache hits | couchbase.sync_gateway.sgw_cache_chan_cache_hits | The total number of channel cache requests fully served by the cache. | Count |
| Channel cache largest | couchbase.sync_gateway.sgw_cache_chan_cache_max_entries | The total size of the largest channel cache. | Count |
| Channel cache misses | couchbase.sync_gateway.sgw_cache_chan_cache_misses | The total number of channel cache requests not fully served by the cache. | Count |
| Total channels cached | couchbase.sync_gateway.sgw_cache_chan_cache_num_channels | The total number of channels being cached. | Count |
| Total active channels | couchbase.sync_gateway.sgw_cache_num_active_channels | The total number of active channels. | Count |
| Revision cache hits | couchbase.sync_gateway.sgw_cache_rev_cache_hits | The total number of revision cache hits. | Count |
| Revision cache misses | couchbase.sync_gateway.sgw_cache_rev_cache_misses | The total number of revision cache misses. | Count |
| Metric name | Metric key | Description | Unit |
|---|---|---|---|
| Documents indexed per second | couchbase.index_avg_drain_rate | Average number of documents indexed per second, for this index | PerSecond |
| Average size of index items | couchbase.index_avg_item_size | Average size of the indexed items | Byte |
| Uncompressed index data size | couchbase.index_data_size | Bytes in memory used by indexes | Byte |
| Index total disk space | couchbase.index_disk_size | Total disk space taken up by this index after compression. This includes index data files, checkpoints etc. | Byte |
| Index Resident Percent | couchbase.index_resident_percent | Percentage of index data resident in memory | Percent |
| Metric name | Metric key | Description | Unit |
|---|---|---|---|
| Unsuccessful authentications | couchbase.sync_gateway.sgw_security_auth_failed_count | The total number of unsuccessful authentications. | Count |
| Successful authentications | couchbase.sync_gateway.sgw_security_auth_success_count | The total number of successful authentications. | Count |
| Total authentication time | couchbase.sync_gateway.sgw_security_total_auth_time | The total time spent in authenticating all requests. | Count |
| Metric name | Metric key | Description | Unit |
|---|---|---|---|
| Delta cache hit | couchbase.sync_gateway.sgw_delta_sync_delta_cache_hit | The total number of requested deltas that were available in the revision cache. | Count |
| Delta cache miss | couchbase.sync_gateway.sgw_delta_sync_delta_cache_miss | The total number of requested deltas that were not available in the revision cache. | Count |
| Total deltas sent | couchbase.sync_gateway.sgw_delta_sync_deltas_sent | The total number of revisions sent to clients as deltas | Count |
| Metric name | Metric key | Description | Unit |
|---|---|---|---|
| Index Mutations Remaining | couchbase.index.num_docs_pending | Number of documents remaining to be indexed. | Count |
| Index Drain Rate | couchbase.index.avg_drain_rate | Number of documents indexed by the indexer | PerSecond |
| Index Resident Percent | couchbase.index.resident_percent | Percentage of index data resident in memory | Percent |
| Index RAM Used | couchbase.index.memory_used | Bytes in memory for this index | Byte |
| Indexed items | couchbase.index.items_count.gauge | Current total indexed documents | Count |
| Index Data Size | couchbase.index.data_size | Bytes in memory used by indexes | Byte |
| Index Disk Size | couchbase.index.disk_size | Total data on disk for index | Byte |
| Index Item Size | couchbase.index.avg_item_size | Average size of each item in Index | Byte |
| Index Scan Latency | couchbase.index.avg_scan_latency | Average time to serve a scan request | NanoSecond |
| Index Requests | couchbase.index.num_requests | Number of requests served by the indexer | Count |
| Index Scan Bytes | couchbase.index.scan_bytes_read | Number of bytes scanned by the indexer | Byte |
| Index Fragmentation | couchbase.index.frag_percent | Percentage fragmentation of the index | Percent |
| Index Cache Hit Percent | couchbase.index.cache_hit_percent | Percentage of access to index data from RAM as opposed to disk | Percent |
| Items scanned | couchbase.index.num_rows_returned.count | Number of index items scanned by the indexer per second. | Count |
| Number of documents indexed | couchbase.index.num_docs_indexed.count | Number of documents indexed by the indexer since last startup. | Count |
| Metric name | Metric key | Description | Unit |
|---|---|---|---|
| Current MCBP/DCP Connections | couchbase.kv_curr_connections | Current number of MCBP/DCP connections | Count |
| Waiting for commit (bucket) | couchbase.kv_disk_seconds_bucket | Waiting for a commit after a batch of updates | Second |
| Waiting for commit (count) | couchbase.kv_disk_seconds_count.gauge | Waiting for a commit after a batch of updates | Second |
| Waiting for commit (sum) | couchbase.kv_disk_seconds_sum | Waiting for a commit after a batch of updates | Second |
| Disk used by Bucket | couchbase.kv_ep_db_data_size_bytes | Total size of valid data in db files | Byte |
| Disk drain rate | couchbase.kv_ep_diskqueue_drain | Total drained items on disk queue | Count |
| Enqueued items on disk queue | couchbase.kv_ep_diskqueue_fill | Total enqueued items on disk queue | Count |
| Total memory used in disk queue | couchbase.kv_ep_diskqueue_memory_bytes | Total memory used in disk queue | Byte |
| Disk write queue - being written | couchbase.kv_ep_flusher_todo | Number of items currently being written | Count |
| Disk used percent by node | couchbase.kv_ep_magma_total_disk_usage_bytes | Disk used percent by node | Byte |
| Items queued for storage | couchbase.kv_ep_queue_size | Number of items queued for storage | Count |
| Temporary out of memory errors by bucket | couchbase.kv_ep_tmp_oom_errors | Number of times temporary OOMs happened while processing operations | Count |
| Total engine memory usage | couchbase.kv_mem_used_bytes | Engine's total memory usage | Byte |
| Get ops per second | couchbase.kv_vb_ops_get | Get Ops Per Second | PerSecond |
| Set ops per second | couchbase.kv_vb_ops_set | Set Ops Pet Second | PerSecond |
| Active item resident ratio | couchbase.kv_vb_perc_mem_resident_ratio | Active item resident ratio | Percent |
| VB queue drain | couchbase.kv_vb_queue_drain | VB queue drain | Unspecified |
| VB queue fill | couchbase.kv_vb_queue_fill | VB queue fill | Unspecified |
| VB queue pending | couchbase.kv_vb_queue_pending_bytes | VB queue pending | Unspecified |
| VB queue size | couchbase.kv_vb_queue_size | VB queue size | Unspecified |
| Metric name | Metric key | Description | Unit |
|---|---|---|---|
| DCP mutations added | couchbase.sync_gateway.sgw_database_dcp_caching_count | The total number of DCP mutations added to Sync Gateway’s channel cache. | Count |
| DCP mutation time | couchbase.sync_gateway.sgw_database_dcp_caching_time | The total time between a DCP mutation arriving at Sync Gateway and being added to channel cache. | Second |
| DCP received time | couchbase.sync_gateway.sgw_database_dcp_received_time | The time between a document write and that document being received by Sync Gateway over DCP. If the document was written prior to Sync Gateway starting the feed, it is recorded as the time since the feed was started. | Second |
| Active replications | couchbase.sync_gateway.sgw_database_num_replications_active | The total number of active replications. | Count |
| Total replications | couchbase.sync_gateway.sgw_database_num_replications_total | The total number of replications created since Sync Gateway node startup. | Count |
| Channel name size warnings | couchbase.sync_gateway.sgw_database_warn_channel_name_size_count | The total number of warnings relating to the channel name size. | Count |
| Channel count threshold exceeded | couchbase.sync_gateway.sgw_database_warn_channels_per_doc_count | The total number of warnings relating to the channel count exceeding the channel count threshold. | Count |
| Grant count threshold exceeded | couchbase.sync_gateway.sgw_database_warn_grants_per_doc_count | The total number of warnings relating to the grant count exceeding the grant count threshold. | Count |
| Xattr sync data threshold exceeded | couchbase.sync_gateway.sgw_database_warn_xattr_size_count | The total number of warnings relating to the xattr sync data being larger than a configured threshold. | Count |
| Metric name | Metric key | Description | Unit |
|---|---|---|---|
| CPU Utilization (Deprecated in CB v7.6.0) | couchbase.sysproc_cpu_utilization | CPU utilization rate | Unspecified |
| Resident memory used | couchbase.sysproc_mem_resident | Amount of resident memory used | Byte |
| Memory used | couchbase.sysproc_mem_size | Amount of memory used | Byte |
| CPU Utilization | couchbase.sys_cpu_utilization_rate | CPU utilization rate | Percent |
| Metric name | Metric key | Description | Unit |
|---|---|---|---|
| Admin bytes received | couchbase.sync_gateway.sgw_resource_utilization_admin_net_bytes_recv.count | The total number of bytes received (since node start-up) on the network interface to which the Sync Gateway api.admin_interface is bound. | Byte |
| Admin bytes sent | couchbase.sync_gateway.sgw_resource_utilization_admin_net_bytes_sent.count | The total number of bytes sent (since node start-up) on the network interface to which the Sync Gateway api.admin_interface is bound. | Byte |
| Error count | couchbase.sync_gateway.sgw_resource_utilization_error_count | The total number of errors logged. | Count |
| Go routine high watermark | couchbase.sync_gateway.sgw_resource_utilization_goroutines_high_watermark | Peak number of go routines since process start. | Count |
| Total number of goroutines | couchbase.sync_gateway.sgw_resource_utilization_num_goroutines | The total number of goroutines. | Count |
| CPU utilization | couchbase.sync_gateway.sgw_resource_utilization_process_cpu_percent_utilization | The CPU’s utilization as percentage value. Based on user and system CPU time, but it doesn’t include components such as iowait. | Percent |
| Memory utilization | couchbase.sync_gateway.sgw_resource_utilization_process_memory_resident | The memory utilization (Resident Set Size) for the process, in bytes | Byte |
| Public bytes received | couchbase.sync_gateway.sgw_resource_utilization_pub_net_bytes_recv.count | The total number of bytes received (since node start-up) on the network interface to which the Sync Gateway api.public_interface is bound. | Byte |
| Public bytes sent | couchbase.sync_gateway.sgw_resource_utilization_pub_net_bytes_sent.count | The total number of bytes sent (since node start-up) on the network interface to which Sync Gateway api.public_interface is bound. | Byte |
| Total available memory | couchbase.sync_gateway.sgw_resource_utilization_system_memory_total | The total memory available on the system in bytes. | Byte |
| Uptime | couchbase.sync_gateway.sgw_resource_utilization_uptime_up | The total uptime. | NanoSecond |
| Metric name | Metric key | Description | Unit |
|---|---|---|---|
| Queries > 500ms | couchbase.query.requests_500ms.count | Number of queries that take longer than 500ms. | Count |
| Queries > 1000ms | couchbase.query.requests_1000ms.count | Number of queries that take longer than 1000ms. | Count |
| Queries > 5000ms | couchbase.query.requests_5000ms.count | Number of queries that take longer than 5000ms. | Count |
| N1QL Selects | couchbase.query.selects.count | Total number of N1QL SELECT requests. | Count |
| N1QL Requests | couchbase.query.requests.count | Total number of N1QL requests. | Count |
| N1QL Warnings | couchbase.query.warnings.count | Total number of N1QL warnings. | Count |
| N1QL Invalid Requests | couchbase.query.invalid_requests.count | Total number of N1QL invalid requests. | Count |
| N1QL Errors | couchbase.query.errors.count | Total number of N1QL errors. | Count |
| Query Request Time | couchbase.query.request_time.count | End-to-end time to process all queries. | NanoSecond |
| Query Execution Time | couchbase.query.service_time.count | Time to execute all queries. | NanoSecond |
| - | couchbase.query.result_count.count | - | - |
| Query Result Size | couchbase.query.result_size.count | Total size of data returned by the query engine. | Bytes |
| Metric name | Metric key | Description | Unit |
|---|---|---|---|
| CPU Utilization | couchbase.node.system.cpu_utilization_rate | CPU utilization rate | Percent |
| - | couchbase.node.system.cpu_stolen_rate | - | - |
| Swap Total | couchbase.node.system.swap_total | Total amount of swap space | Byte |
| Swap Used | couchbase.node.system.swap_used | Amount of swap space used | Byte |
| Memory Total | couchbase.node.system.mem_total | Total memory of the node | Byte |
| Memory Free | couchbase.node.system.mem_free | Free memory of the node | Byte |
| Memory Limit | couchbase.node.system.mem_limit | Memory limit of the node | Byte |
| CPU Cores Available | couchbase.node.system.cpu_cores_available | Number of CPU cores available | Count |
| Alloc Stalls | couchbase.node.system.allocstall | Number of alloc stalls | Count |
| Get Commands | couchbase.node.interesting.cmd_get | Number of get commands | Count |
| Data Service Actual Disk Size | couchbase.node.interesting.couch_docs_actual_disk_size | Amount of disk space used by the Data Service | Byte |
| Data Service Data Size | couchbase.node.interesting.couch_docs_data_size | Amount of data stored by the Data Service | Byte |
| Spatial Data Size | couchbase.node.interesting.couch_spatial_data_size | Size of object data for spatial views | Byte |
| Spatial Disk Size | couchbase.node.interesting.couch_spatial_disk_size | Amount of disk space occupied by spatial views | Byte |
| Views Actual Disk Size | couchbase.node.interesting.couch_views_actual_disk_size | Amount of disk space occupied by Couch views | Byte |
| Views Data Size | couchbase.node.interesting.couch_views_data_size | Size of object data for Couch views | Byte |
| Current items | couchbase.node.interesting.curr_items | Count of alive (non-deleted) items in active vbuckets, including non-resident items | Count |
| Current items total | couchbase.node.interesting.curr_items_tot | Total number of items | Count |
| Background Fetches | couchbase.node.interesting.ep_bg_fetched | Number of items fetched from disk | Count |
| Get Hits | couchbase.node.interesting.get_hits | Number of get hits | Count |
| Index Data Size | couchbase.node.interesting.index_data_size | The approximate size of the valid uncompressed index data, for this index | Byte |
| Index Disk Size | couchbase.node.interesting.index_disk_size | Total disk space taken up by this index, after compression. This includes index data files, checkpoints etc. | Byte |
| Memory Used | couchbase.node.interesting.mem_used | Memory used by the node | Byte |
| Total Operations | couchbase.node.interesting.ops | Total Operations per second to this bucket | PerSecond |
| Swap Total | couchbase.node.interesting.swap_total | Total swap | Byte |
| Swap Used | couchbase.node.interesting.swap_used | Swap Used | Byte |
| Non-Resident Items | couchbase.node.interesting.vb_active_num_non_resident | Number of non-resident items | Count |
| Replica Current Items | couchbase.node.interesting.vb_replica_curr_items | Count of alive (non-deleted) items in the vbucket, including non-resident items | Count |
| Cluster Uptime | couchbase.node.system.uptime | Uptime of the cluster | Second |
| - | couchbase.node.interesting.cmd_set | - | - |
| Data Service Fragmentation | couchbase.node.interesting.couch_docs_fragmentation | - | Percent |
| - | couchbase.node.interesting.couch_total_disk_size | - | - |
| Cache Miss Rate | couchbase.node.interesting.ep_cache_miss_rate | Percentage of requests that missed the cache | Percent |
| Disk Queue Drain | couchbase.node.interesting.ep_diskqueue_drain | Total drained items on disk queue | Count |
| Disk Queue Fill | couchbase.node.interesting.ep_diskqueue_fill | Total enqueued items on disk queue | Count |
| Queue Size | couchbase.node.interesting.ep_queue_size | Number of items queued for storage | Count |
| Resident Items Ratio | couchbase.node.interesting.vb_active_resident_items_ratio | Percentage of active items resident in memory | Percent |
| Metric name | Metric key | Description | Unit |
|---|---|---|---|
| Access count queries | couchbase.sync_gateway.sgw_gsi_views_access_count | The total number of queries performed. | Count |
| Access count queries errors | couchbase.sync_gateway.sgw_gsi_views_access_error_count | The total number of errors that occurred when performing the query. | Count |
| allDocs queries | couchbase.sync_gateway.sgw_gsi_views_allDocs_count | The total number of queries performed. | Count |
| allDocs queries errors | couchbase.sync_gateway.sgw_gsi_views_allDocs_error_count | The total number of errors that occurred when performing the query. | Count |
| cahnnelsStar queries | couchbase.sync_gateway.sgw_gsi_views_channelsStar_count | The total number of queries performed. | Count |
| cahnnelsStar queries errors | couchbase.sync_gateway.sgw_gsi_views_channelsStar_error_count | The total number of errors that occurred when performing the query. | Count |
| Channels queries | couchbase.sync_gateway.sgw_gsi_views_channels_count | The total number of queries performed. | Count |
| Channels queries errors | couchbase.sync_gateway.sgw_gsi_views_channels_error_count | The total number of errors that occurred when performing the query. | Count |
| Principals queries | couchbase.sync_gateway.sgw_gsi_views_principals_count | The total number of queries performed. | Count |
| Principals queries errors | couchbase.sync_gateway.sgw_gsi_views_principals_error_count | The total number of errors that occurred when performing the query. | Count |
| Resync queries | couchbase.sync_gateway.sgw_gsi_views_resync_count | The total number of queries performed. | Count |
| Resync queries errors | couchbase.sync_gateway.sgw_gsi_views_resync_error_count | The total number of errors that occurred when performing the query. | Count |
| roleAccess queries | couchbase.sync_gateway.sgw_gsi_views_roleAccess_count | The total number of queries performed. | Count |
| roleAccess queries errors | couchbase.sync_gateway.sgw_gsi_views_roleAccess_error_count | The total number of errors that occurred when performing the query. | Count |
| Sequences queries | couchbase.sync_gateway.sgw_gsi_views_sequences_count | The total number of queries performed. | Count |
| Sequences queries errors | couchbase.sync_gateway.sgw_gsi_views_sequences_error_count | The total number of errors that occurred when performing the query. | Count |
| Sessions queries | couchbase.sync_gateway.sgw_gsi_views_sessions_count | The total number of queries performed. | Count |
| Sessions queries errors | couchbase.sync_gateway.sgw_gsi_views_sessions_error_count | The total number of errors that occurred when performing the query. | Count |
| Tombstones queries | couchbase.sync_gateway.sgw_gsi_views_tombstones_count | The total number of queries performed. | Count |
| - | couchbase.sync_gateway.sgw_gsi_views_tomestones_error_count | - | - |
| Users queries | couchbase.sync_gateway.sgw_gsi_views_users_count | The total number of queries performed. | Count |
| Users queries errors | couchbase.sync_gateway.sgw_gsi_views_users_error_count | The total number of errors that occurred when performing the query. | Count |
| Metric name | Metric key | Description | Unit |
|---|---|---|---|
| Total active requests | couchbase.n1ql_active_requests | Total number of active requests. | Count |
| Total N1QL requests with at_plus index consistency | couchbase.n1ql_at_plus.count | Total number of N1QL requests with at_plus index consistency. | Count |
| Total audit records sent | couchbase.n1ql_audit_actions.count | The total number of audit records sent to the server. Some requests cause more than one audit record to be emitted. Records in the output queue that have not yet been sent to the server are not counted. | Count |
| Total failed audit records sent | couchbase.n1ql_audit_actions_failed.count | The total number of audit records sent to the server that failed. | Count |
| Potentially auditable requests with no audit action | couchbase.n1ql_audit_requests_filtered.count | The number of potentially auditable requests that cause no audit action to be taken. | Count |
| Potentially auditable requests sent to query engine | couchbase.n1ql_audit_requests_total.count | The total number of potentially auditable requests sent to the query engine. | Count |
| Cancelled requests | couchbase.n1ql_cancelled.count | Total number of cancelled requests. | Count |
| Delete operations | couchbase.n1ql_deletes.count | Total number of DELETE operations. | Count |
| N1QL error count | couchbase.n1ql_errors.count | The total number of N1QL errors returned so far. | Count |
| Secondary index scans | couchbase.n1ql_index_scans.count | Total number of secondary index scans. | Count |
| Insert operations | couchbase.n1ql_inserts.count | Total number of INSERT operations. | Count |
| Invalid requests | couchbase.n1ql_invalid_requests.count | Total number of requests for unsupported endpoints. | Count |
| Document mutations | couchbase.n1ql_mutations.count | Total number of document mutations. | Count |
| Prepared statements executed | couchbase.n1ql_prepared.count | Total number of prepared statements executed. | Count |
| Primary index scans | couchbase.n1ql_primary_scans.count | Total number of primary index scans. | Count |
| Query process time | couchbase.n1ql_request_time.count | Total end-to-end time to process all queries. | NanoSecond |
| N1QL requests | couchbase.n1ql_requests.count | Total number of N1QL requests. | Count |
| Queries longer than 1000ms | couchbase.n1ql_requests_1000ms.count | Number of queries that take longer than 1000ms. | Count |
| Queries longer than 250ms | couchbase.n1ql_requests_250ms.count | Number of queries that take longer than 250ms. | Count |
| Queries longer than 5000ms | couchbase.n1ql_requests_5000ms.count | Number of queries that take longer than 5000ms. | Count |
| Queries longer than 500ms | couchbase.n1ql_requests_500ms.count | Number of queries that take longer than 500ms. | Count |
| Results (document) returned count | couchbase.n1ql_result_count | Total number of results (documents) returned by the query engine. | Count |
| Result size | couchbase.n1ql_result_size.count | Total size of data returned by the query engine. | Byte |
| N1QL requests with request_plus consistency | couchbase.n1ql_scan_plus.count | Total number of N1QL requests with request_plus index consistency. | Count |
| Select requests | couchbase.n1ql_selects.count | Total number of SELECT requests. | Count |
| Time to execute queries | couchbase.n1ql_service_time.count | Time to execute all queries. | NanoSecond |
| Elapsed transaction time | couchbase.n1ql_transaction_time.count | Total elapsed time of transactions so far. | NanoSecond |
| Transaction count | couchbase.n1ql_transactions.count | Total number of transactions. | Count |
| N1QL requests with not_bounded consistency | couchbase.n1ql_unbounded.count | Total number of N1QL requests with not_bounded index consistency. | Count |
| Update requests | couchbase.n1ql_updates.count | Total number of UPDATE requests. | Count |
| N1QL warnings | couchbase.n1ql_warnings.count | The total number of N1QL warnings returned so far. | Count |
| Metric name | Metric key | Description | Unit |
|---|---|---|---|
| XDCR replicated docs | couchbase.xdcr_docs_processed_total.count | Number of documents processed for a Replication | Count |
| XDCR docs received | couchbase.xdcr_docs_received_from_dcp_total.count | Number of Document Mutations received from the Data Service | Count |
| XDCR docs written | couchbase.xdcr_docs_written_total.count | Number of docs Document Mutations written/sent to the Target | Count |
| XDCR write operations | couchbase.xdcr_set_docs_written_total.count | Number of Set operations successfully written to the Target | Count |
| Metric name | Metric key | Description | Unit |
|---|---|---|---|
| Total RAM | couchbase.cluster.ram.total | Total RAM available in the cluster | Byte |
| Used RAM | couchbase.cluster.ram.used | Total RAM used in the cluster | Byte |
| Total RAM Quota | couchbase.cluster.ram.quotaTotal | Total RAM quota available in the cluster | Byte |
| Used RAM Quota | couchbase.cluster.ram.quotaUsed | RAM quota used in the cluster | Byte |
| Total HDD | couchbase.cluster.hdd.total | Total HDD available in the cluster | Byte |
| Used HDD | couchbase.cluster.hdd.used | HDD used by the cluster | Byte |
| Total HDD Quota | couchbase.cluster.hdd.quotaTotal | Total HDD quota available in the cluster | Byte |
| Used HDD Quota | couchbase.cluster.hdd.quotaUsed | HDD quota used by the cluster | Byte |
This version requires a minimum Dynatrace version of 1.338 and a minimum EEC version of 1.318.
This version includes a breaking change for Dynatrace on Grail.
With the inclusion of OpenPipeline processing rules, any metrics ingested from the extension will be processed by a dedicated OpenPipeline pipeline.
This means that any dynamic route configured to process any metrics from the extension will be dropped in favor of the dedicated pipeline. Please, refer to pipeline groups to continue using dynamic routes.
Additionally, some field names are handled differently in OpenPipeline, e.g. capitalization. Please double-check any custom dashboards and alerts you have created for this extension.
You must opt-in to OpenPipeline configuration via Settings API – see the documentation.
This version keeps the minimum cluster version at 1.318.
This release improves parser resilience, metric consistency, and endpoint handling. It also includes updates to Index Unified Analysis screens and security enhancements.
This version raises the minimum cluster version to 1.318.
This release improves support for Security Certificates, fixes bugs related to the, "always use secure ports" settings, adds support for Ephemeral Buckets and improves metric metadata.
sourceEntityType to several metrics.Security Certificate Text field.always use secure ports. This combination would cause the fastcheck to fail.type dimension. Ephemeral buckets support all bucket metrics except metrics related buckets on disk such as couchbase.node.interesting.couch_total_disk_size and couchbase.node.interesting.couch_docs_fragmentation.The Python Couchbase extension continues to evolve to provide comprehensive monitoring capabilities for Couchbase deployments across different environments and versions. This release focuses on increasing the range of supported Couchbase deployments, improving reliability, and enhancing the user experience through better error handling and navigation.
The extension now includes clearly organized FeatureSets that can be enabled based on your monitoring needs:
These FeatureSets collect metrics from Couchbase's Prometheus /metrics endpoint. Use these FeatureSets to continue monitoring your Couchbase deployment the way you have in previous versions:
These FeatureSets collect metrics from various Couchbase API endpoints:
/pools/nodes API/api/v1/stats API/admin/stats APIThese FeatureSets are specifically for monitoring Couchbase Sync Gateway (only enable if monitoring Sync Gateway):
Note: ✅ Recommended FeatureSets are enabled by default and provide essential monitoring capabilities for most Couchbase deployments.
This version contains a breaking change that will require recreation of monitoring configurations. This version has no new features for users who are currently monitoring Capella databases and no need for Capella users to upgrade at this time. Future versions will add new features and will require an upgrade and recreation of monitoring configurations.
couchbase.sys_cpu_utilization_rate to match CPU metric provided by Couchbase admin UI