

























Kick-start your app creation
Whether you’re a beginner or a pro, Dynatrace Developer has the tools and support you need to create incredible apps with minimal effort.
Go to Dynatrace Developer
 Cisco Catalyst SD-WAN Manager (Viptela)
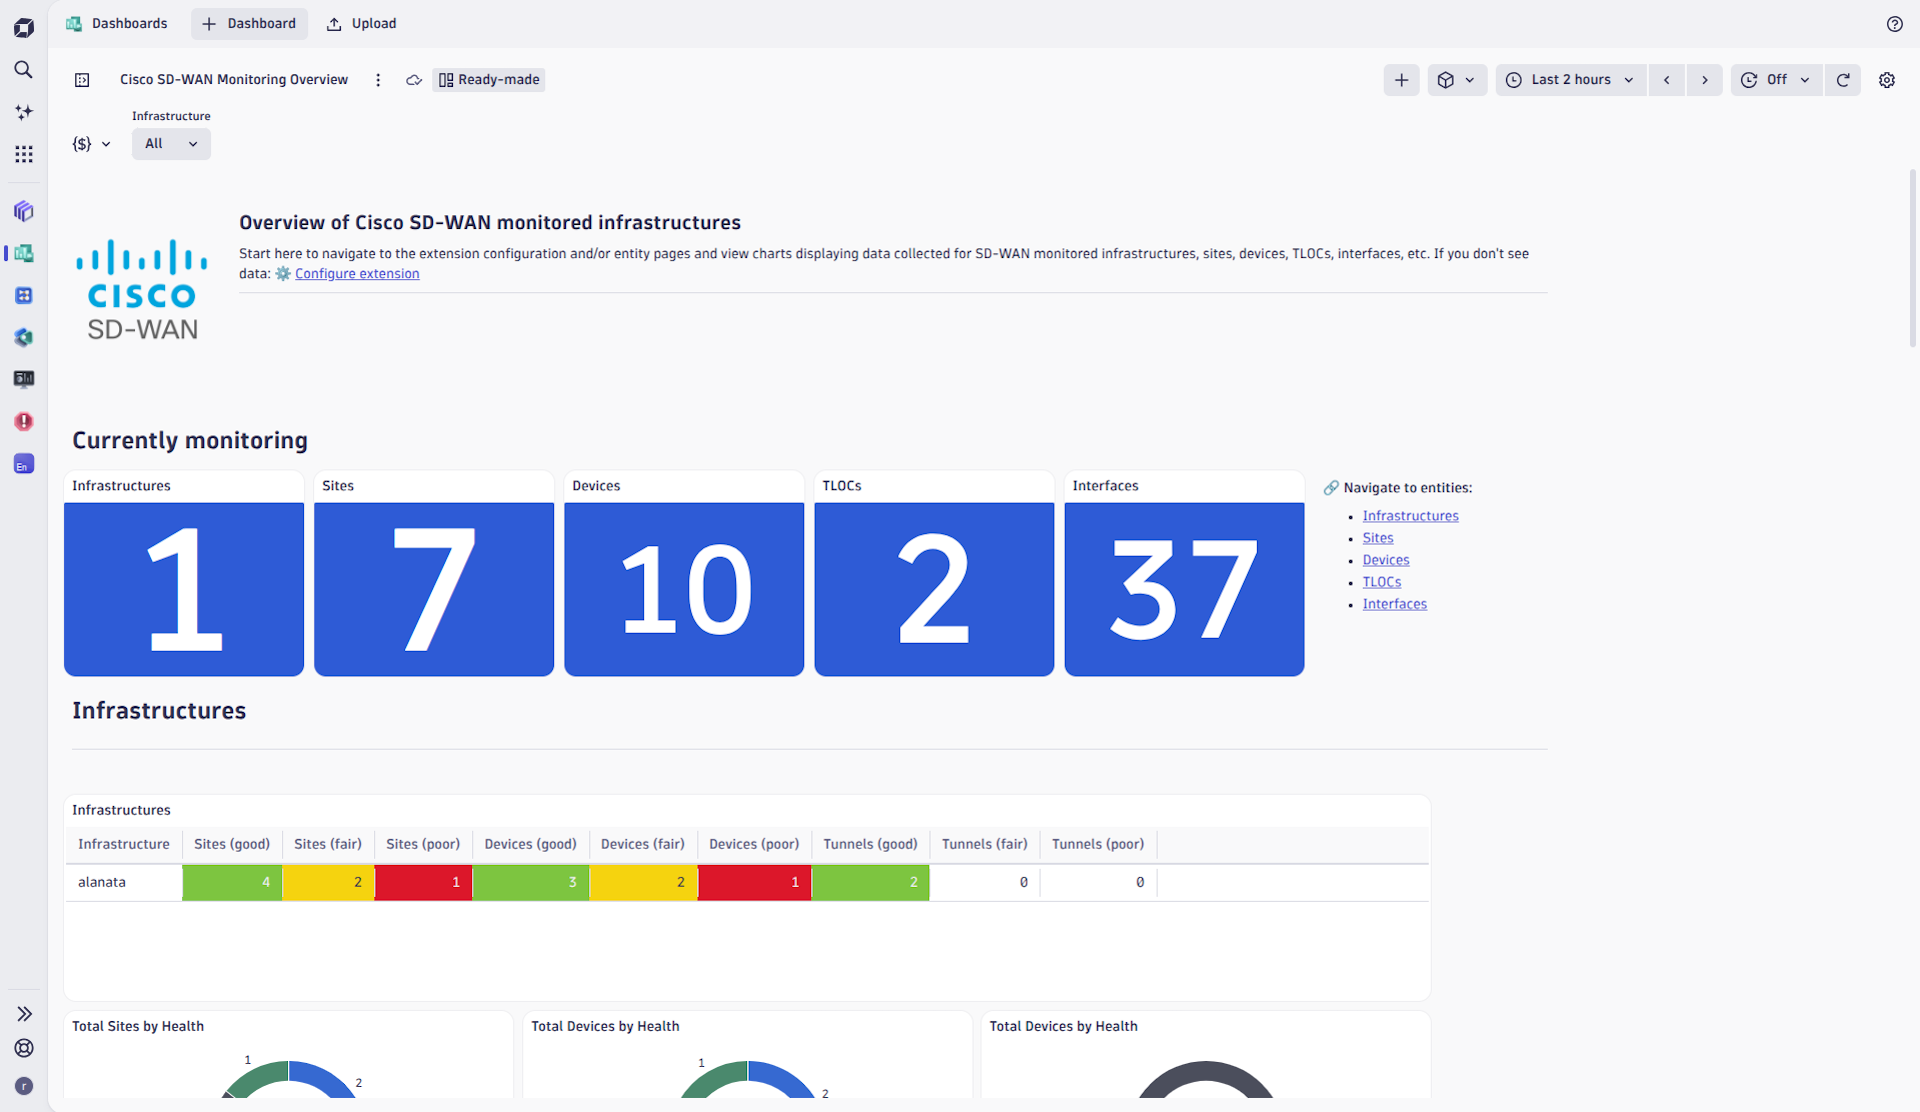
Get insights into the Cisco SD-WAN performance through the vManage API.
ExtensionCisco SD-WAN Extension uses Cisco Catalyst SD-WAN Manager API to collect performance metrics for the Cisco SD-WAN fabric managed by one or multiple Cisco SD-WAN Managers (vManage).
Follow the Cisco SD-WAN Manager Configuration procedure described on the Documentation page.
For more information on the installation and configuration, please see Cisco Catalyst SD-WAN Manager (Viptela) extension in the Dynatrace Documentation.
Below is a complete list of the feature sets provided in this version. To ensure a good fit for your needs, individual feature sets can be activated and deactivated by your administrator during configuration.
| Metric name | Metric key | Description | Unit |
|---|---|---|---|
| TLOC QoE | cisco.sdwan.tloc.vqoe_score | SD-WAN TLOC QoE Score aggregated as average across all mapped tunnels | Unspecified |
| TLOC Loss | cisco.sdwan.tloc.loss_percentage | SD-WAN TLOC Loss Percentage aggregated as average across all mapped tunnels. Tunnels reporting exactly 100% loss (unreachable remote end, carrying only BFD probes and no payload traffic) are excluded from the average. | Percent |
| TLOC Latency | cisco.sdwan.tloc.latency | SD-WAN TLOC Latency aggregated as average across all mapped tunnels | MilliSecond |
| TLOC Jitter | cisco.sdwan.tloc.jitter | SD-WAN TLOC Jitter aggregated as average across all mapped tunnels | MilliSecond |
| TLOC TX Octets | cisco.sdwan.tloc.tx_octets | SD-WAN TLOC TX Octets aggregated as sum across all mapped tunnels | Byte |
| TLOC RX Octets | cisco.sdwan.tloc.rx_octets | SD-WAN TLOC RX Octets aggregated as sum across all mapped tunnels | Byte |
| TLOC Tunnels | cisco.sdwan.tloc.tunnel_count.gauge | SD-WAN TLOC Tunnels determined by the cardinality of the Remote System IPs | Count |
| Metric name | Metric key | Description | Unit |
|---|---|---|---|
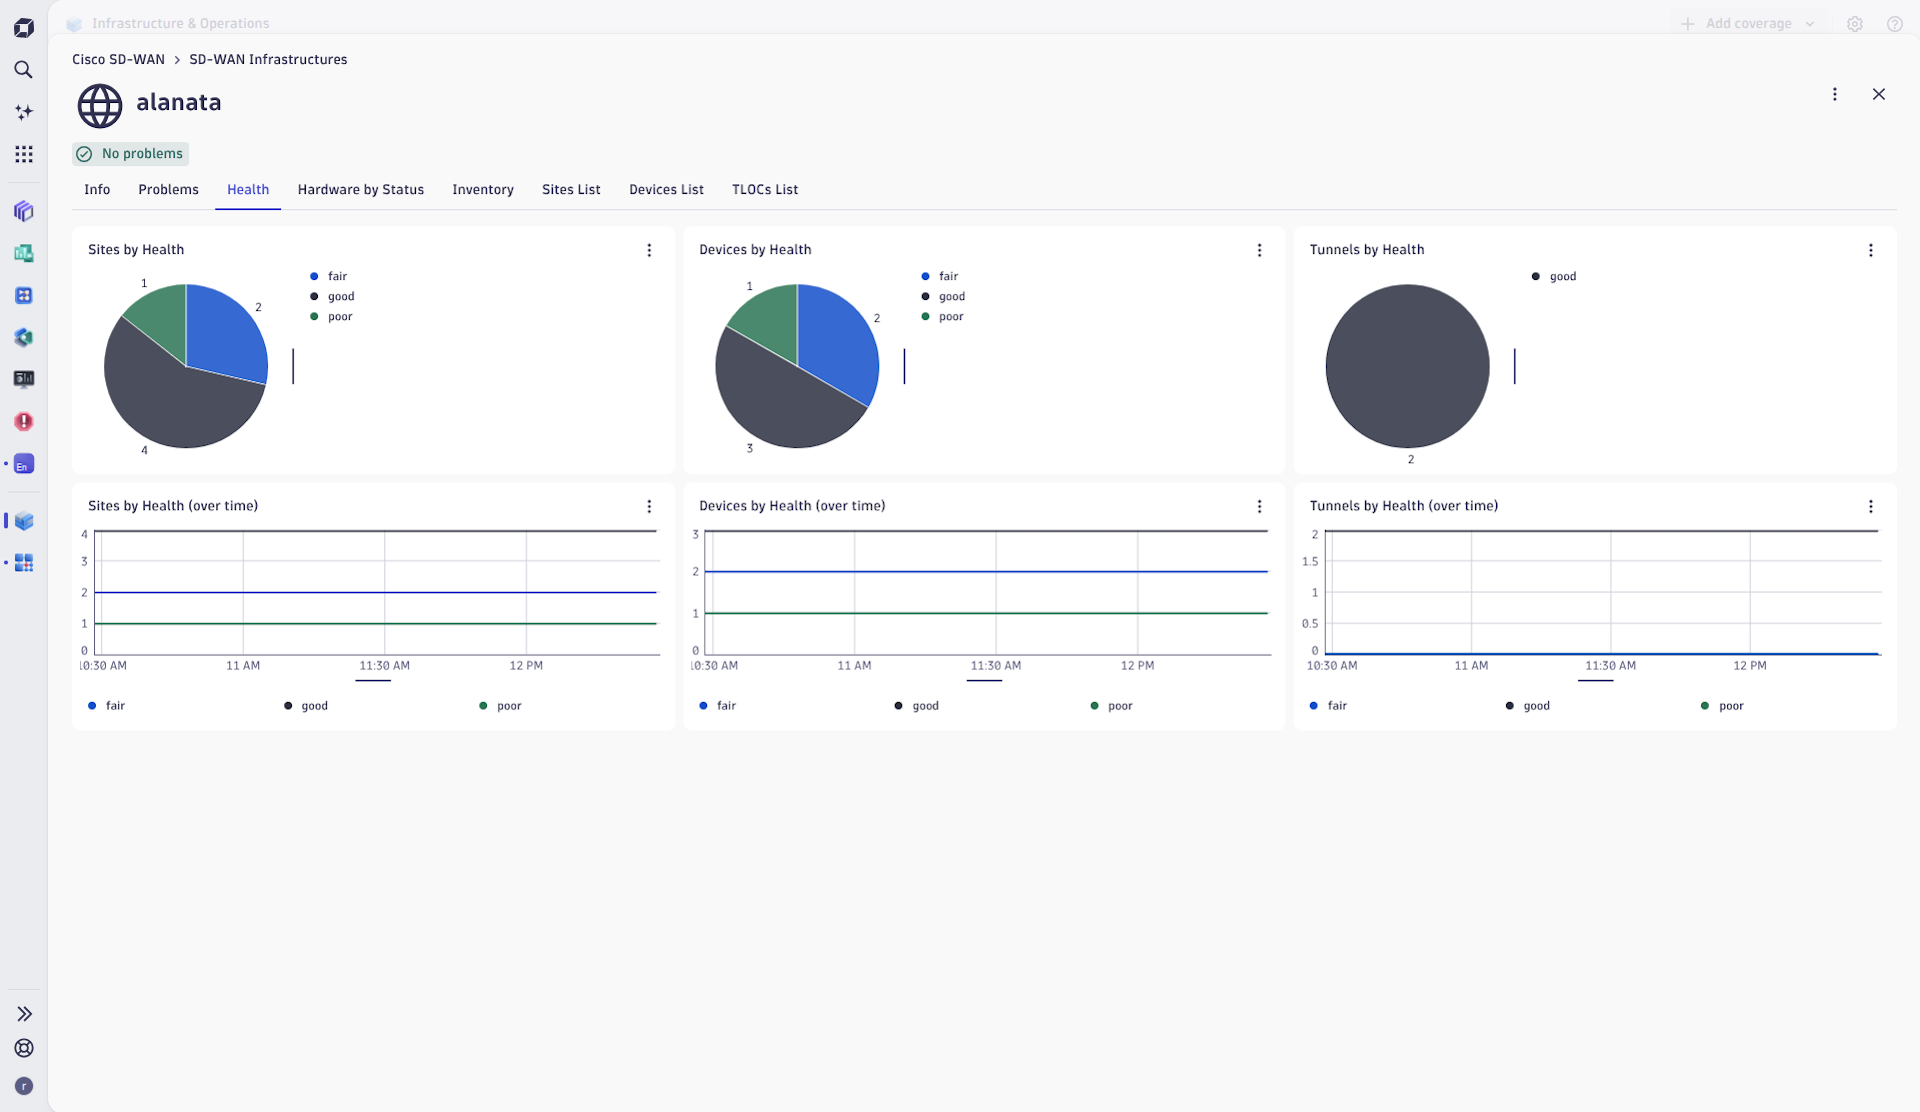
| Sites Health | cisco.sdwan.fabric_infra.site_health_count.gauge | Number of Sites per Health Code | Count |
| Devices Health | cisco.sdwan.fabric_infra.device_health_count.gauge | Number of Devices per Health Code | Count |
| Hardware Status | cisco.sdwan.fabric_infra.hardware_summary_count.gauge | Number of Devices per Hardware Status Code | Count |
| Inventory Status | cisco.sdwan.fabric_infra.inventory_summary_count.gauge | Number of Devices per Inventory Status Code | Count |
| Tunnels Health | cisco.sdwan.fabric_infra.tunnel_health_count.gauge | Number of Tunnels per Health Code | Count |
| Site Health | cisco.sdwan.site.site_health | Site Health Code Value (1 - Good, 3 - Fair, 5 - Poor) | Unspecified |
| Site's Devices Health | cisco.sdwan.site.devices_health | Site's Devices Health Code Value (1 - Good, 3 - Fair, 5 - Poor) | Unspecified |
| Site's Tunnels Health | cisco.sdwan.site.tunnels_health | Site's Tunnels Health Code Value (1 - Good, 3 - Fair, 5 - Poor) | Unspecified |
| Site's Apps Usage | cisco.sdwan.site.apps_usage | Site's Apps Usage | Byte |
| Metric name | Metric key | Description | Unit |
|---|---|---|---|
| - | com.dynatrace.extension.network_device.cpu_usage | - | - |
| - | com.dynatrace.extension.network_device.memory_usage | - | - |
| - | com.dynatrace.extension.network_device.sysuptime | - | - |
| - | com.dynatrace.extension.network_device.memory_used | - | - |
| - | com.dynatrace.extension.network_device.memory_free | - | - |
| - | com.dynatrace.extension.network_device.if.status | - | - |
| - | com.dynatrace.extension.network_device.if.bytes_in.count | - | - |
| - | com.dynatrace.extension.network_device.if.bytes_out.count | - | - |
| - | com.dynatrace.extension.network_device.if.in.errors.count | - | - |
| - | com.dynatrace.extension.network_device.if.out.errors.count | - | - |
| - | com.dynatrace.extension.network_device.if.in.discards.count | - | - |
| - | com.dynatrace.extension.network_device.if.out.discards.count | - | - |
| Metric name | Metric key | Description | Unit |
|---|---|---|---|
| CPU System | cisco.sdwan.device.cpu_system | SD-WAN Device CPU System Utilization | Percent |
| CPU User | cisco.sdwan.device.cpu_user | SD-WAN Device CPU User Utilization | Percent |
| CPU Idle | cisco.sdwan.device.cpu_idle | SD-WAN Device CPU Idle | Percent |
| Memory Used | cisco.sdwan.device.mem_used | SD-WAN Device Memory Used | Byte |
| Memory Free | cisco.sdwan.device.mem_free | SD-WAN Device Memory Free | Byte |
| Memory Buffers | cisco.sdwan.device.mem_buffers | SD-WAN Device Memory Buffers | Byte |
| Memory Cached | cisco.sdwan.device.mem_cached | SD-WAN Device Memory Cached | Byte |
| Processes Total | cisco.sdwan.device.totalp | SD-WAN Device Total Processes | Count |
| Processes Running | cisco.sdwan.device.runningp | SD-WAN Device Running Processes | Count |
| Disk Used | cisco.sdwan.device.disk_used | SD-WAN Device Disk Used | Byte |
| Disk Available | cisco.sdwan.device.disk_avail | SD-WAN Device Disk Available | Byte |
| Metric name | Metric key | Description | Unit |
|---|---|---|---|
| TLOC Control Connections Up | cisco.sdwan.device.circuit.control_connections_up | Number of active control connections from this transport to controllers | Count |
| TLOC Control Connections Down | cisco.sdwan.device.circuit.control_connections_down | Number of failed control connections from this transport to controllers | Count |
| TLOC BFD Sessions Up | cisco.sdwan.device.circuit.bfd_sessions_up | Active BFD sessions on this transport (edge routers only; absent on controllers) | Count |
| TLOC BFD Sessions Down | cisco.sdwan.device.circuit.bfd_sessions_down | Inactive BFD sessions on this transport (edge routers only; absent on controllers) | Count |
| TLOC Control Connections to vSmarts | cisco.sdwan.device.circuit.control_connections_to_vsmarts | Number of active control connections to vSmart controllers (controllers only; absent on edge routers) | Count |
| TLOC Expected Control Connections | cisco.sdwan.device.circuit.expected_control_connections | Expected number of control connections from this transport (sparse; present on vSmarts and vManage) | Count |
| Metric name | Metric key | Description | Unit |
|---|---|---|---|
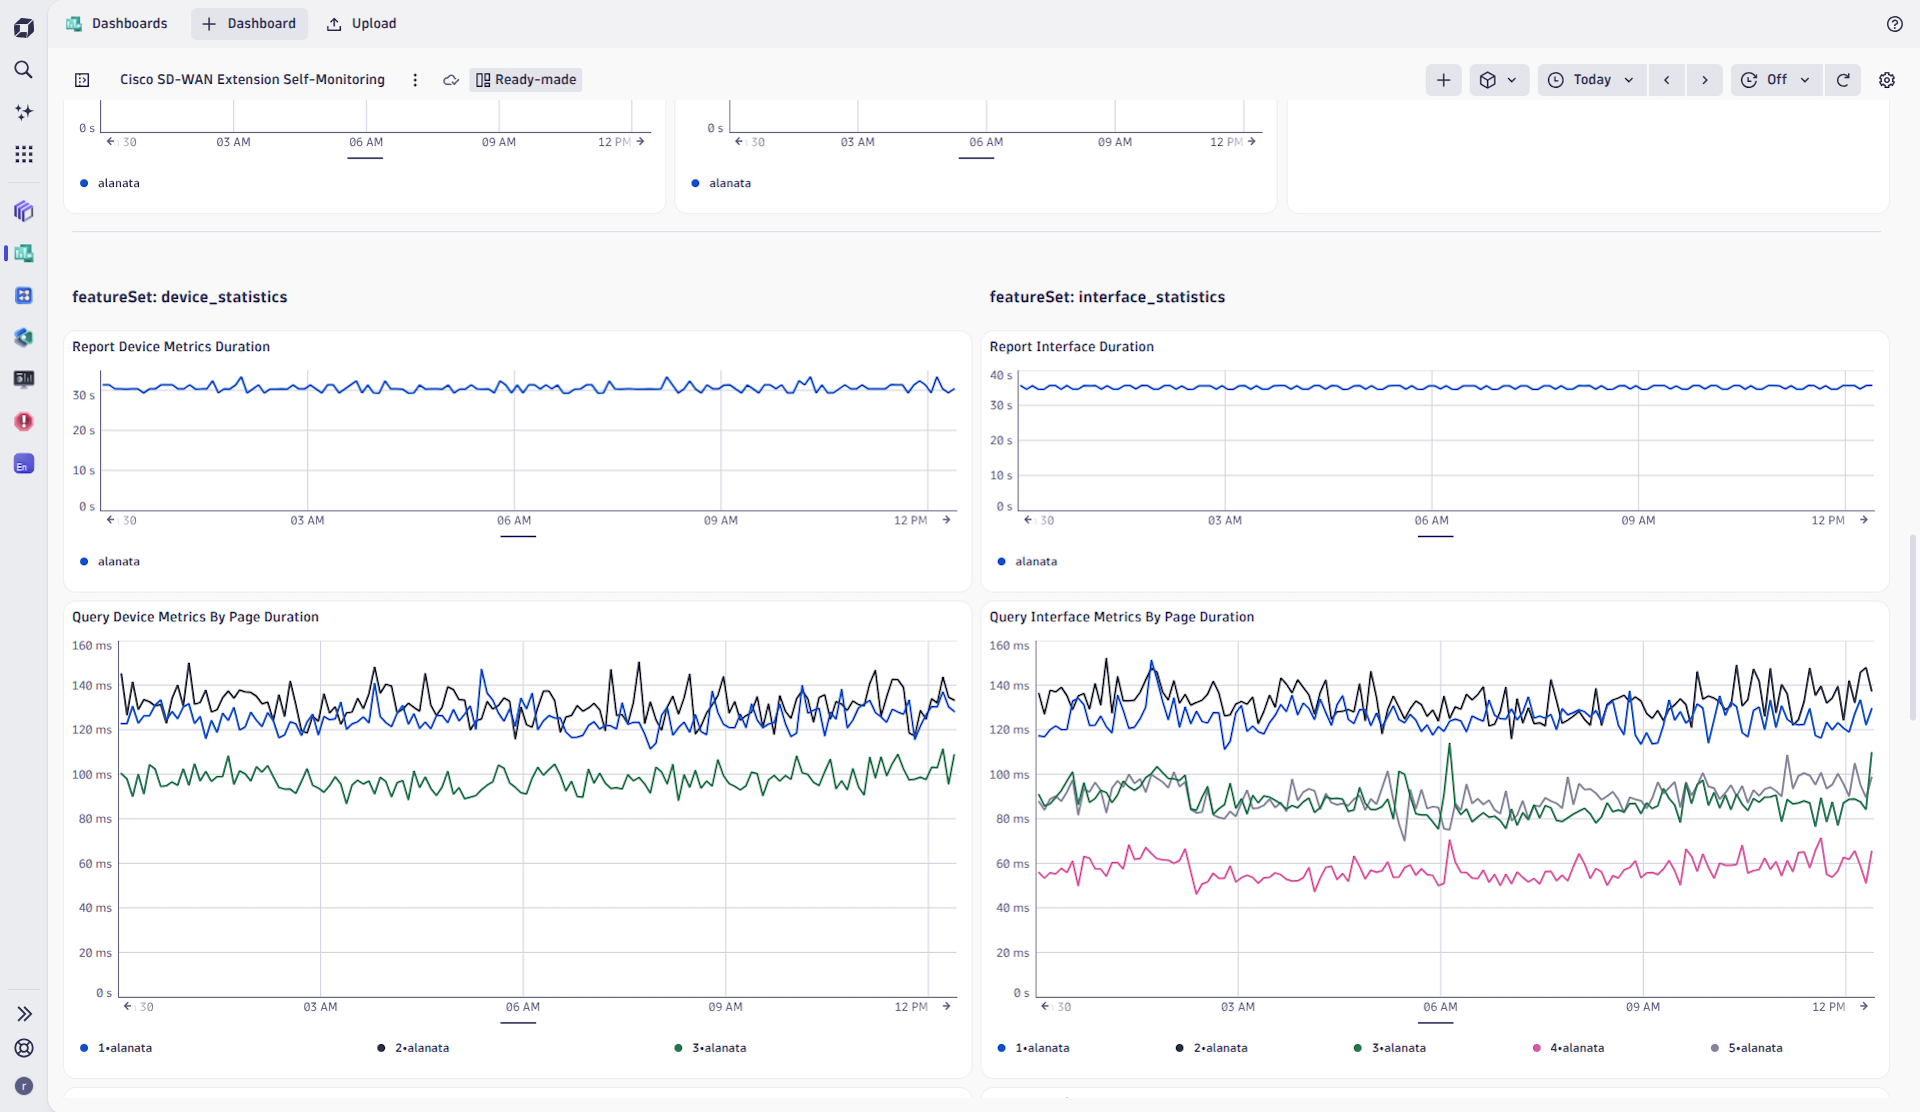
| Total duration of all rate-limited executed queries to all connection urls to collect data reported as metrics | sfm.cisco.sdwan.monitor.run.total.duration | - | Second |
| Total duration of all rate-limited synchronously executed queries to all connection urls to collect data reported as metrics | sfm.cisco.sdwan.monitor.run.sync.duration | - | Second |
| Metrics Data Collection Overall Asynchronous Time | sfm.cisco.sdwan.monitor.run.async.duration | Total duration of all rate-limited asynchronously executed queries to all connection urls to collect data reported as metrics | Second |
| Metrics Data Collection Error | sfm.cisco.sdwan.monitor.run.error | Indicates whether an unhandled error occurred during execution of Metrics Data Collection. | Count |
| get_site_health_stats Query Time | sfm.cisco.sdwan.get_site_health_stats.duration | - | Second |
| get_site_health_stats Error | sfm.cisco.sdwan.get_site_health_stats.error | Indicates whether an error occurred during get_site_health_stats Query | Count |
| report_site_health_stats Overall Time | sfm.cisco.sdwan.report_site_health_stats.duration | - | Second |
| report_site_health_stats Error | sfm.cisco.sdwan.report_site_health_stats.error | Indicates whether an error occurred during report_site_health_stats | Count |
| get_vedge_inventory_summary Query Time | sfm.cisco.sdwan.get_vedge_inventory_summary.duration | - | Second |
| get_vedge_inventory_summary Error | sfm.cisco.sdwan.get_vedge_inventory_summary.error | Indicates whether an error occurred during get_vedge_inventory_summary Query | Count |
| report_vedge_inventory_summary Overall Time | sfm.cisco.sdwan.report_vedge_inventory_summary.duration | - | Second |
| report_vedge_inventory_summary Error | sfm.cisco.sdwan.report_vedge_inventory_summary.error | Indicates whether an error occurred during report_vedge_inventory_summary | Count |
| get_device_health_overview_stats Query Time | sfm.cisco.sdwan.get_device_health_overview_stats.duration | - | Second |
| get_device_health_overview_stats Error | sfm.cisco.sdwan.get_device_health_overview_stats.error | Indicates whether an error occurred during get_device_health_overview_stats Query | Count |
| report_device_health_overview Overall Time | sfm.cisco.sdwan.report_device_health_overview.duration | - | Second |
| report_device_health_overview Error | sfm.cisco.sdwan.report_device_health_overview.error | Indicates whether an error occurred during report_device_health_overview | Count |
| get_hardware_health_summary Query Time | sfm.cisco.sdwan.get_hardware_health_summary.duration | - | Second |
| get_hardware_health_summary Error | sfm.cisco.sdwan.get_hardware_health_summary.error | Indicates whether an error occurred during get_hardware_health_summary Query | Count |
| report_hardware_health_summary Overall Time | sfm.cisco.sdwan.report_hardware_health_summary.duration | - | Second |
| report_hardware_health_summary Error | sfm.cisco.sdwan.report_hardware_health_summary.error | Indicates whether an error occurred during report_hardware_health_summary | Count |
| get_remote_system_cardinality Query Time | sfm.cisco.sdwan.get_remote_system_cardinality.duration | - | Second |
| get_remote_system_cardinality Error | sfm.cisco.sdwan.get_remote_system_cardinality.error | Indicates whether an error occurred during get_approute_statistics_remote_system_cardinality Query | Count |
| report_remote_system_cardinality Overall Time | sfm.cisco.sdwan.report_remote_system_cardinality.duration | - | Second |
| report_remote_system_cardinality Error | sfm.cisco.sdwan.report_remote_system_cardinality.error | Indicates whether an error occurred during report_remote_system_cardinality | Count |
| get_tunnel_health_overview Query Time | sfm.cisco.sdwan.get_tunnel_health_overview.duration | - | Second |
| get_tunnel_health_overview Error | sfm.cisco.sdwan.get_tunnel_health_overview.error | Indicates whether an error occurred during get_tunnel_health_overview Query | Count |
| report_tunnel_health_overview Overall Time | sfm.cisco.sdwan.report_tunnel_health_overview.duration | - | Second |
| report_tunnel_health_overview Error | sfm.cisco.sdwan.report_tunnel_health_overview.error | Indicates whether an error occurred during report_tunnel_health_overview | Count |
| get_approute_statistics_aggregation Query Time | sfm.cisco.sdwan.get_approute_statistics_aggregation.duration | - | Second |
| get_approute_statistics_aggregation Error | sfm.cisco.sdwan.get_approute_statistics_aggregation.error | Indicates whether an error occurred during get_approute_statistics_aggregation Query | Count |
| report_statistics_approute Overall Time | sfm.cisco.sdwan.report_statistics_approute.duration | - | Second |
| report_statistics_approute Error | sfm.cisco.sdwan.report_statistics_approute.error | Indicates whether an error occurred during report_statistics_approute | Count |
| get_devices_health Query Time | sfm.cisco.sdwan.get_devices_health.duration | - | Second |
| get_devices_health Error | sfm.cisco.sdwan.get_devices_health.error | Indicates whether an error occurred during get_devices_health Query | Count |
| report_devices_health Overall Time | sfm.cisco.sdwan.report_devices_health.duration | - | Second |
| report_devices_health Error | sfm.cisco.sdwan.report_devices_health.error | Indicates whether an error occurred during report_devices_health | Count |
| get_statistics_system_aggregation Query Time | sfm.cisco.sdwan.get_statistics_system_aggregation.duration | - | Second |
| get_statistics_system_aggregation Error | sfm.cisco.sdwan.get_statistics_system_aggregation.error | Indicates whether an error occurred during get_statistics_system_aggregation Query | Count |
| get_interface_statistics Query Time | sfm.cisco.sdwan.get_interface_statistics.duration | - | Second |
| get_interface_statistics Error | sfm.cisco.sdwan.get_interface_statistics.error | Indicates whether an error occurred during get_interface_statistics Query | Count |
| report_statistics_system Overall Time | sfm.cisco.sdwan.report_statistics_system.duration | - | Second |
| report_statistics_system Error | sfm.cisco.sdwan.report_statistics_system.error | Indicates whether an error occurred during report_statistics_system | Count |
| report_statistics_interface Overall Time | sfm.cisco.sdwan.report_statistics_interface.duration | - | Second |
| report_statistics_interface Error | sfm.cisco.sdwan.report_statistics_interface.error | Indicates whether an error occurred during report_statistics_interface | Count |
| - | sfm.cisco.sdwan.get_alarms_count.duration | - | - |
| - | sfm.cisco.sdwan.get_alarms_count.error | - | - |
| - | sfm.cisco.sdwan.get_alarms_aggregation.duration | - | - |
| - | sfm.cisco.sdwan.get_alarms_aggregation.error | - | - |
| - | sfm.cisco.sdwan.get_alarms.duration | - | - |
| - | sfm.cisco.sdwan.get_alarms.error | - | - |
| - | sfm.cisco.sdwan.report_alarm_counts.duration | - | - |
| - | sfm.cisco.sdwan.report_alarm_counts.error | - | - |
| - | sfm.cisco.sdwan.report_alarm_log_events.duration | - | - |
| - | sfm.cisco.sdwan.report_alarm_log_events.error | - | - |
| get_tloc_status Query Time | sfm.cisco.sdwan.get_tloc_status.duration | - | Second |
| get_tloc_status Error | sfm.cisco.sdwan.get_tloc_status.error | Indicates whether an error occurred during get_tloc_status Query | Count |
| report_tloc_status Overall Time | sfm.cisco.sdwan.report_tloc_status.duration | - | Second |
| report_tloc_status Error | sfm.cisco.sdwan.report_tloc_status.error | Indicates whether an error occurred during report_tloc_status | Count |
| Metric name | Metric key | Description | Unit |
|---|---|---|---|
| Admin Status | cisco.sdwan.interface.admin_status | SD-WAN Interface Admin Status | Unspecified |
| Oper Status | cisco.sdwan.interface.oper_status | SD-WAN Interface Oper Status | Unspecified |
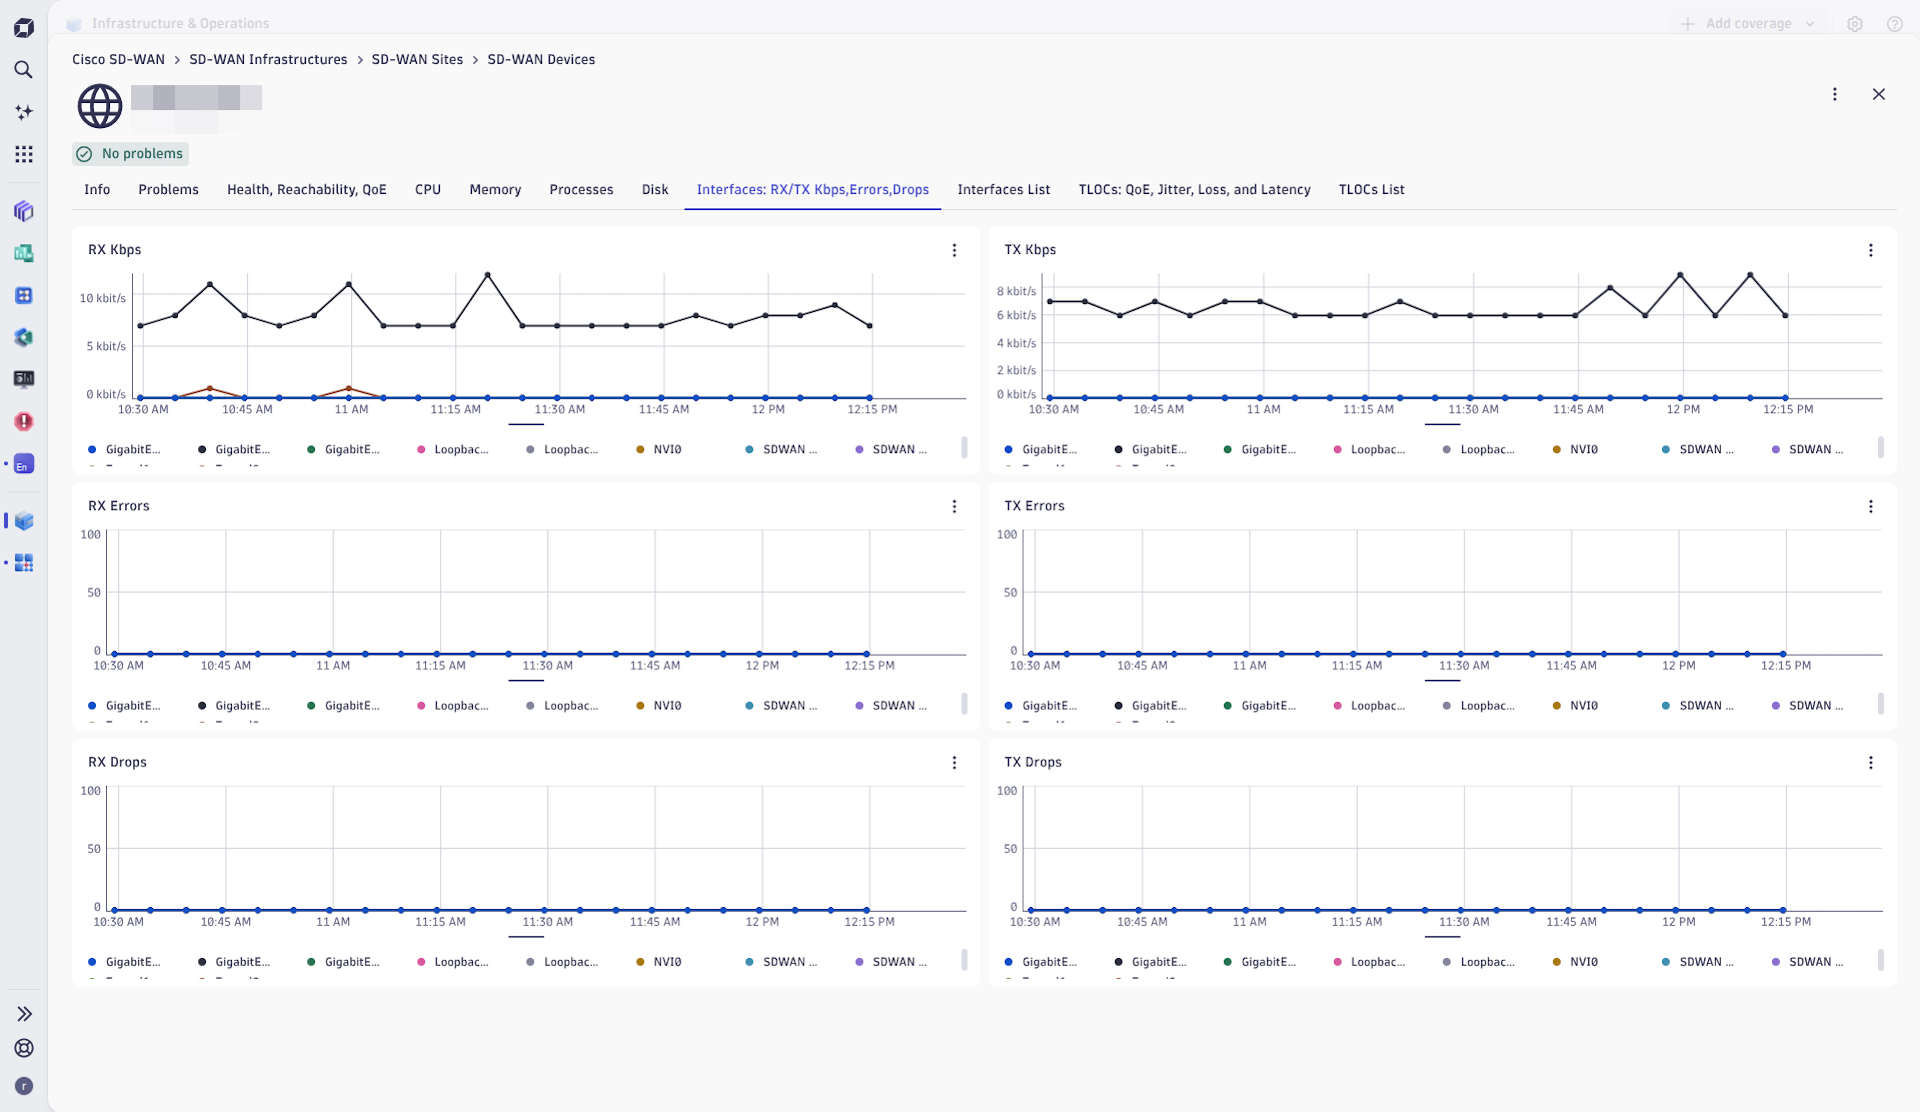
| RX Packets | cisco.sdwan.interface.rx_pkts | SD-WAN Interface Packets Recieved | Count |
| RX Octets | cisco.sdwan.interface.rx_octets | SD-WAN Interface Octets Recieved | Byte |
| RX Errors | cisco.sdwan.interface.rx_errors | SD-WAN Interface RX Errors | Count |
| RX Drops | cisco.sdwan.interface.rx_drops | SD-WAN Interface RX Drops | Count |
| RX Packets Per Second | cisco.sdwan.interface.rx_pps | SD-WAN Interface Recieved Packets Per Second | PerSecond |
| RX KiloBit Per Second | cisco.sdwan.interface.rx_kbps | SD-WAN Interface Recieved KiloBit Per Second | KiloBitPerSecond |
| TX Packets | cisco.sdwan.interface.tx_pkts | SD-WAN Interface Packets Transmitted | Count |
| TX Octets | cisco.sdwan.interface.tx_octets | SD-WAN Interface Octets Transmitted | Byte |
| TX Errors | cisco.sdwan.interface.tx_errors | SD-WAN Interface TX Errors | Count |
| TX Drops | cisco.sdwan.interface.tx_drops | SD-WAN Interface TX Drops | Count |
| TX Packets Per Second | cisco.sdwan.interface.tx_pps | SD-WAN Interface Transmitted Packets Per Second | PerSecond |
| TX KiloBit Per Second | cisco.sdwan.interface.tx_kbps | SD-WAN Interface Transmitted KiloBit Per Second | KiloBitPerSecond |
| Uplink Capacity Utilization | cisco.sdwan.interface.up_cap_perc | SD-WAN Interface Uplink Capacity Utilization | Percent |
| Downlink Capacity Utilization | cisco.sdwan.interface.down_cap_perc | SD-WAN Interface Downlink Capacity Usage | Percent |
| Metric name | Metric key | Description | Unit |
|---|---|---|---|
| - | com.dynatrace.extension.network_device.if.in.pkts.count | - | - |
| - | com.dynatrace.extension.network_device.if.out.pkts.count | - | - |
| Metric name | Metric key | Description | Unit |
|---|---|---|---|
| Alarm Count | cisco.sdwan.device.alarm_count.gauge | SD-WAN Device Alarm Count | Count |
| Metric name | Metric key | Description | Unit |
|---|---|---|---|
| CPU Load | cisco.sdwan.device.cpu_load | SD-WAN Device CPU Load | Percent |
| Memory Utilization | cisco.sdwan.device.memory_utilization | SD-WAN Device Memory Utilization | Percent |
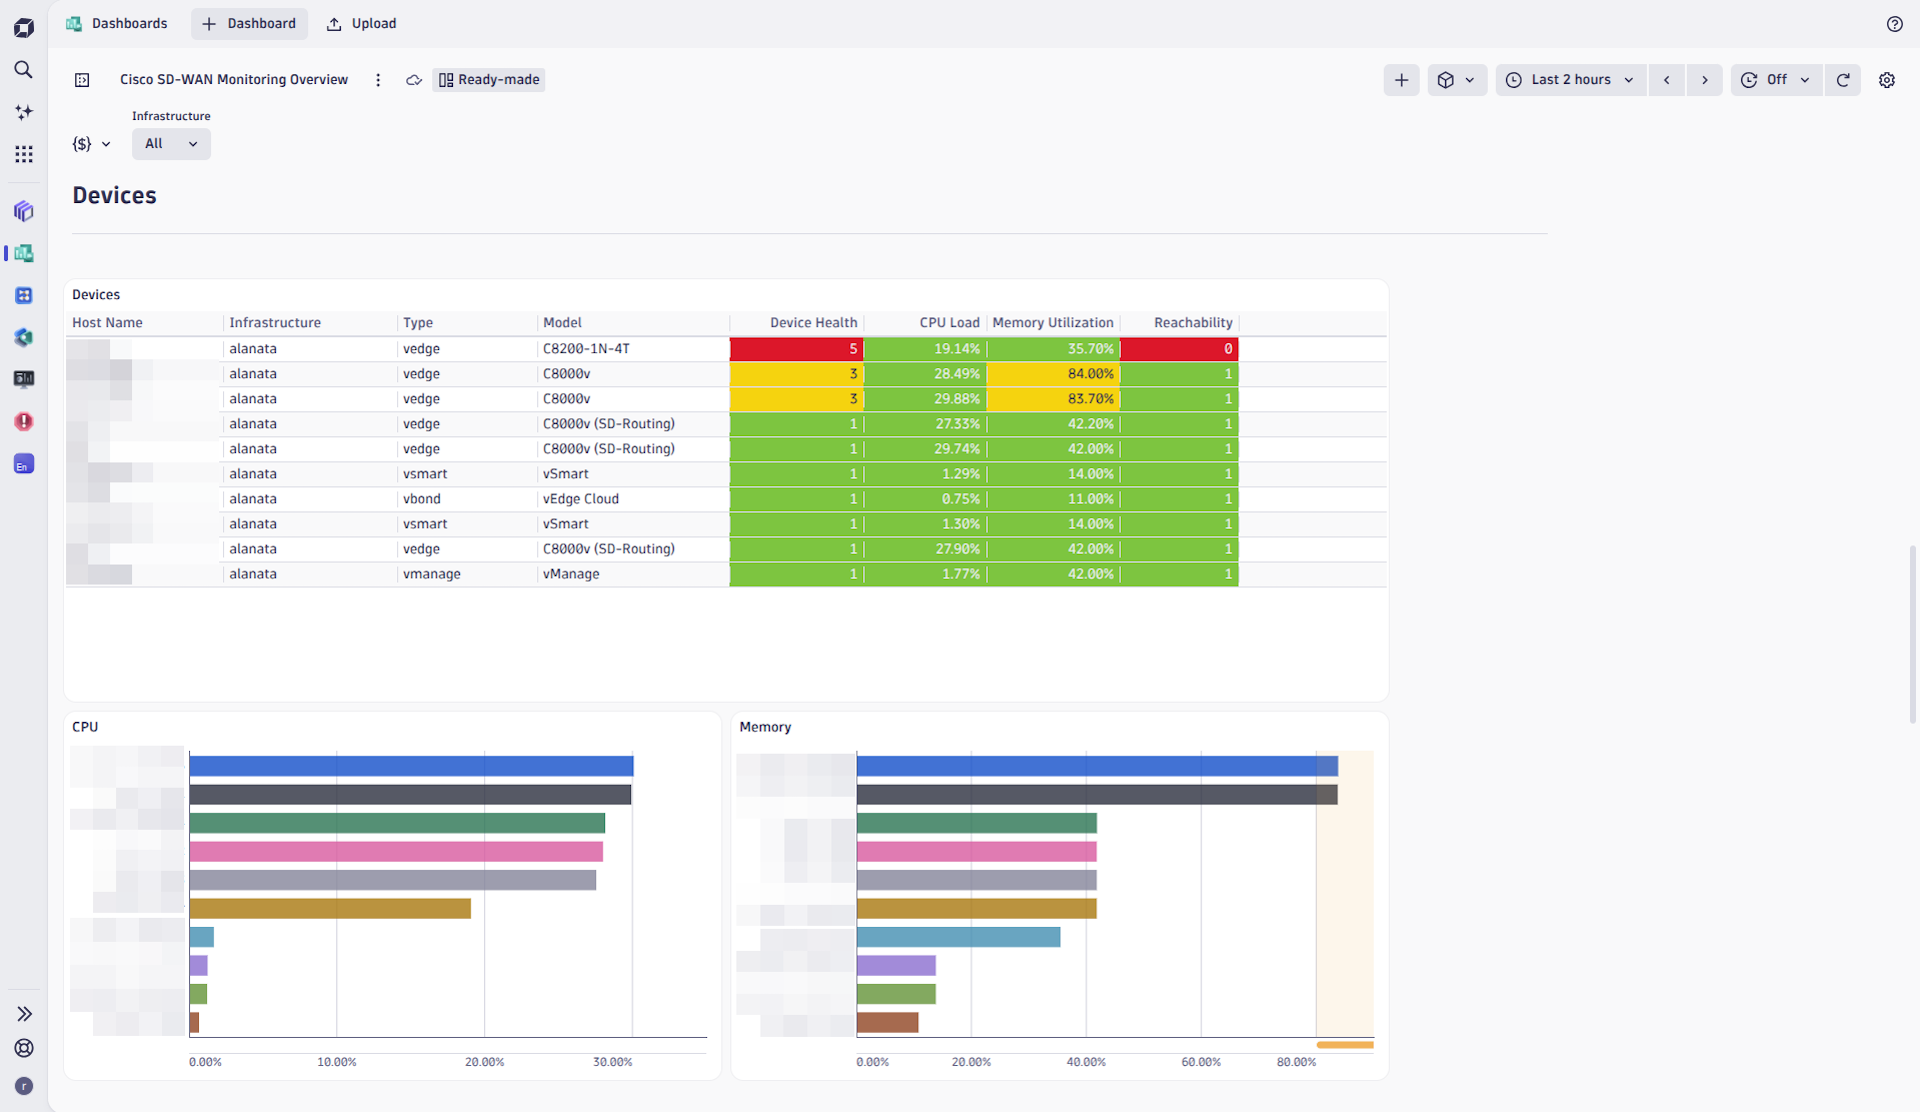
| Device Health | cisco.sdwan.device.health | SD-WAN Device Health Code Value (1 - green, 3 - yellow, 5 - red) | Unspecified |
| Device Reachability | cisco.sdwan.device.reachability | SD-WAN Device Reachability Code Value (1 - reachable, 0 - unreachable) | Unspecified |
| Device QoE | cisco.sdwan.device.qoe | SD-WAN Device QoE Score | Unspecified |
circuit_availability
feature set to be enabled. Its sliding window is sized for the default 5-minute collection
frequency — if you change metrics_collection_frequency_minutes, set the template's
slidingWindow to 3 × frequency + 1.cisco.sdwan.tloc.loss_percentage will drop substantially after this upgrade.cisco.sdwan.device.alarm_count.gaugecisco.sdwan.site.devices_health metric reporting wrong value (was using site health instead of devices health).dt.ip_addresses property on devices.This is the first release of the Cisco SD-WAN extension. Looking forward to your feedback on the Dynatrace Community.