























Skip to technology filters Skip to main content
Dynatrace Hub

Extend the platform,
empower your team.

Popular searches:
Home hero bg
ApigeeApigee
Apigee

Apigee

Remotely monitor your Apigee proxies.

Extension
Free trialDocumentation
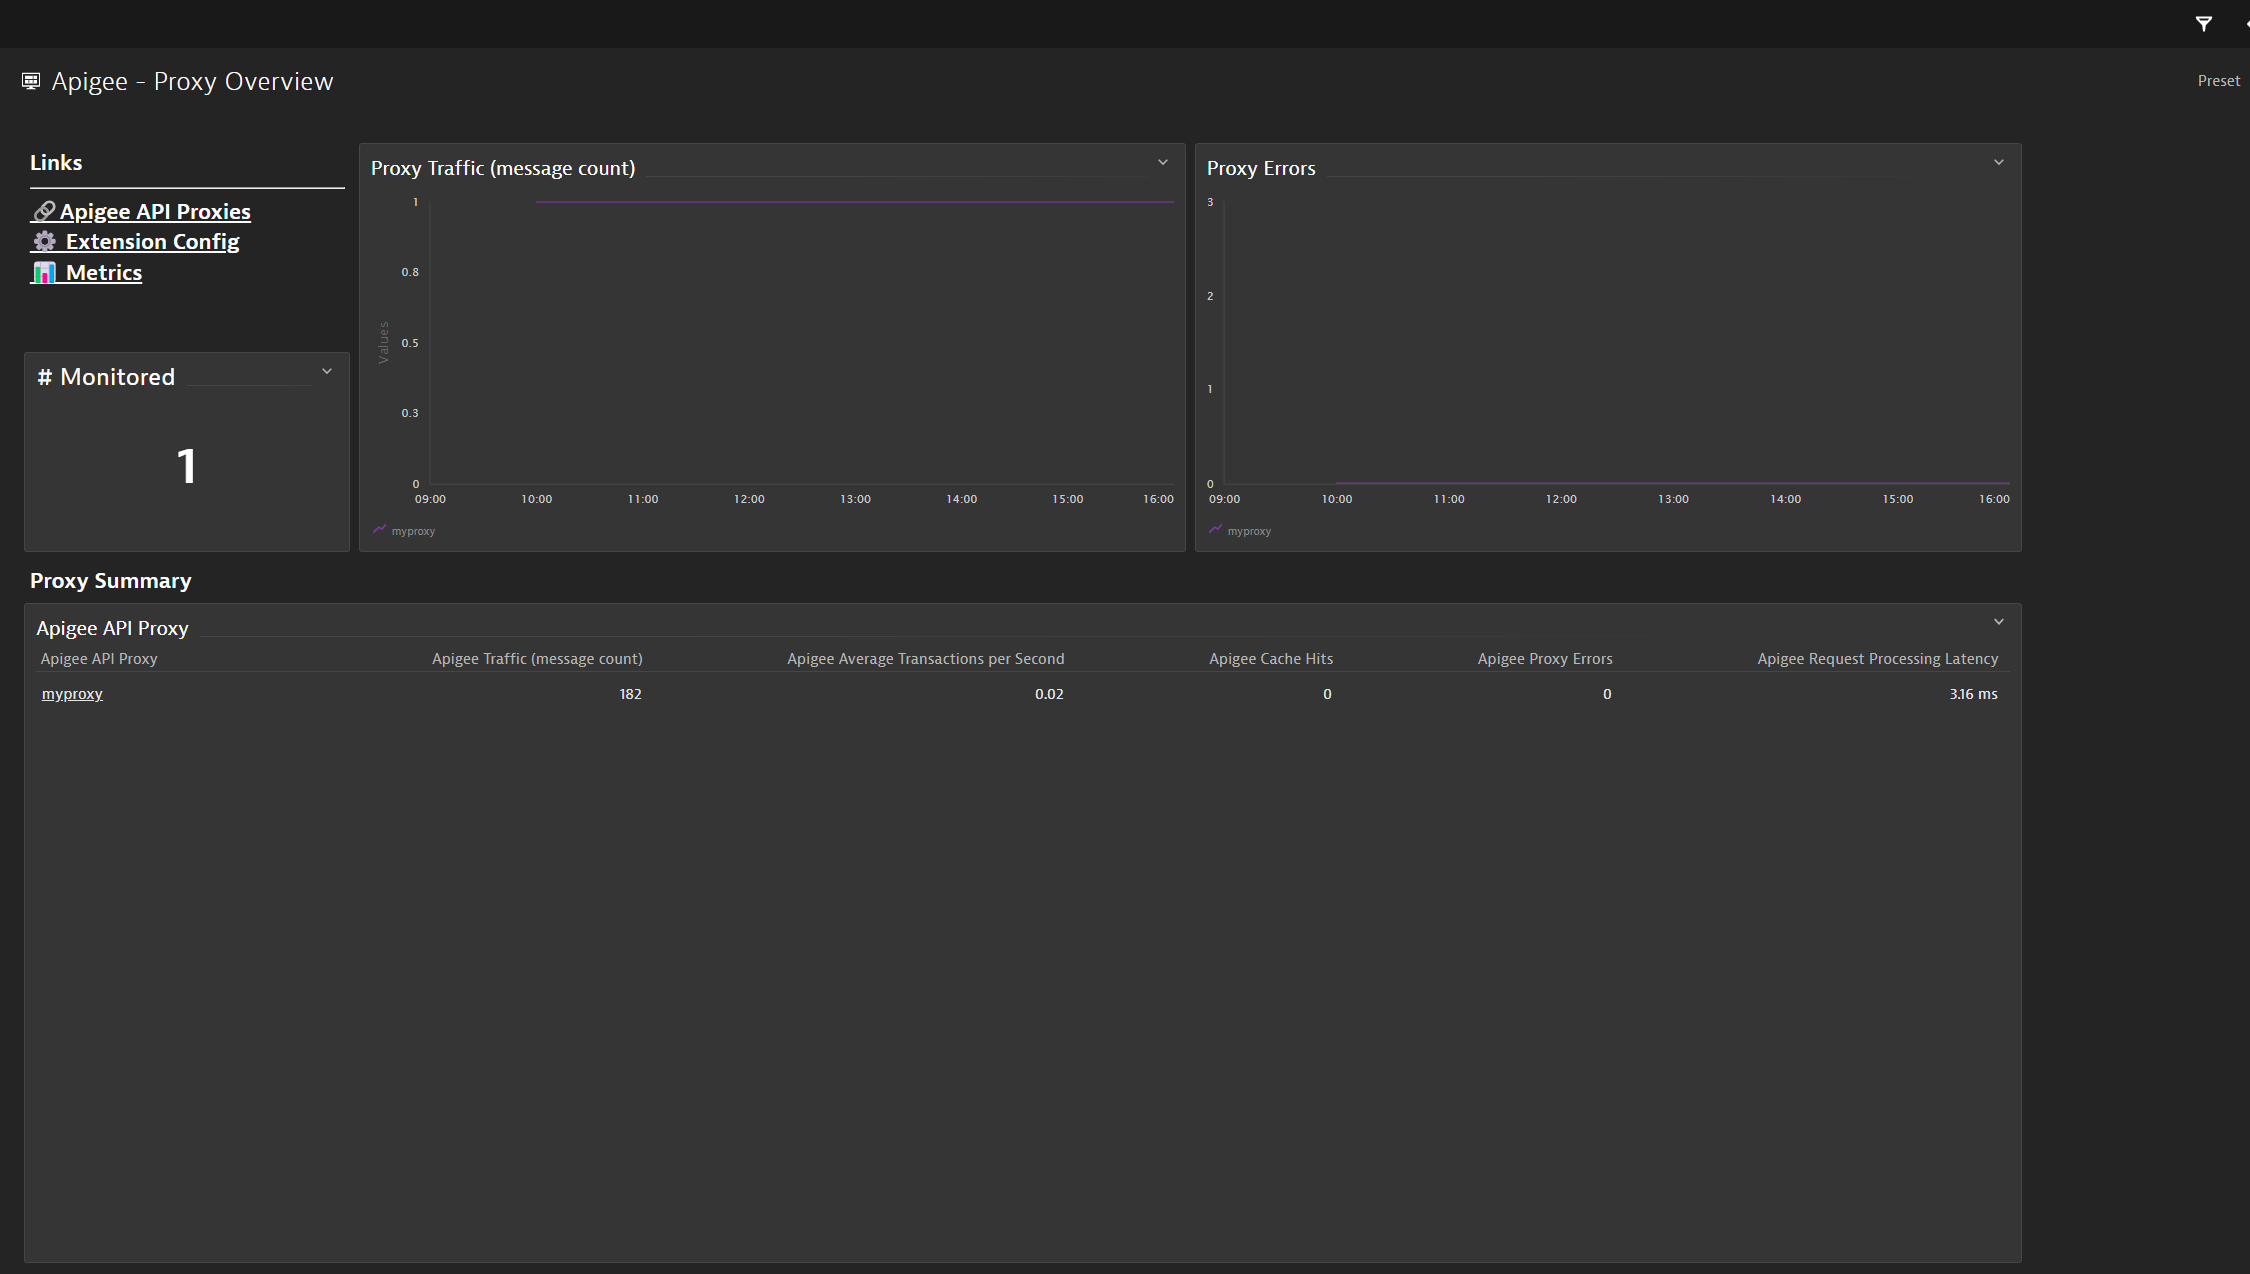
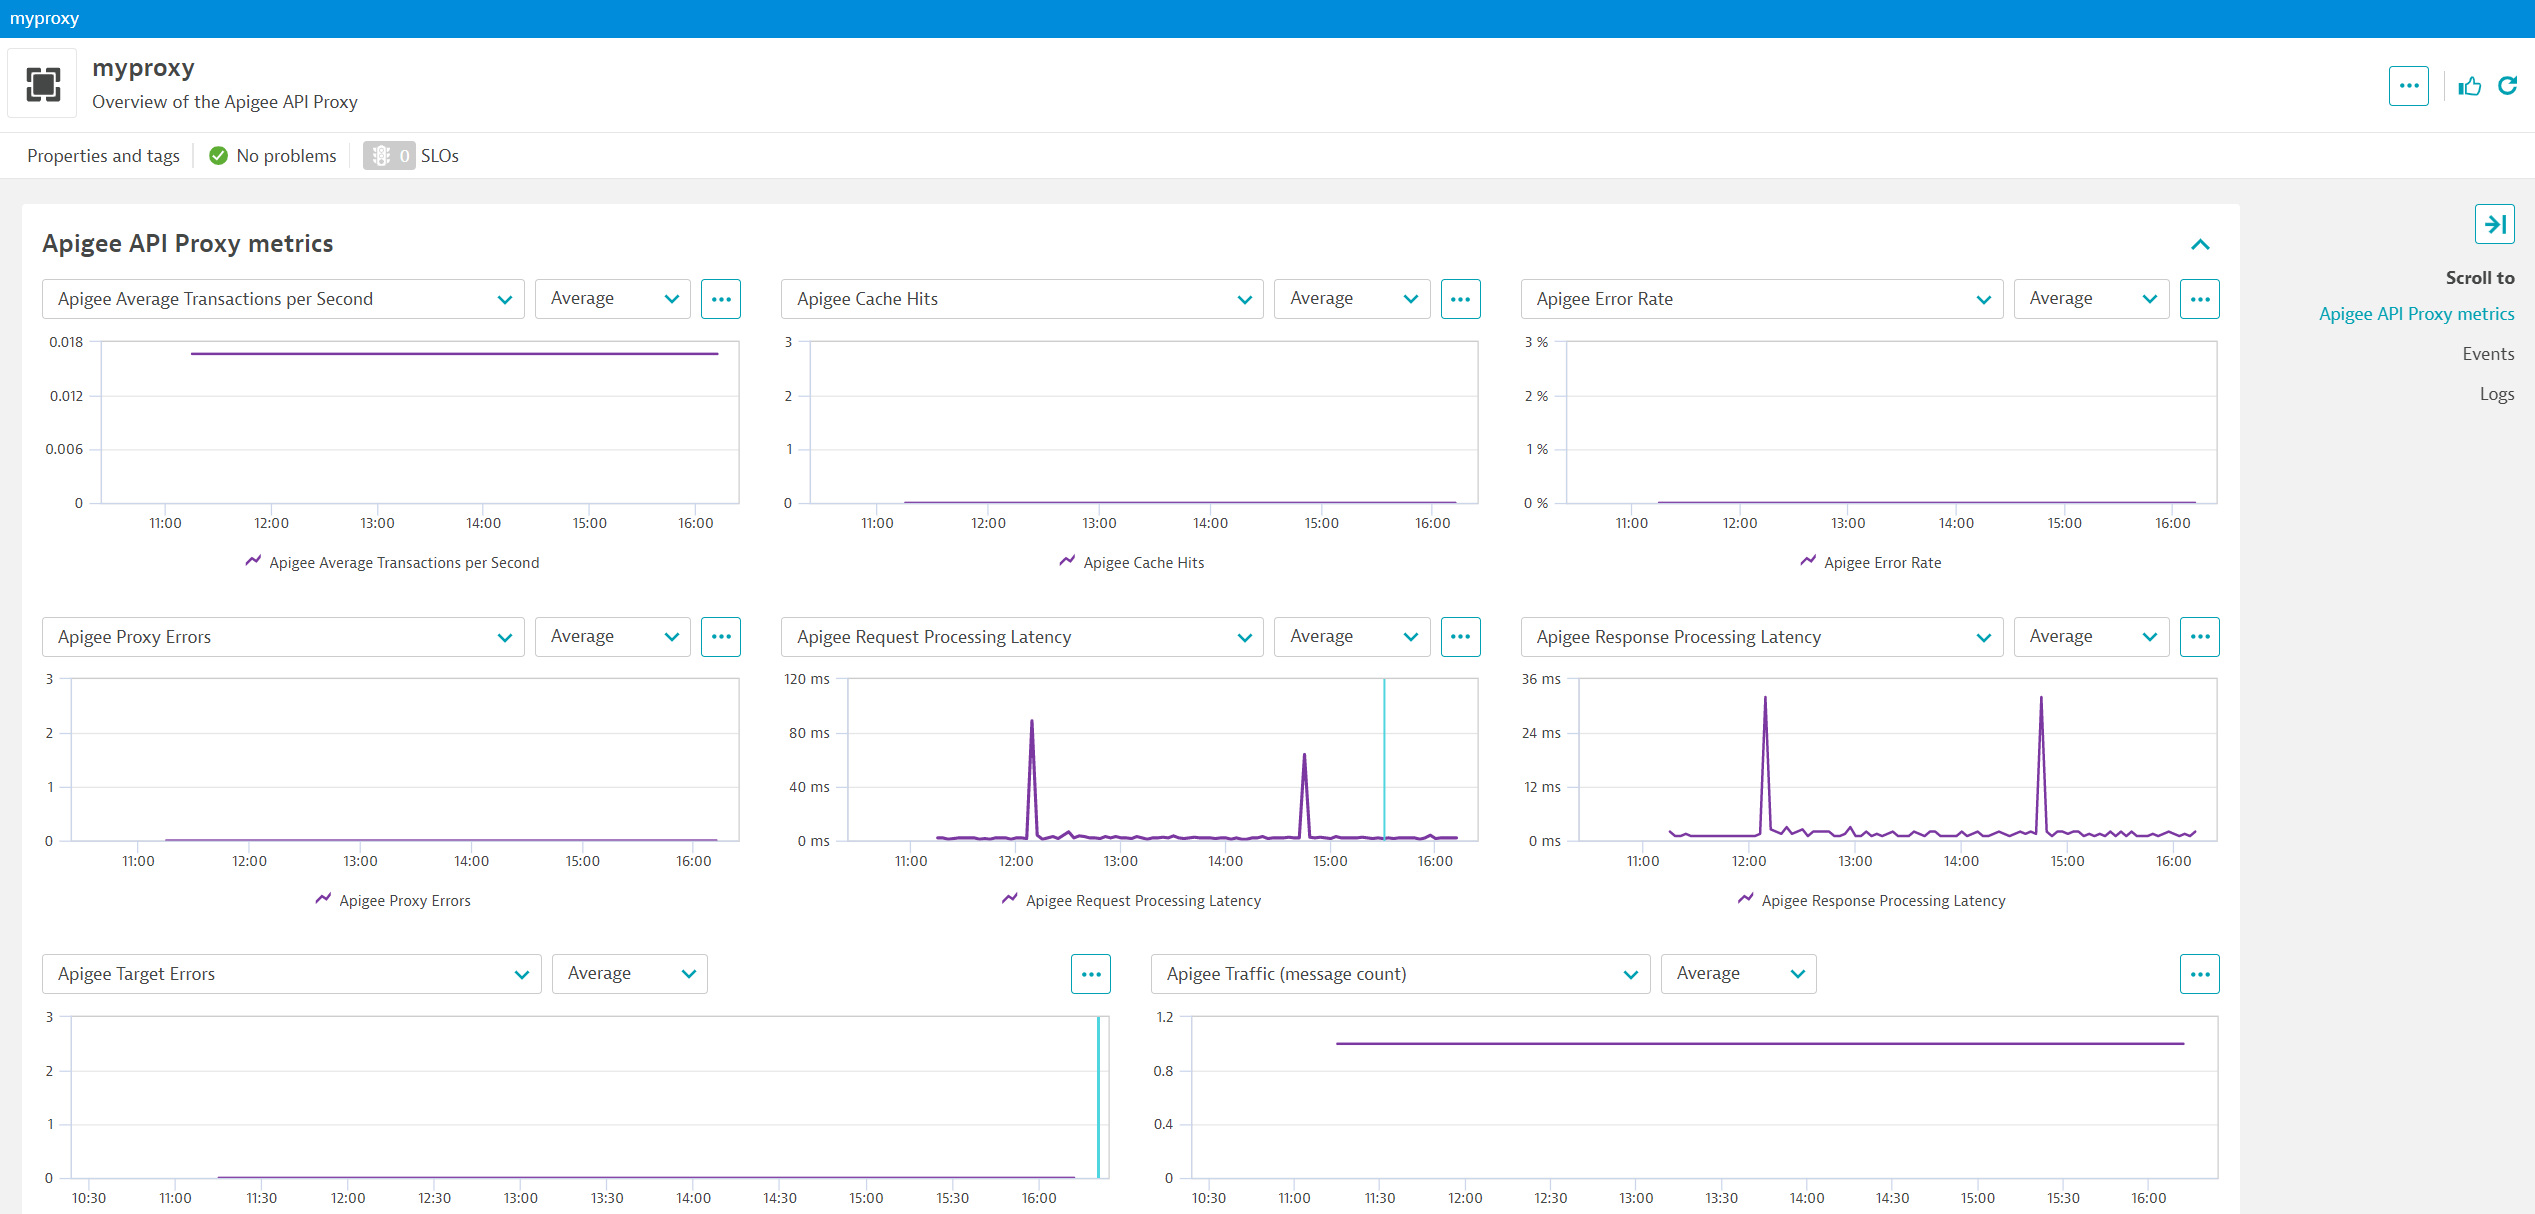
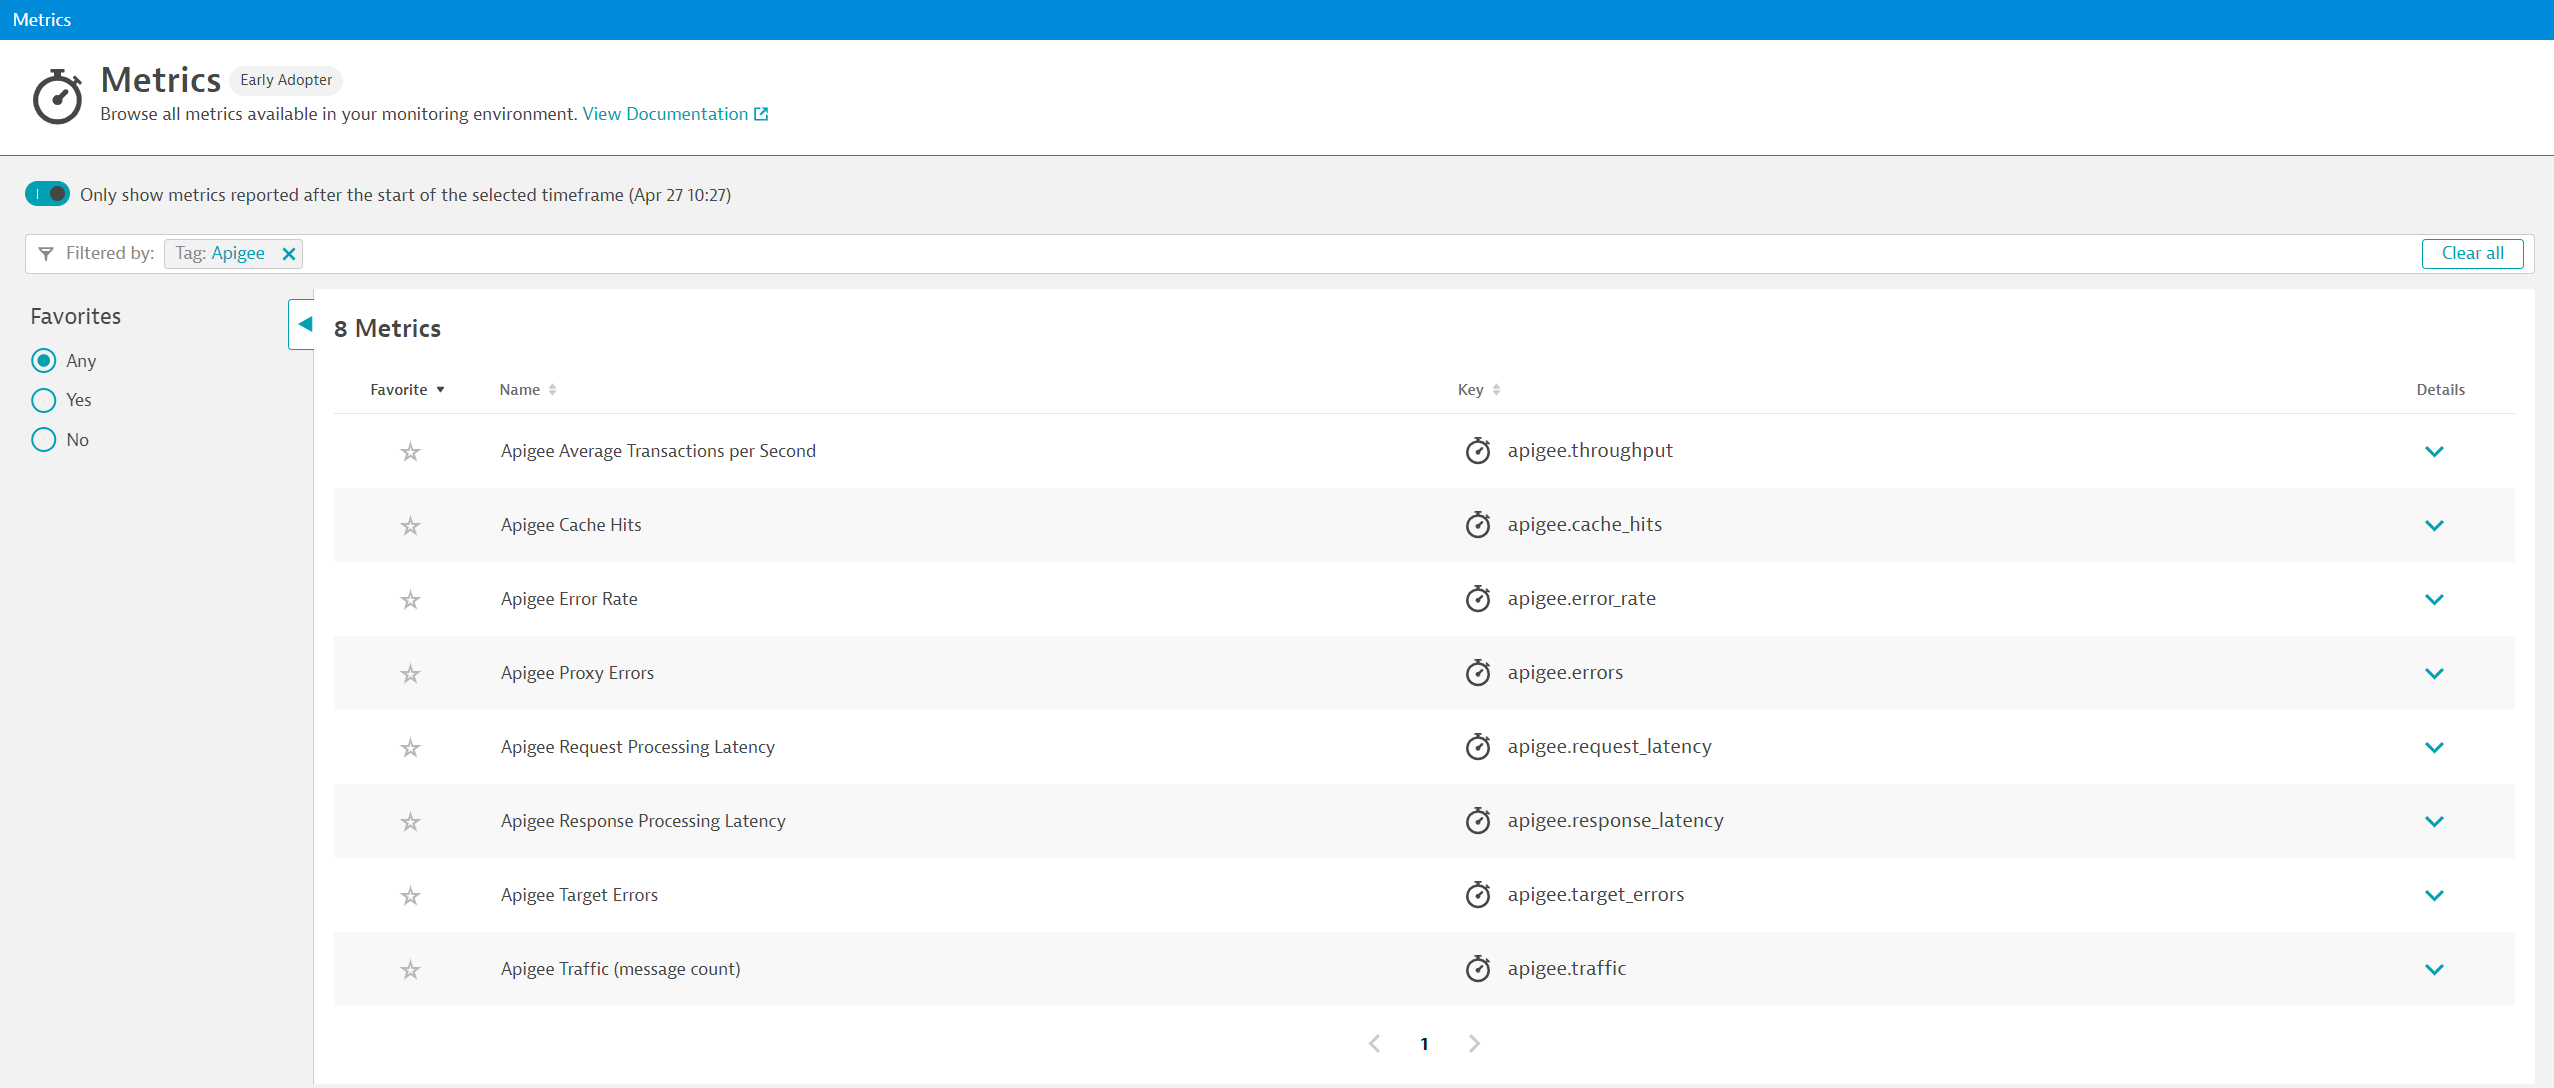
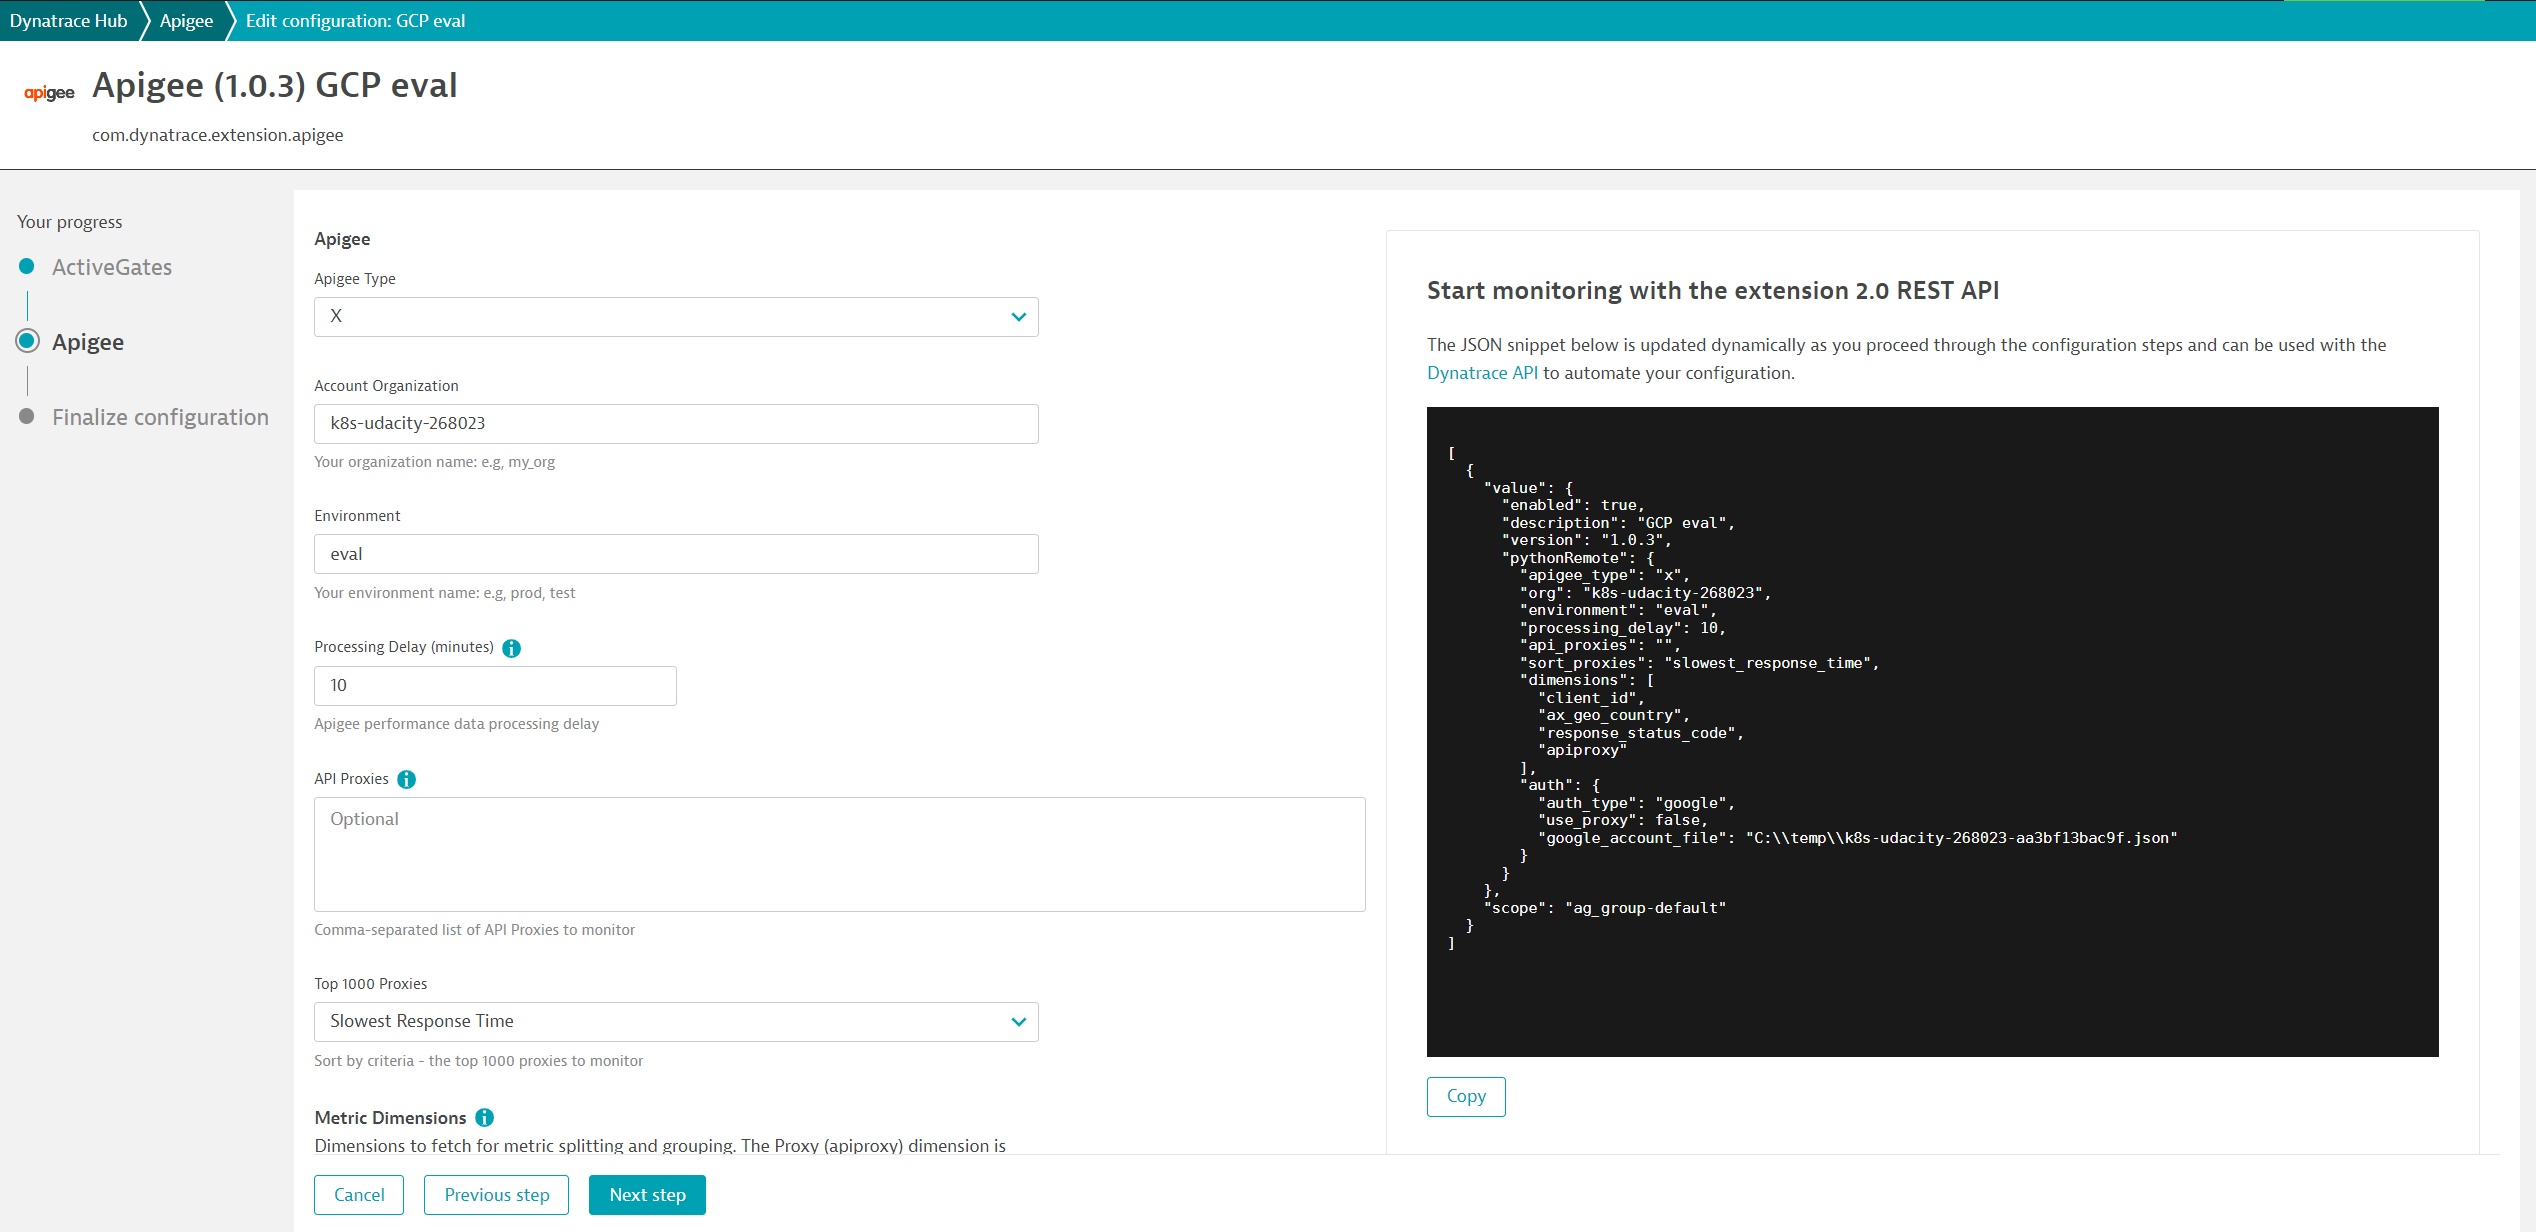
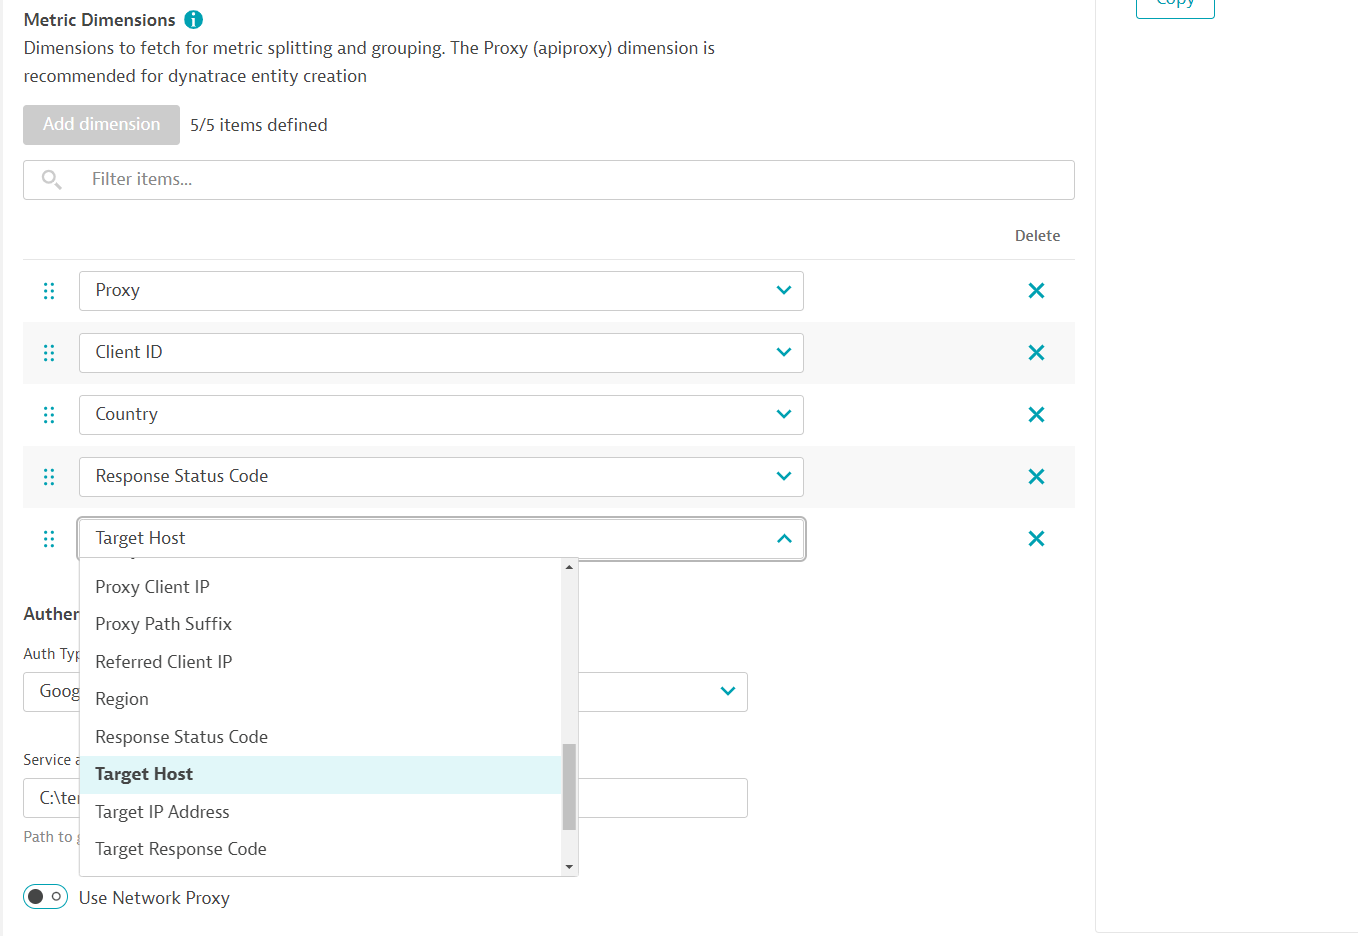
Apigee overview dashboardApigee proxy entityApigee metricsApigee configurationApigee dimension selection
  • Product information
  • Release notes

Overview

This extension provides the ability to remotely monitor Apigee through the Analytics Metrics API. Every minute, this extension polls Apigee to ingest data about how each proxy is performing.

This is intended for users, who:

  • Would like to monitor the health and performance of the Apigee proxies
  • Look for analysis support for Ops, IT and developers.

This enables you to:

  • Monitor Apigee with a dedicated dashboard and Dynatrace entities to represent each proxy
  • Detect anomalies and alert on them

Use cases

The extension enables insights into the overall health of Apigee and API proxies.

Get started

For more information on the installation and configuration, please see Apigee extension in the Dynatrace Documentation.

Details

Compatibility information

  • Apigee Edge
  • Apigee Private Cloud
  • Apigee X (Google cloud platform)
  • Apigee Hybrid (Google cloud platform)
Dynatrace
Documentation
By Dynatrace
Dynatrace support center
Subscribe to new releases
Copy to clipboard

Feature sets

Below is a complete list of the feature sets provided in this version. To ensure a good fit for your needs, individual feature sets can be activated and deactivated by your administrator during configuration.

Feature setsNumber of metrics included
Metric nameMetric keyDescriptionUnit
Apigee Policy Errorsapigee.policy_errorsThe total number of policy errors encountered.Count
Metric nameMetric keyDescriptionUnit
Apigee Total Response Timeapigee.total_response_timeThe amount of time in milliseconds, from when Edge receives a request from a client to when Edge sends the response back to the client.MilliSecond
Metric nameMetric keyDescriptionUnit
Apigee Target Response Timeapigee.target_response_timeThe average amount of time in milliseconds, for the target server to respond to a call.MilliSecond
Metric nameMetric keyDescriptionUnit
Apigee Target Errorsapigee.target_errorsThe total number of 5xx responses from the target service. These are target service errors not caused by Apigee.Count
Metric nameMetric keyDescriptionUnit
Apigee Traffic (message count)apigee.trafficThe total number of API calls processed by Edge in the specified time period.Count
Metric nameMetric keyDescriptionUnit
Apigee Response Sizeapigee.response_sizeThe average size of the response payload returned to the client, in bytes.Byte
Metric nameMetric keyDescriptionUnit
Apigee Max Response Sizeapigee.response_size_maxThe maximum size of the response payload returned to the client, in bytes.Byte
Metric nameMetric keyDescriptionUnit
Apigee Max Response Processing Latencyapigee.response_latency_maxThe maximum amount of time in milliseconds, that it takes Edge to process API responsesMilliSecond
Metric nameMetric keyDescriptionUnit
Apigee Cache Hitsapigee.cache_hitsThe number of successful API requests that use the Response Cache instead of the response from the target service.Count
Metric nameMetric keyDescriptionUnit
Apigee Max Target Response Timeapigee.target_response_time_maxThe maximum amount of time in milliseconds, for the target server to respond to a call.MilliSecond
Metric nameMetric keyDescriptionUnit
Apigee Max Total Response Timeapigee.total_response_time_maxThe maximum amount of time in milliseconds, from when Edge receives a request from a client to when Edge sends the response back to the client.MilliSecond
Metric nameMetric keyDescriptionUnit
Apigee L1 Cache Elementsapigee.l1_cache_elementsThe average number of elements in the L1 cache.Count
Metric nameMetric keyDescriptionUnit
Apigee Max Request Sizeapigee.request_size_maxThe maximum size of the request payload received by Edge, in bytes.Byte
Metric nameMetric keyDescriptionUnit
Apigee Proxy Errorsapigee.errorsThe total number of times API proxies failed over the specified time period.Count
Metric nameMetric keyDescriptionUnit
Apigee Cache Executedapigee.ax_cache_executedThe number of times that a cache policy was executed during the processing of API requests.Count
Metric nameMetric keyDescriptionUnit
Apigee API Connectivityapigee.api.connectivityWas Dynatrace able to poll the Apigee API without errors?Percent
Metric nameMetric keyDescriptionUnit
Apigee Average Request Processing Latencyapigee.request_latencyThe average amount of time in milliseconds, that it takes Edge to process incoming requests.MilliSecond
Metric nameMetric keyDescriptionUnit
Apigee Average Transactions per Secondapigee.throughputThe average number of transactions, meaning API proxy requests, per second.Count
Metric nameMetric keyDescriptionUnit
Apigee Response Processing Latencyapigee.response_latencyThe average amount of time in milliseconds, that it takes Edge to process API responsesMilliSecond
Metric nameMetric keyDescriptionUnit
Apigee Max Request Processing Latencyapigee.request_latency_maxThe maximum amount of time in milliseconds, that it takes Edge to process incoming requests.MilliSecond
Metric nameMetric keyDescriptionUnit
Apigee Request Sizeapigee.request_sizeThe average size of the request payload received by Edge, in bytes.Byte
Metric nameMetric keyDescriptionUnit
Apigee L1 Cache Elements Maxapigee.l1_cache_elements_maxThe maximum number of elements in the L1 cache.Count

Full version history

To have more information on how to install the downloaded package, please follow the instructions on this page.
ReleaseDate

Full version history

  • Improve existing unified analysis screens

Full version history

WARNING: Possible breaking changes and warnings - PLEASE READ before upgrading:

  • This version requires a minimum Dynatrace version of 1.338.0 and a minimum EEC version of 1.333.0.
  • This version includes a breaking change for Dynatrace on Grail.
    • With the inclusion of OpenPipeline processing rules, any metrics ingested from the extension will be processed by a dedicated OpenPipeline pipeline instead of the classic pipeline.
    • This means that classic rules will no longer be used on metrics ingested from the extension. Please be sure to migrate any you still need to OpenPipeline rules.
    • Additionally, some field names are handled differently in OpenPipeline, e.g. capitalization. Please double-check any custom dashboards and alerts you have created for this extension.
    • You must opt-in to OpenPipeline configuration via Settings API – see the documentation.

New in this version:

  • Smartscape on Grail.
  • Refactored feature sets according to the best practices established here.
  • Added feature set metadata for recommended metrics.

Full version history

  • Proxy credentials are now optional and can be excluded

Full version history

  • Add extra metrics and support feature sets
  • Add support for custom google locations: https://docs.cloud.google.com/apigee/docs/locations#available-apigee-api-control-plane-hosting-jurisdictions
  • Add support for Oauth2 client_credentials grant type
  • Improve settings layout and documentation

Full version history

✨ New in this version:

  • Added Davis anomaly detector templates to extension package

Full version history

⚠️ NOTICE: This version requires a minimum Dynatrace and EEC version of 1.313

🚀 Improved in this version:

  • Add Dynatrace Error Codes to reported errors

Full version history

  • Adds the option to specify custom Client ID and Client Secret values for Oauth authentication.

Full version history

  • Generate new platform dashboard and screen updates
  • Add support for dt.security_context

Full version history

  • Add new platform dashboard

Full version history

  • Adds an option to ignore an empty metrics response from Apigee instead of raising it as an error.
  • The list of extra dimensions to collect can now be empty

Full version history

Include chardet as an install dependency. Without this requests uses charset-normalizer which requires an executable .so file, which is often blocked on noexec filesystems.

Full version history

  • Fixes a bug where requests were still being validated even if 'Verify' was set to false in the configuration.
  • Requires both Verify and Use Custom Certificates to be enabled before using custom certificate bundles to validate Apigee host SSL

Full version history

Note: This update requires Monitoring Configurations to be recreated. You cannot automatically update a configuration from 2.x.x to 3.0.0 due to the various configuration and UI changes.


  • Improve extension configuration settings
    • Drop SAML auth from the supported options
    • Google authentication properties can now be added to the extension configuration
    • Credential vault support for username/password fields
    • Improved documentation
  • Always Include the Proxy (apiproxy) dimension.
  • Reduce custom dimension selection to 4 (apiproxy is always the 5th)
  • Improved error reporting.
  • Collect an Apigee API connection metric
    • Custom alert for when the apigee API connection fails
  • SSL verification settings now used in Google oauth2 requests

Full version history

  • Add option to mask 'Client IP' addresses.
  • Add organization and environment dimensions
  • Add a warning about high metric cardinality and sensitive data in the dimension selection field

Full version history

  • Add entity type to metrics for tags and management zone rules
  • Proxy icon for created Entities
  • Update dependency package versions

Full version history

  • Advanced configuration option - custom request timeout

Full version history

  • Support for all Apigee Analytics Dimensions
Dynatrace Hub
Hub HomeGet data into DynatraceBuild your own app
Dynatrace Intelligence - Agentic Operations SystemThe Dynatrace Agentic AI ecosystem
Log Management and AnalyticsKubernetesAI and LLM ObservabilityInfrastructure ObservabilitySoftware DeliveryApplication ObservabilityApplication SecurityBusiness ObservabilityDigital Experience
Filter
Type
Built and maintained by
Deployment model
SaaS
  • SaaS
  • Managed
Partner FinderBecome a partnerDynatrace Developer

All

221 Results filtered by:

Akamai logo

Akamai

Ingest logs and security events from Akamai products.

Extension
Alibaba Cloud logo

Alibaba Cloud

Automatically discover, baseline, and monitor Alicloud environment components.

Extension
Anypoint MQ logo

Anypoint MQ

Gather metrics about your Anypoint MQ Queues.

Extension
Apache ActiveMQ Classic logo

Apache ActiveMQ Classic

Automatic and smart observability for ActiveMQ with trace and metric insights.

Extension
Apache Cassandra logo

Apache Cassandra

Improve Apache Cassandra observability.

Extension
Apache CouchDB logo

Apache CouchDB

Intelligently observe and optimize health and performance of your database.

Extension
Apache Kafka logo

Apache Kafka

Automatic and intelligent observability with trace and metric insights.

Extension
Apache Solr logo

Apache Solr

Open-source enterprise-search platform, written in Java.

Extension
Apache Spark logo

Apache Spark

Enhanced insights for Spark Components.

Extension
Apache Zookeeper logo

Apache Zookeeper

Monitor and analyze your Apache Zookeeper with this JMX-based extension.

Extension
Apigee logo

Apigee

Remotely monitor your Apigee proxies.

Extension
AWS Cloud Monitoring logo

AWS Cloud Monitoring

New and enhanced monitoring capabilities for your AWS cloud platforms.

Extension
AWS Entities for Metric Streaming logo

AWS Entities for Metric Streaming

Analyse metrics in the context of an entity based on AWS Metric Streaming.

Extension
Azure Cloud Monitoring logo

Azure Cloud Monitoring

New and enhanced monitoring capabilities for your Azure cloud platforms.

Extensioncoming soon
Azure Managed Apache Cassandra logo

Azure Managed Apache Cassandra

Gain insights into your Azure Managed Cassandra Instance health and performance.

Extension
Black Duck logo

Black Duck

Ingest Black Duck security events and audit logs.

Extension
Ceph storage logo

Ceph storage

Monitor usage of Ceph storage system at both client side and host level.

Extension
Checkmarx logo

Checkmarx

Ingest Checkmarx security events and audit logs.

Extension
Check Point Firewall logo

Check Point Firewall

Gain insights into the performance of your Check Point Firewall devices.

Extension
Cisco ACI/APIC logo

Cisco ACI/APIC

Get insights into your Cisco Application Centric Infrastructure (ACI).

Extension
Cisco Catalyst Center (DNA Center) logo

Cisco Catalyst Center (DNA Center)

Get insights into the Cisco Catalyst Center infrastructure (f.k.a. DNA Center).

Extension
Cisco Catalyst SD-WAN Manager (Viptela) logo

Cisco Catalyst SD-WAN Manager (Viptela)

Get insights into the Cisco SD-WAN performance through the vManage API.

Extension
Cisco Firepower logo

Cisco Firepower

Monitor Cisco Firepower devices using SNMP.

Extension
Cisco UCS C-Series logo

Cisco UCS C-Series

Get insights into your Cisco UCS C-Series devices.

Extension
Cisco UCS M-Series logo

Cisco UCS M-Series

Get insights into your Cisco UCS M-Series devices.

Extension
Citrix DaaS & Virtual Apps and Desktops logo

Citrix DaaS & Virtual Apps and Desktops

Gain insight into your Citrix DaaS & Virtual Apps and Desktops environments.

Extension
Citrix Netscaler ADC logo

Citrix Netscaler ADC

Remotely monitor your Citrix NetScaler devices.

Extension
Citrix NetScaler SDX logo

Citrix NetScaler SDX

Remotely monitor your Citrix NetScaler SDX devices.

Extension
Cloudflare (extension) logo

Cloudflare (extension)

Collect notification history and various metrics from your Cloudflare accounts.

Extension
Cloud Foundry logo

Cloud Foundry

Monitor your Cloud Foundry resource definitions by connecting to the foundation.

Extension
Confluent Cloud (Kafka) logo

Confluent Cloud (Kafka)

Remotely monitor your Confluent Cloud Kafka Clusters and other resources!.

Extension
Connection Pools: Apache Commons logo

Connection Pools: Apache Commons

Application method of pooling and sharing multiple connections to a database.

Extension
Connection Pools: C3P0 logo

Connection Pools: C3P0

Application server method of pooling and sharing connections to a database.

Extension
Connection Pools: JBoss logo

Connection Pools: JBoss

Application server method of pooling and sharing connections to a database.

Extension
Connection Pools: WebLogic logo

Connection Pools: WebLogic

Application server method of pooling and sharing connections to a database.

Extension
Connection Pools: WebSphere Liberty logo

Connection Pools: WebSphere Liberty

Application server method of pooling and sharing connections to a database.

Extension
Consul Service Mesh (StatsD) logo

Consul Service Mesh (StatsD)

Extend visibility into your Consul Service Mesh instances to monitor health and improve performance.

Extension
Control-M Jobs v2 logo

Control-M Jobs v2

Monitor your Control-M jobs execution status.

Extension
CoreDNS (2.0) logo

CoreDNS (2.0)

Collect important data from your CoreDNS processes.

Extension
Couchbase logo

Couchbase

Couchbase Capella (SaaS) database monitoring.

Extension
CPU Core Monitoring logo

CPU Core Monitoring

Get insights into CPU Core utilization on your OneAgent hosts.

Extension
CrowdStrike logo

CrowdStrike

Ingest CrowdStrike detection findings.

Extension
CyberArk logo

CyberArk

Ingest CyberArk audit logs via SIEM integration for reporting and analysis.

Extension
Databricks logo

Databricks

Monitor your Databricks Clusters via its multiple APIs!.

Extension
Databricks Workspace logo

Databricks Workspace

Remotely monitor your Databricks Workspaces!.

Extension
definity logo

definity

Monitor and optimize your Lakehouse, Spark, and Databricks pipelines.

Extension
Defunct Process Monitoring logo

Defunct Process Monitoring

Monitoring defunct processes stuck on your linux servers.

Extension
Dell EMC Isilon - PowerScale logo

Dell EMC Isilon - PowerScale

Monitor your Dell EMC Isilon / Powerscale clusters through the OneFS API.

Extension
Dell EMC PowerMax logo

Dell EMC PowerMax

Monitor PowerMax Arrays for performance and health, with Dell Unisphere API.

Extension
Dell iDRAC logo

Dell iDRAC

Connect to the Redfish API to get insights into your Dell iDRAC environment.

Extension