

Digital Experience
Deliver flawless digital experiences and drive business results with AI-driven, automated, frontend-to-backend digital experience monitoring.
Digital experience monitoring with Dynatrace
-
Real User Monitoring
Gain full visibility into all activity from every mobile and web user, seamlessly connected to the backend.
-
Synthetic Monitoring
Proactively simulate user behavior to gain insight into digital experiences, performance and availability
-
Session Replay
See exactly what your users see with video-like recordings of every user session.
-
Mobile App Monitoring
Get AI-powered crash analytics and end-to-end visibility into native mobile applications.

Insightful and actionable answers across teams within one platform
Empower development, operations, and business teams with a unified platform to deliver a positive digital experience for every user.
Deliver flawless digital experiences without complex or manual setup
Dynatrace automatically instruments your applications and establishes multidimensional baselines that account for real users' location, device, and browser so anomalies surface without manual threshold-tuning. From Core Web Vitals to global availability, you get a continuous, precise picture of how performance impacts your users.

Identify and remediate errors with complete context
When something breaks, Dynatrace traces the impact from the frontend all the way through the backend — no tab-switching, no guesswork. AI-driven root cause analysis surfaces causal relationships automatically, so your team spends time fixing the problem, not finding it.

Discover, analyze, and improve journeys across channels
Dynatrace automatically tracks conversion metrics and key user actions so you can see exactly where users drop off and why. Connect application performance directly to adoption, retention, and business outcomes without needing a separate analytics tool.
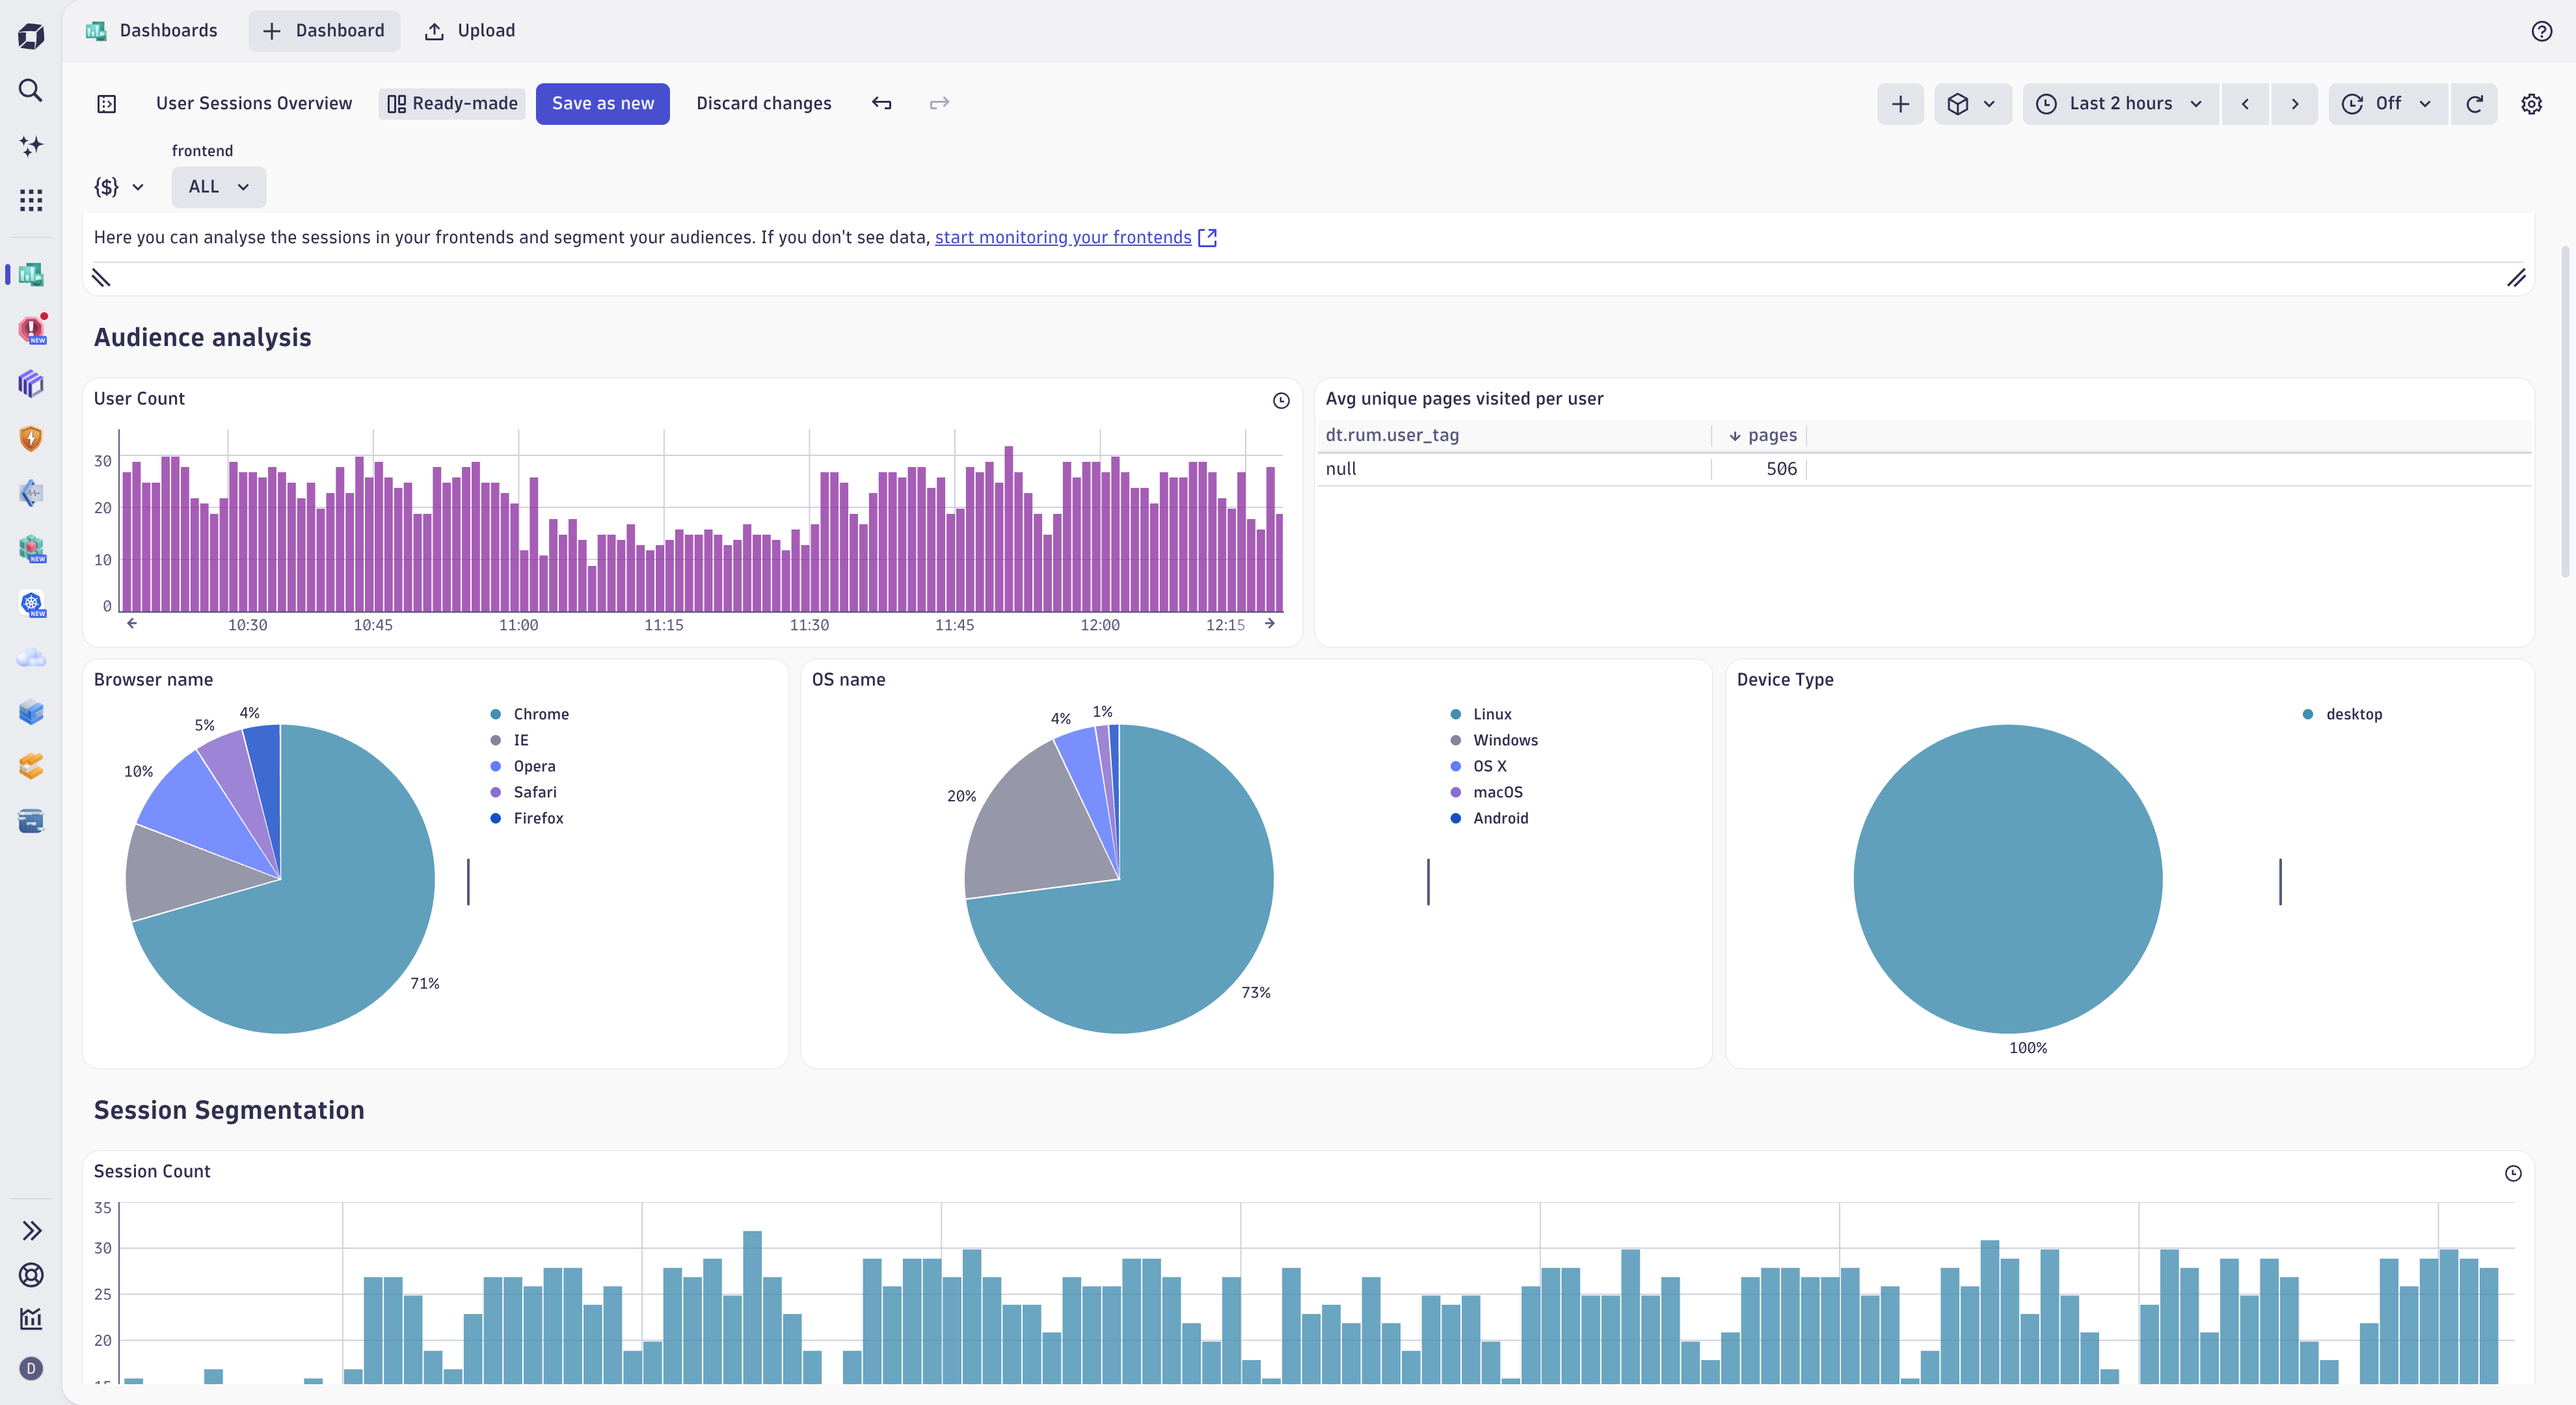


Extend your team’s value with expertise-based data analysis and recommendations
The Business Insights team leverages deep Dynatrace expertise to go beyond application performance and unlock more value to drive business decisions.


Get a free trial

Digital experience FAQs
Digital experience monitoring (DEM) is the practice of continuously measuring and analyzing how real users interact with web and mobile applications — covering performance, availability, errors, and behavior from the user's device all the way back to the underlying infrastructure. When performance degrades or a journey breaks, the impact lands directly on revenue and customer retention. Dynatrace Digital Experience brings together Real User Monitoring, Synthetic Monitoring, Session Replay, and Mobile App Monitoring into a single AI-powered platform so teams can detect, diagnose, and resolve issues before they compound.
Real User Monitoring (RUM) captures data from actual user sessions as they happen — every click, page load, and error across every device, browser, and location. Synthetic Monitoring, by contrast, uses scripted bots to simulate user journeys on a scheduled basis from both public and private locations, enabling teams to detect problems proactively even during off-peak hours when real traffic is low. The two approaches are complementary: RUM reveals what real users experience, while Synthetic Monitoring validates performance baselines, ensures SLA compliance, and catches regressions immediately after a deployment.
Session Replay captures video-like recordings of individual user sessions, letting support and engineering teams watch exactly what a customer encountered — what they clicked, where they hesitated, and where they ran into errors. This capability is particularly valuable for resolving customer complaints without lengthy back-and-forth, because teams can reproduce the issue in context rather than relying on a user's description. Dynatrace Session Replay is built with end-user privacy as a design requirement: sensitive data fields are masked by default, giving teams full diagnostic visibility without exposing personally identifiable information.
Dynatrace Mobile App Monitoring provides end-to-end visibility into native iOS and Android applications, including AI-powered crash analytics that automatically identifies root causes rather than surfacing raw stack traces for manual investigation. Teams gain insight into session behavior, network requests, and backend call performance — the same frontend-to-backend context available for web applications — so mobile engineers can triage issues with the same precision as their web counterparts. Automated instrumentation means teams do not need to manually add monitoring code throughout the app.
Core Web Vitals — Google's set of user-centric performance metrics covering loading speed, interactivity, and visual stability — directly influence both search ranking and user satisfaction. Dynatrace Digital Experience automatically collects and surfaces Core Web Vitals data from real user sessions, making it straightforward to identify which pages, user segments, or geographies are underperforming against Google's thresholds. Teams can correlate Core Web Vitals degradations with specific deployments, third-party scripts, or backend latency spikes using Dynatrace's AI-driven root cause analysis, accelerating the path from diagnosis to fix.
Apdex (Application Performance Index) is an open standard for measuring user satisfaction with application response times, expressed as a score between 0 and 1 — where 1.0 means all users were satisfied. Dynatrace automatically calculates Apdex scores for web and mobile applications without requiring manual threshold configuration, and applies multidimensional baselines that account for variables such as user location, device type, and browser. When Apdex scores drop, Dynatrace's AI pinpoints the specific cause — whether a backend service, a third-party resource, or a network segment — so teams can act on data rather than guesswork.
Service-level agreements for digital applications typically define minimum thresholds for availability and response time. Dynatrace Synthetic Monitoring executes availability and performance checks continuously from locations around the world, triggers immediate alerts when thresholds are breached, and provides the root cause context needed to resolve incidents quickly. Automated reporting against SLA targets means teams spend less time compiling evidence and more time resolving the underlying issues.
Dynatrace Digital Experience connects frontend signals — page load times, JavaScript errors, user interactions — directly to backend traces, infrastructure metrics, and logs in a single topology. When a user-facing problem is detected, Dynatrace's AI engine, Davis, performs root cause analysis by mapping causal relationships across the entire stack rather than surfacing a list of symptoms for engineers to sort through manually. This front-to-back context is what enables customers like Photobox to achieve an 80% reduction in mean time to resolution (MTTR) and TD Bank to cut customer irritants by 60%.
Digital performance and customer retention are directly linked: slow pages, broken journeys, and unresolved errors push users toward competitors. Dynatrace Digital Experience provides conversion funnel analysis and customer journey tracking that make it possible to identify exactly where users abandon a flow and why. Vitality, a health and life insurance provider, reduced customer churn by 65% after applying these insights to prioritize experience improvements. By combining behavioral analytics with performance data, digital and CX teams can distinguish between customers who leave because of technical friction and those who leave for other reasons — and focus remediation accordingly.
Dynatrace was named a Leader in the Gartner Magic Quadrant for Digital Experience Monitoring in 2025 — the second consecutive year the company received this recognition. In the 2025 report, Dynatrace was positioned furthest for Completeness of Vision among all vendors evaluated, reflecting the breadth of its AI-driven automation, its unified platform approach, and the depth of coverage across web, mobile, and synthetic monitoring capabilities.