Fullwave multicolor opt3 3x

Jython monitoring and performance management

Quickly find errors in your Jython applications

What is Jython?

Jython is an implementation of the Python programming language designed to run on the Java platform.

Dynatrace monitors and analyzes the activity of your Jython applications, providing visibility from the browser through all the tiers down to the individual database statements.

  • Locate bottlenecks in your Jython code

    Dynatrace enables you to dig into your applications and find hotspots at the code level. Identify slow services by investigating service response times and failure rates per service-method.

  • Understand the root cause of your Jython problems

    Dynatrace directly pinpoints components that are causing problems with big data analytics of billions of dependencies within your application stack.

  • Get the full picture including network health and log file analysis

    Dynatrace provides a clear picture of all inbound and outbound process connections over your network interfaces and automatically discovers all log files.

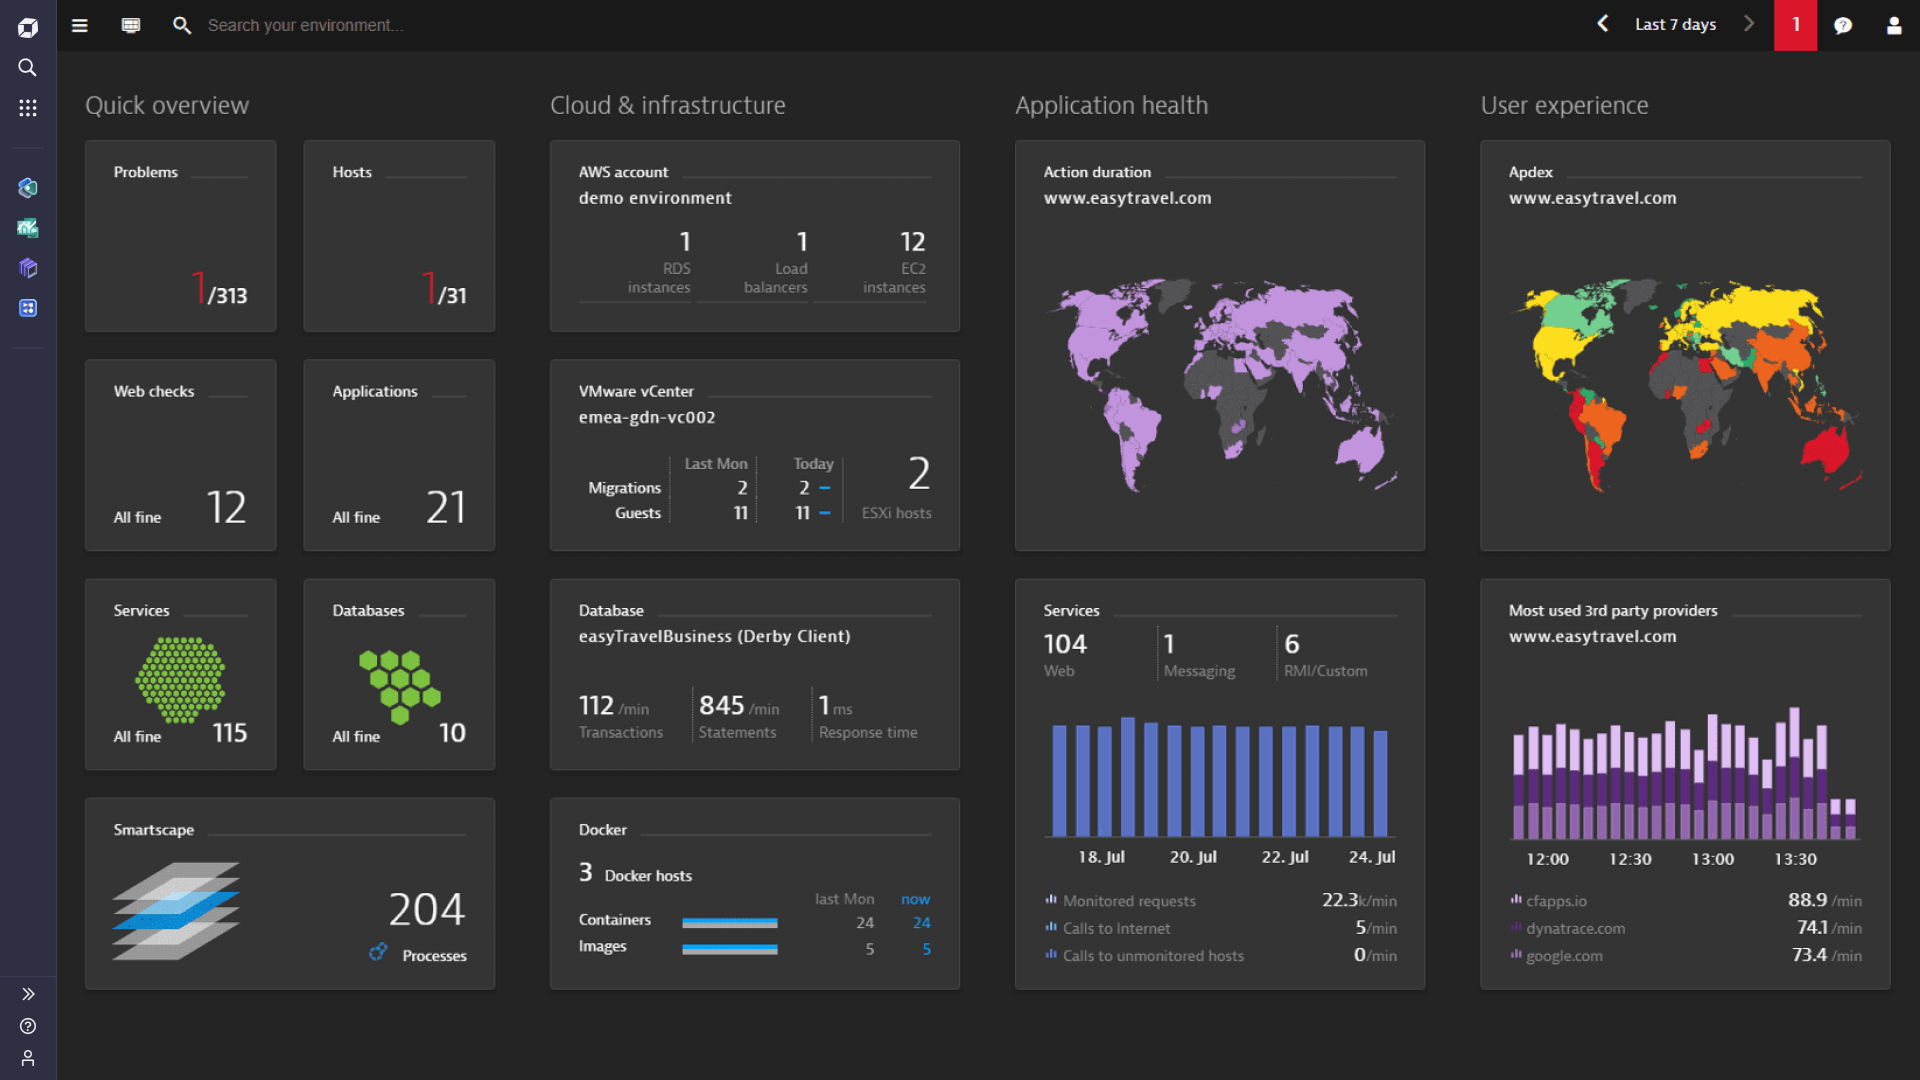
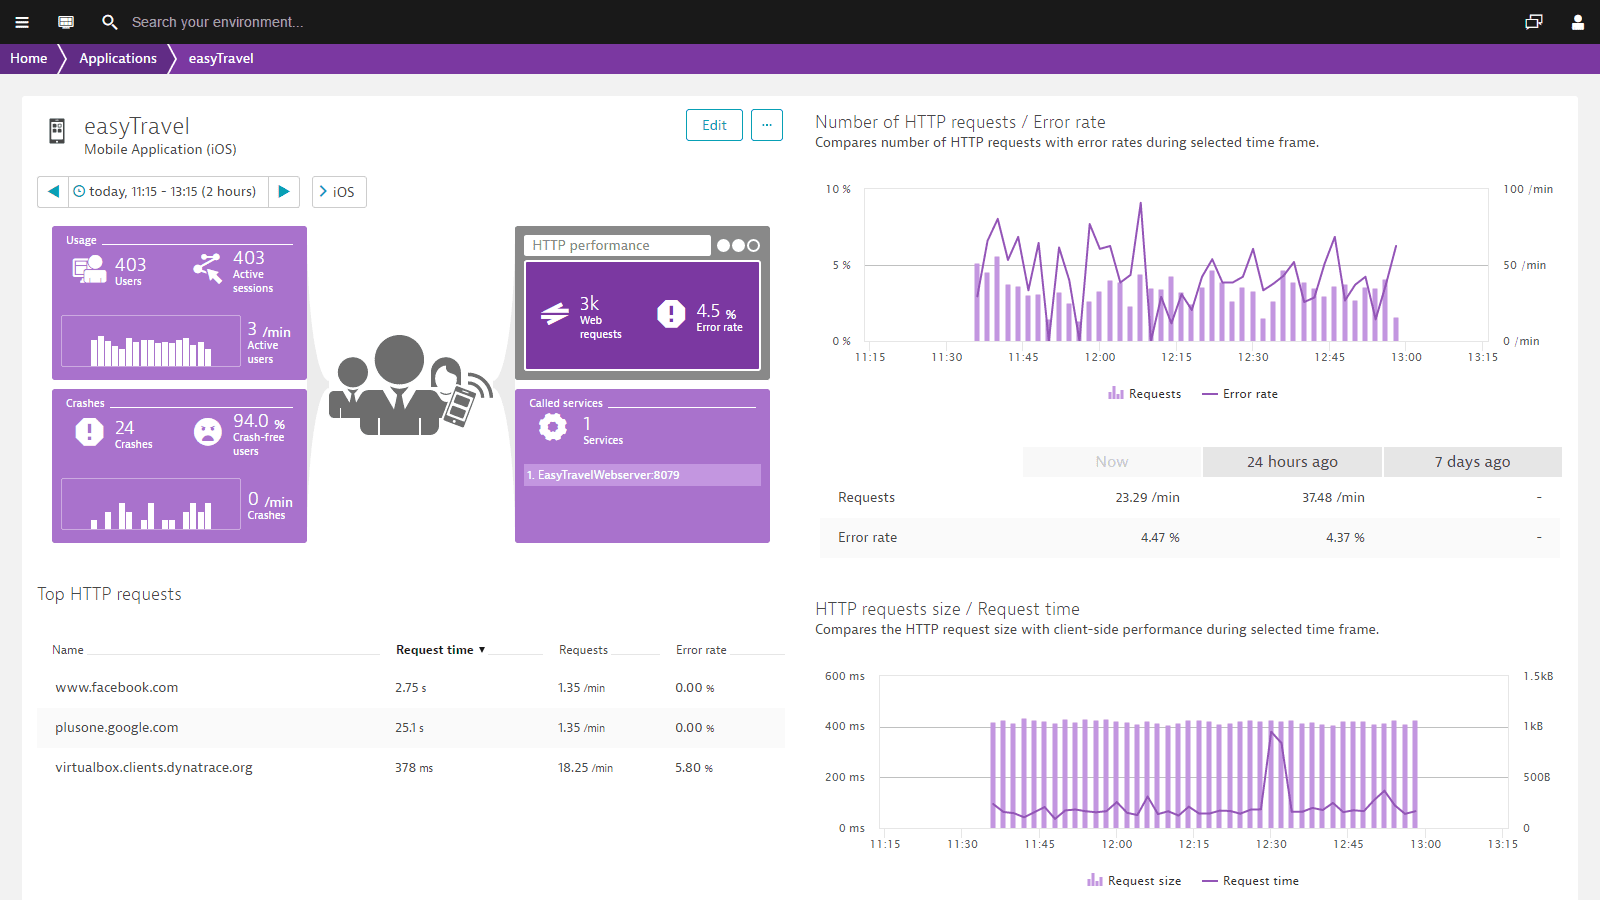
See all Jython performance metrics in real-time

  • Dynatrace captures every transaction, across every tier, without gaps or blind spots.
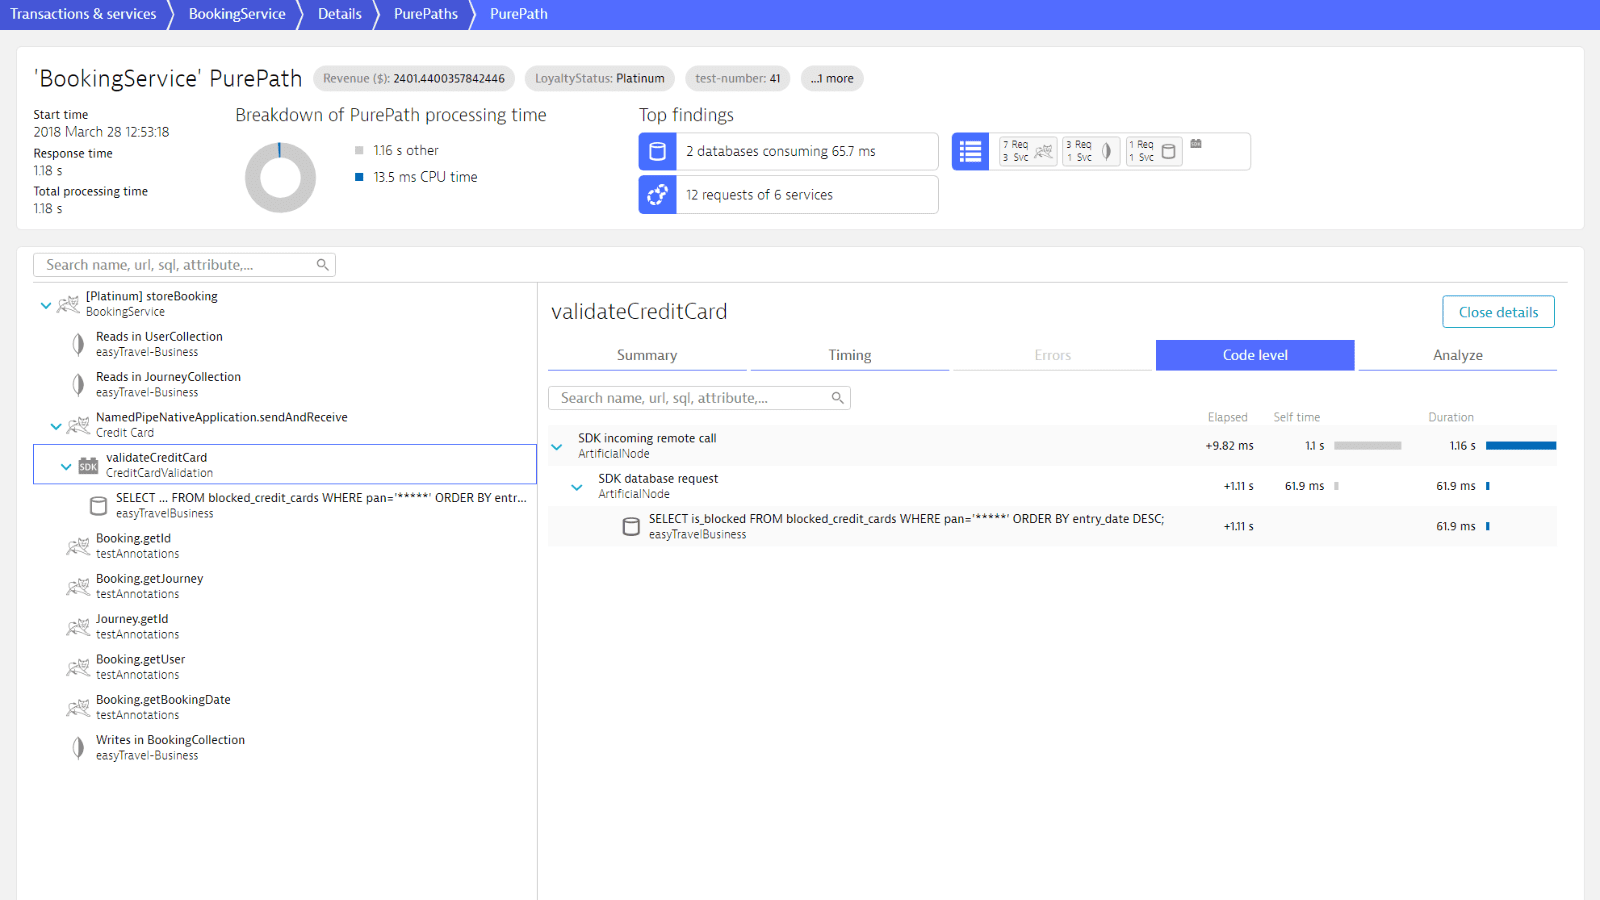
  • Pre-configured dashboards provide all relevant metrics down to SQL statement and code level.
  • In under five minutes the Dynatrace OneAgent automatically discovers your entire Jython application.

Automatically discover and map applications and infrastructure

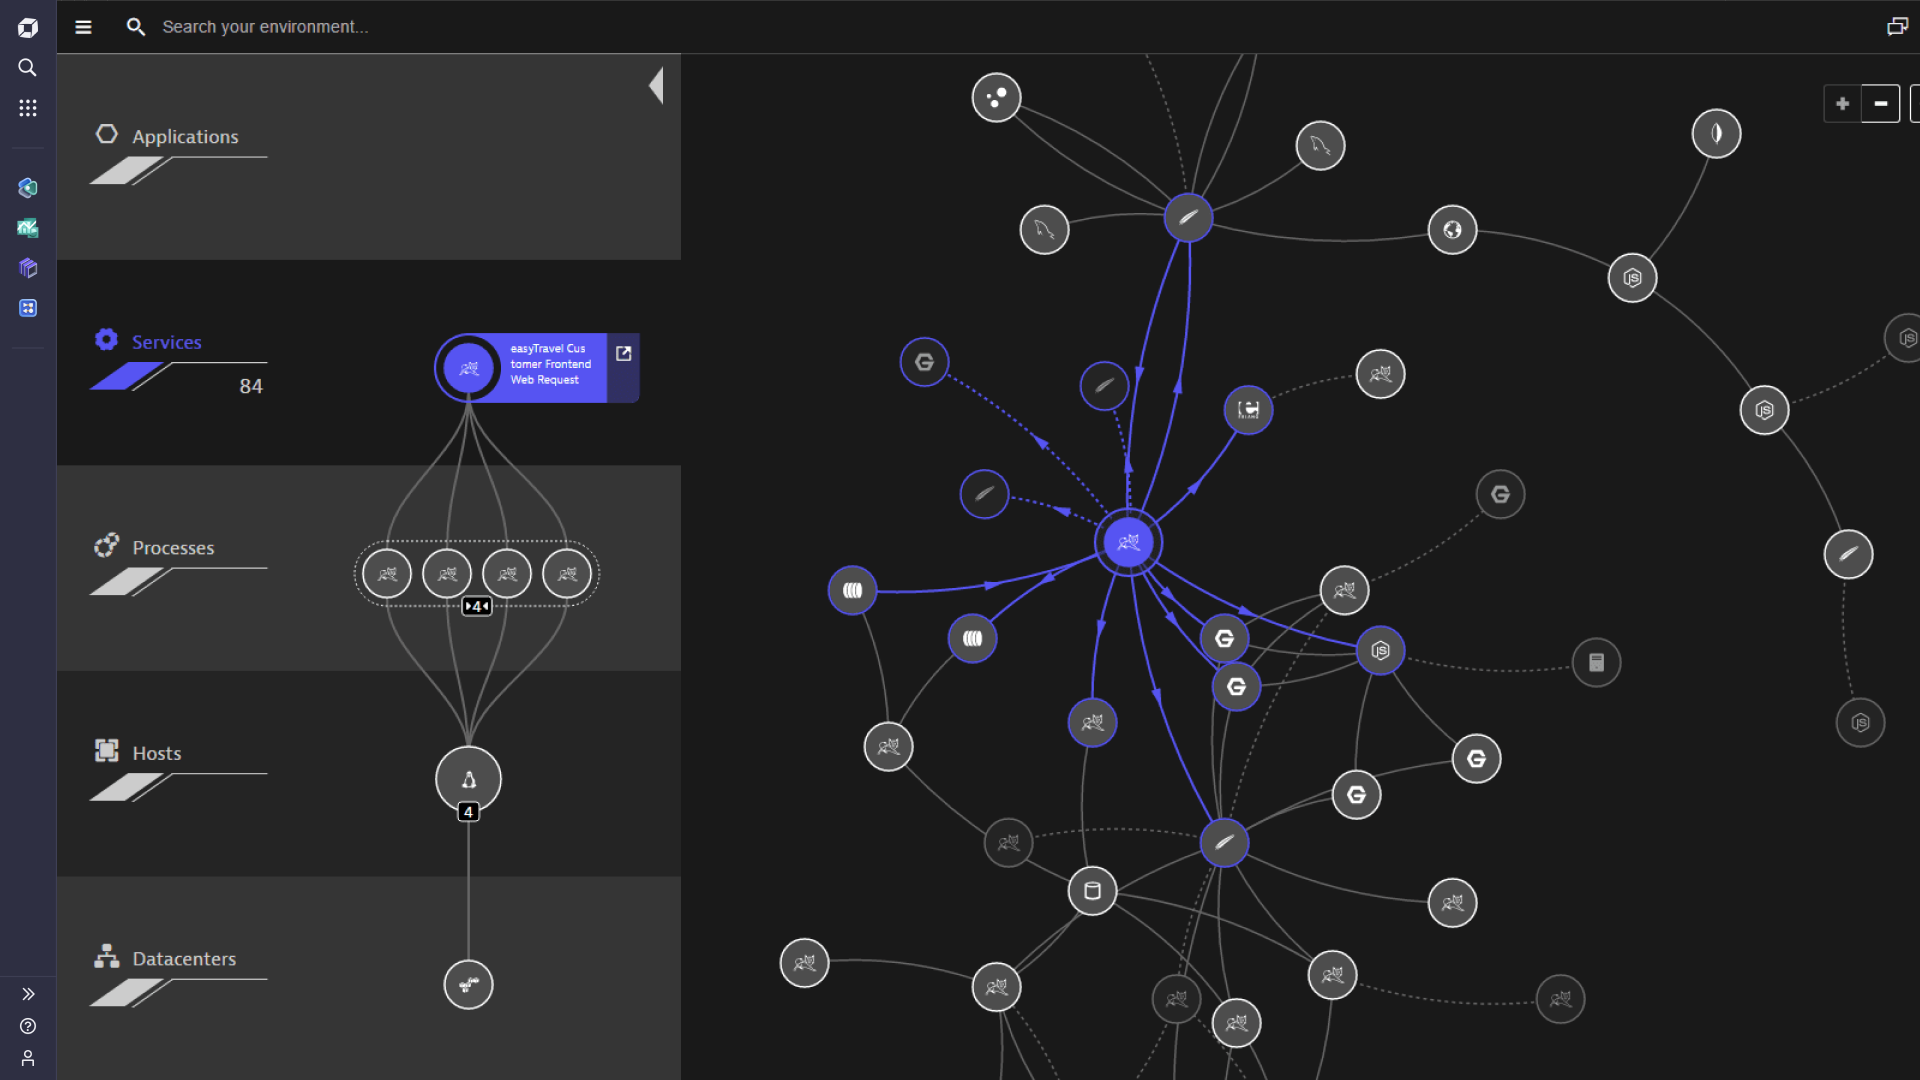
Dynatrace automatically detects and visualizes your Jython applications and its dependencies end-to-end: from website to application to container, infrastructure and cloud.

  • Dynatrace Smartscape provides an interactive map of your application across all layers.
  • See how all components relate to and communicate with one another.
  • Our unique solution was designed for cloud environments where instances are rapidly created and deployed, making it a perfect fit for microservices environments.

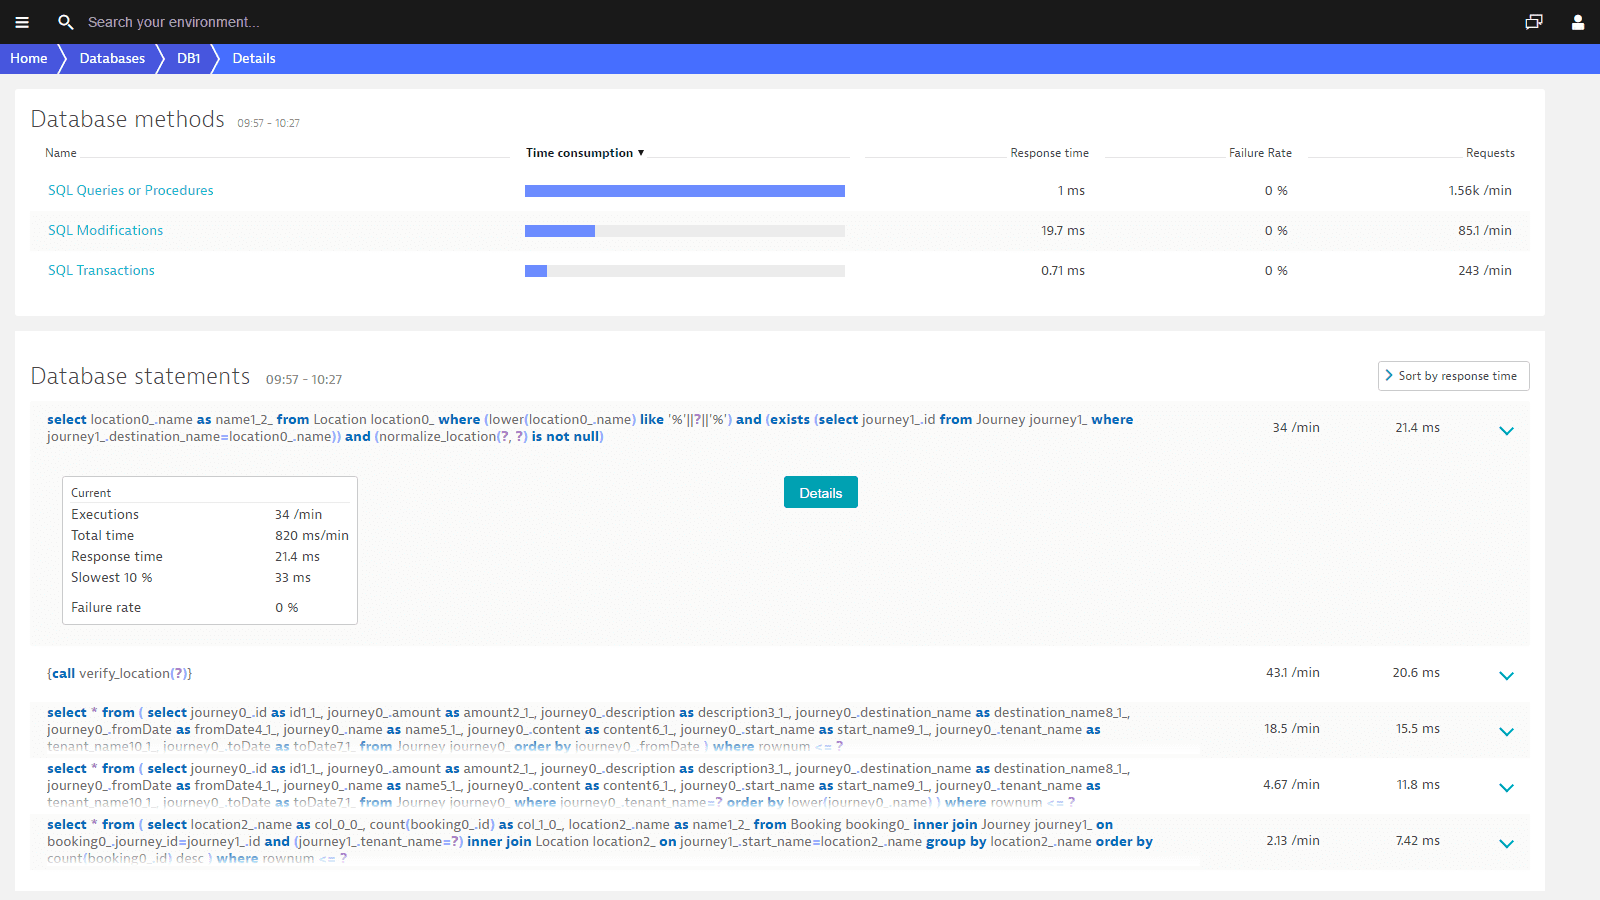
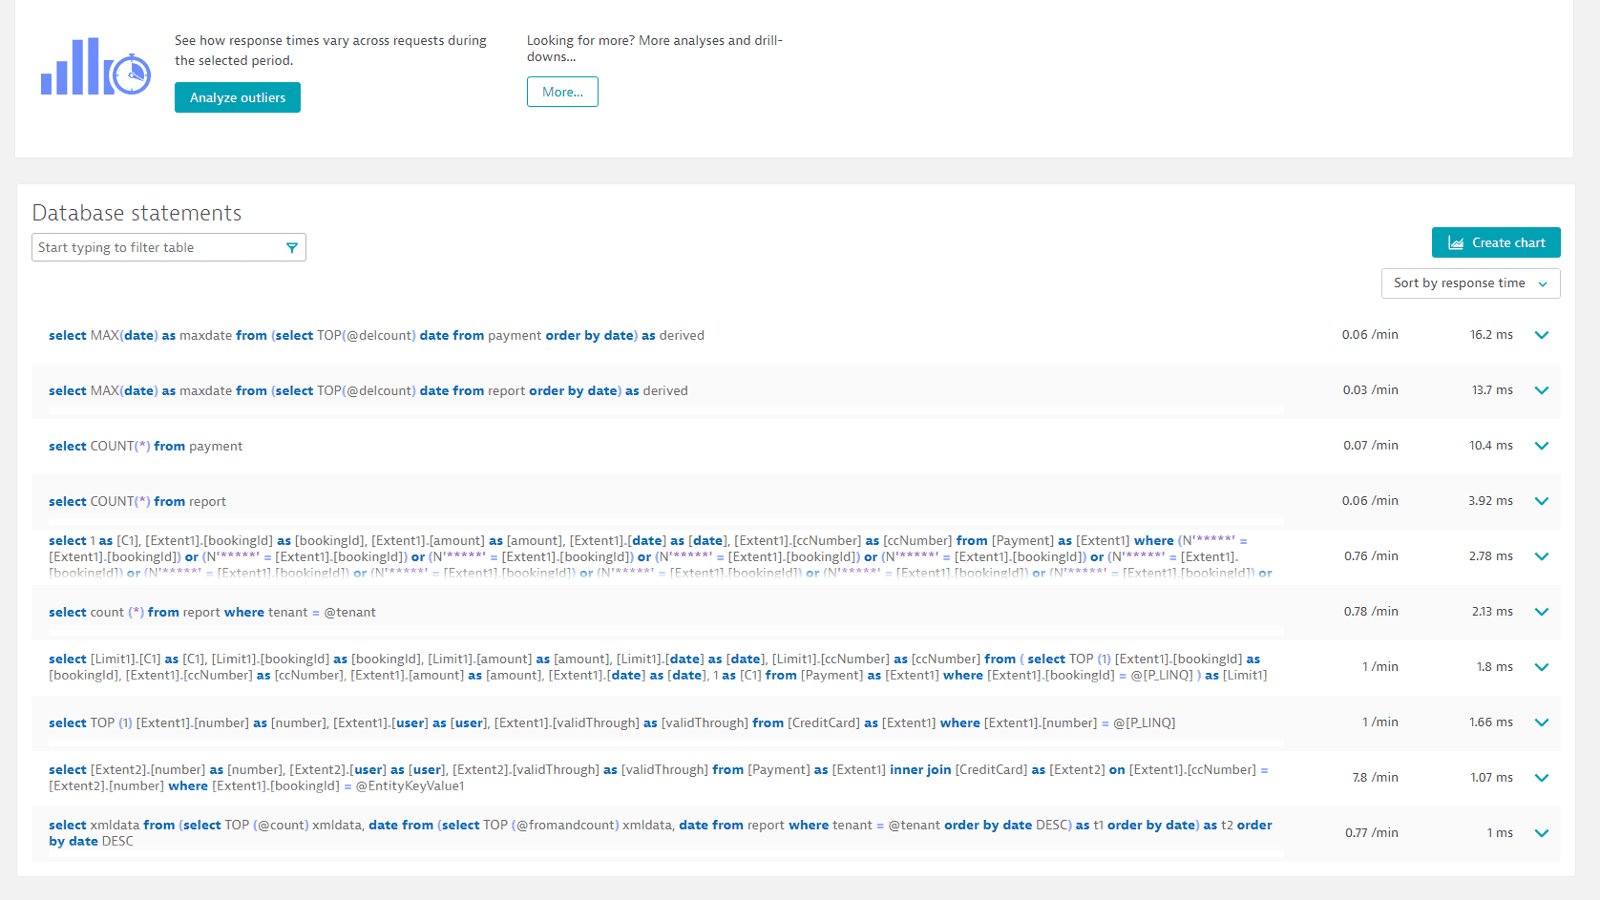
Monitor database query executions

Dynatrace tracks and inspects all SQL statements and NoSQL queries sent by your application. There is no better way to solve a database problem than to have the SQL statements in question directly on screen. See execution frequencies, response times, and long-­running queries to JDBC-­backed databases like MySQL, SQL Server, PostgreSQL and Oracle, as well as NoSQL databases like Cassandra and MongoDB.

Database metrics reveal execution frequencies, response times, and long-running queries.
Get an overview on database response times, failure rates, most time consuming requests, and slowest requests.
Find out which operations are taking the most time and see CPU metric without a local agent installed.
Retrieve the SQL execution plan from any SQL statement ...
... and see execution plan details like estimated rows, cost, and CPU cost.
Full wave bg
With Dynatrace, finding a problem only takes us minutes to identify, saving us precious time and resources.
Eugenia gillan 226 8d09a958f4 Eugenia Gillan VP Engineering at ZoomInfo

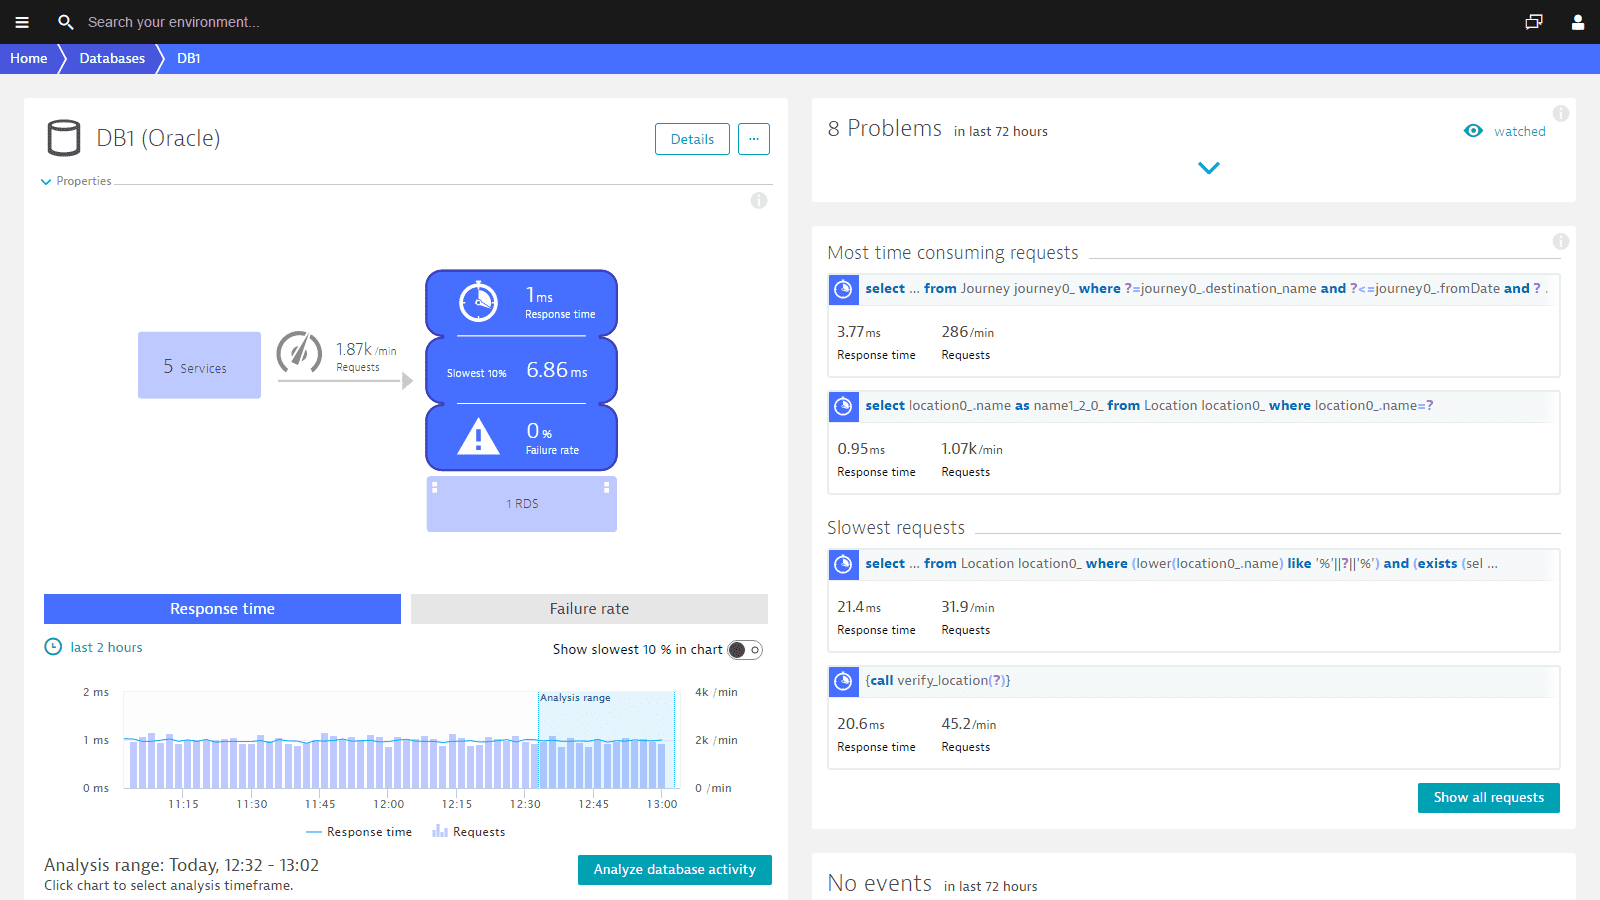
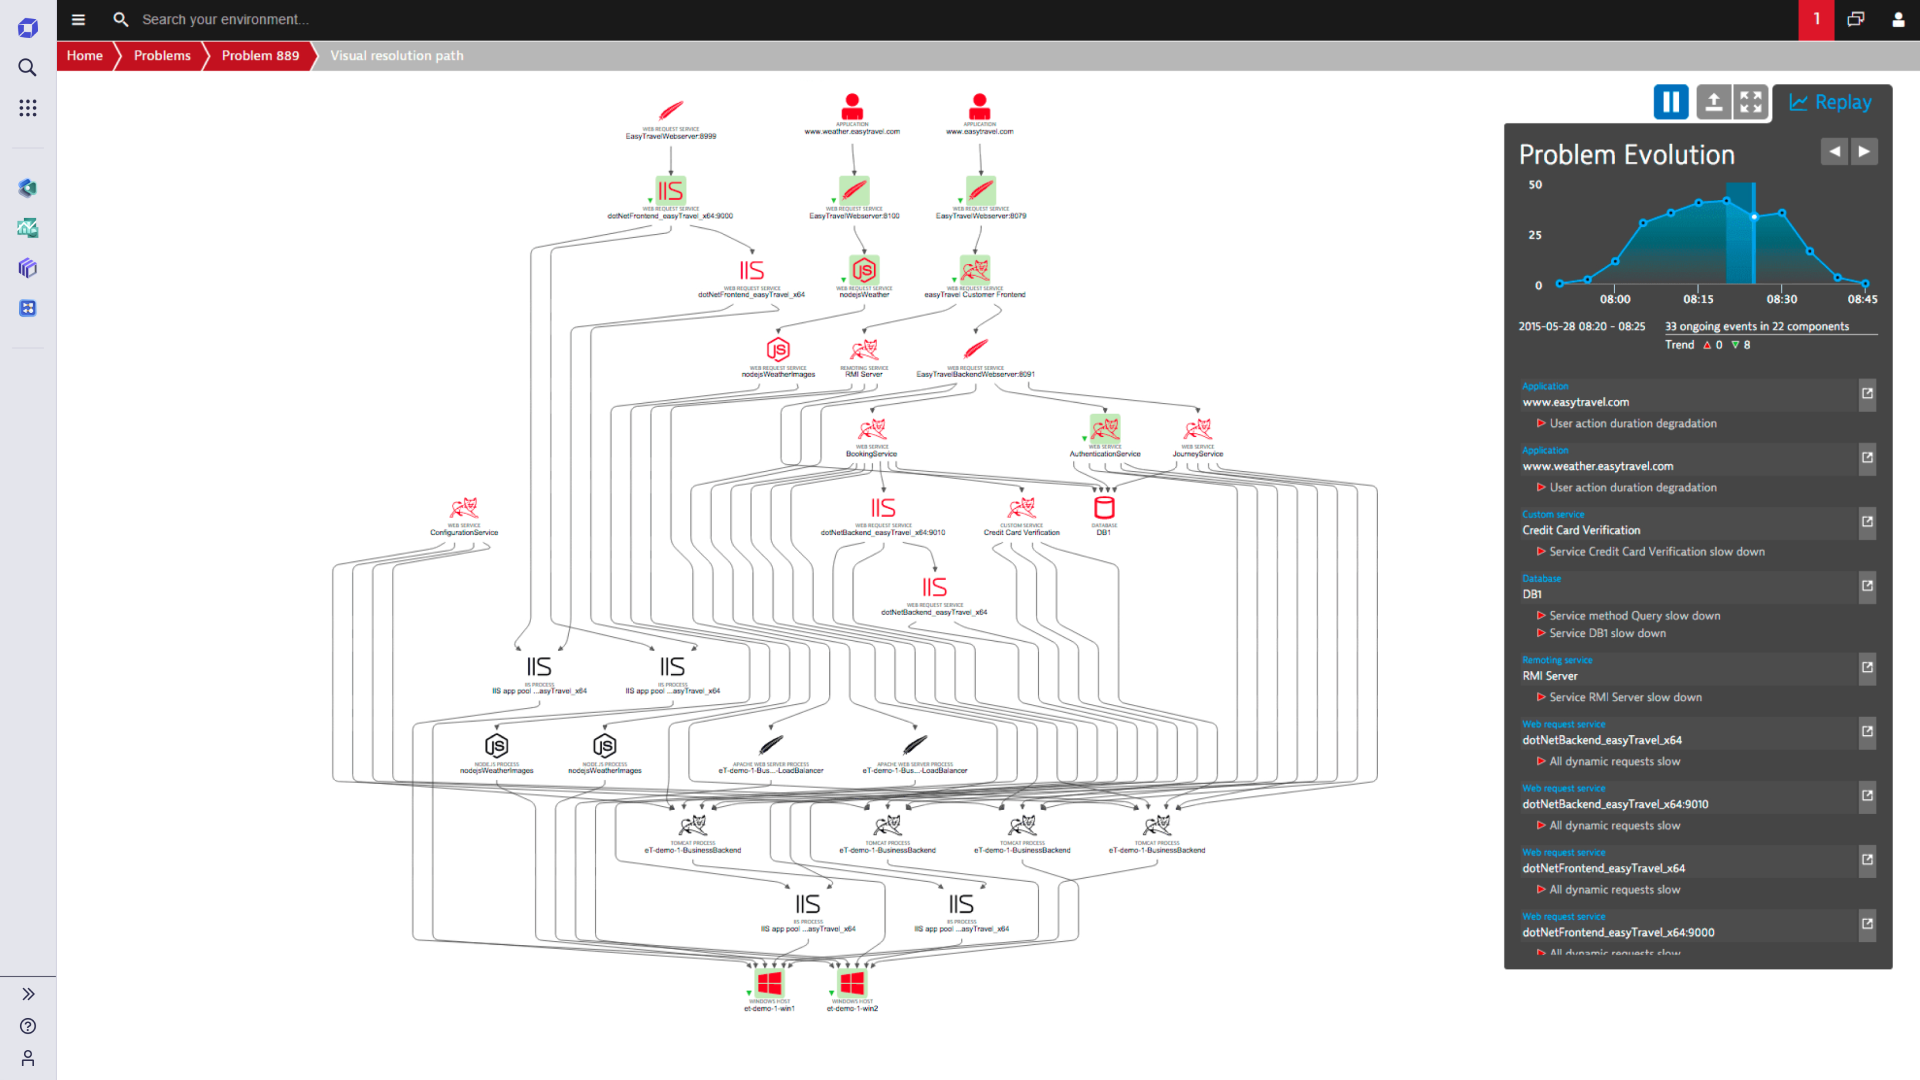
Dynatrace tells you the root cause of your Jython problems!

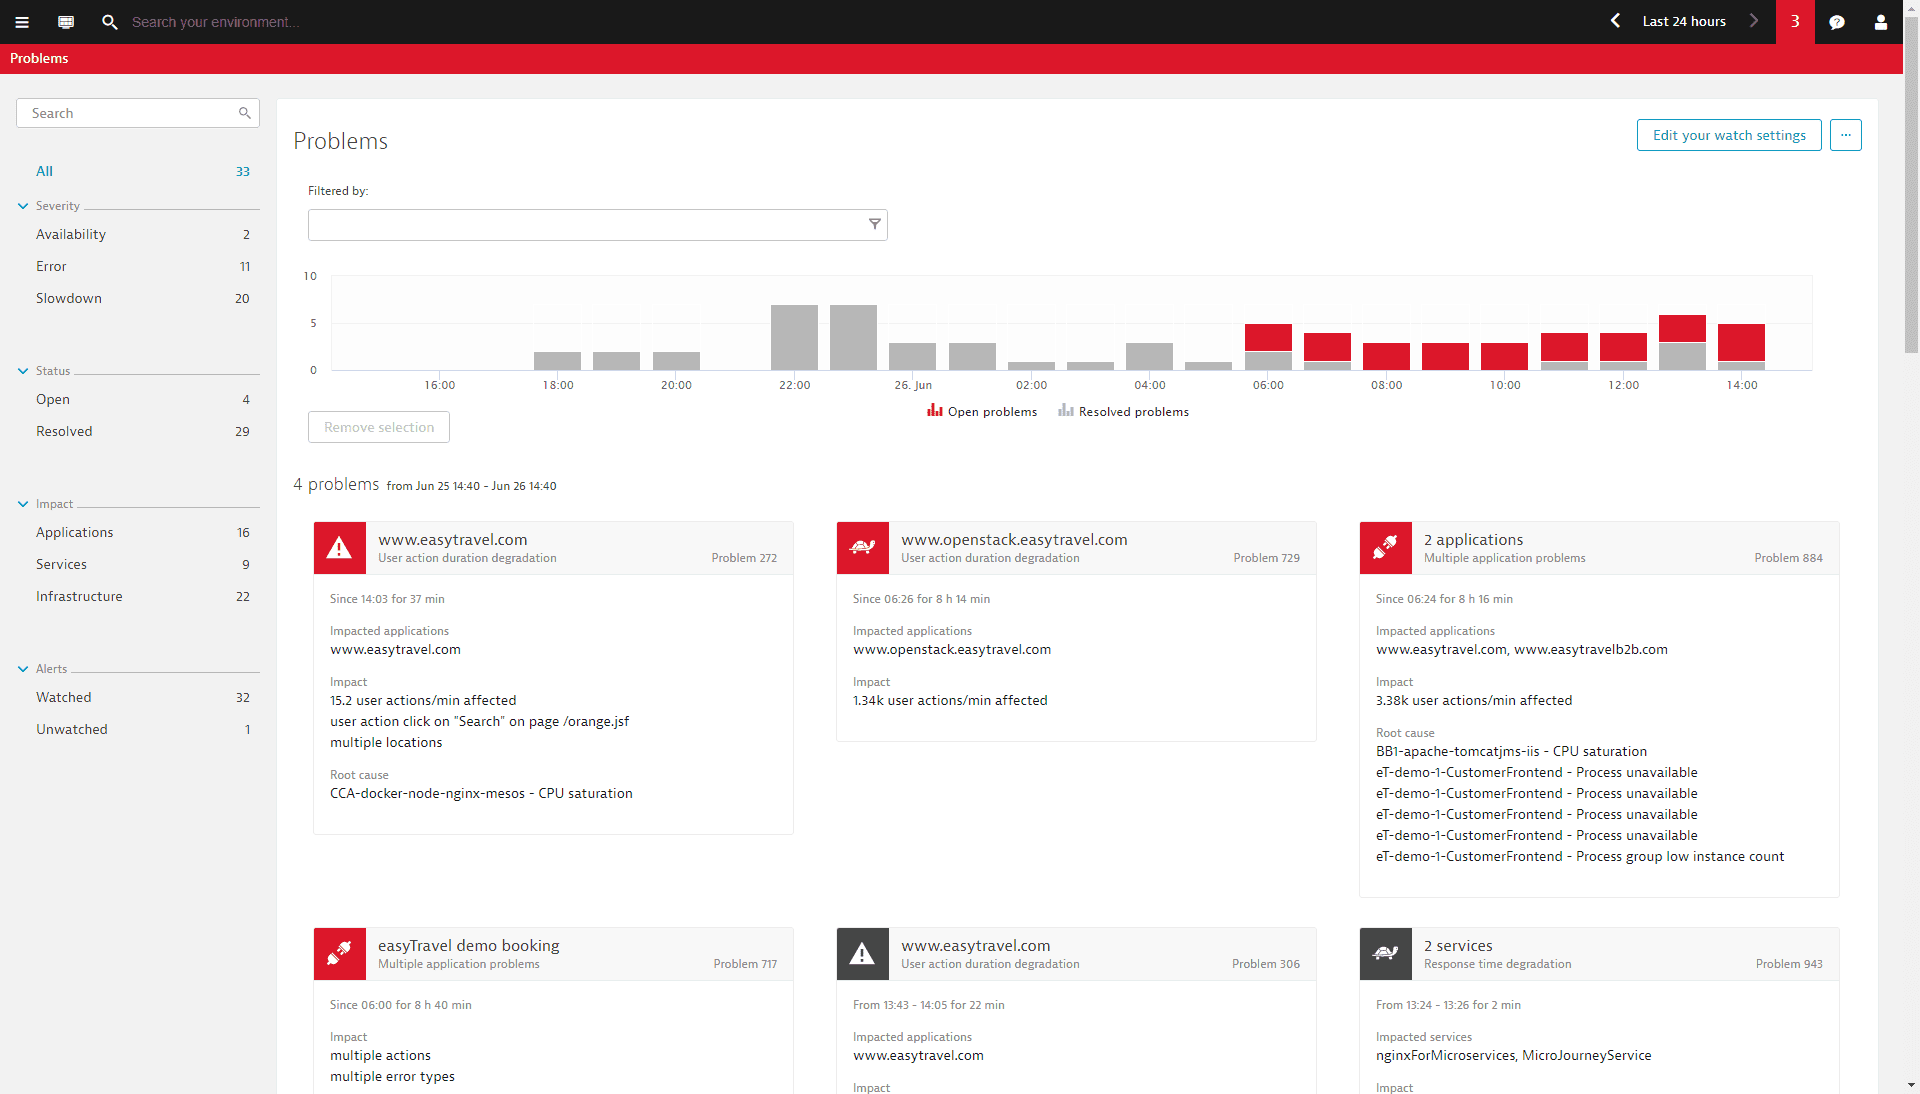
Dynatrace detects and diagnoses problems in real time, pinpointing the root cause down to the offending code before your customers are even affected.

  • Detect availability and performance problems across your stack proactively.
  • Dynatrace directly pinpoints components that are causing problems with big data analytics of billions of dependencies within your application stack.
  • A visual replay of problem evolution helps you understand how problems evolved over time.
Automatic root-cause analysis is a unique capability of Dynatrace changing the life of operations teams.
Dynatrace smart baselining learns what normal looks like for your application. Eliminate false positives and constant noise regarding response times, failure rates and throughput.
Dynatrace diagnoses problems that are often difficult to pinpoint, including database, memory, threading and CPU issues.
Correlate host-process log data with problems.

Start monitoring your Jython app with Dynatrace!

You’ll be up and running in under 5 minutes:
Sign up, deploy our agent and get unmatched insights out-of-the-box.
Full wave bg

Organizations transforming with Dynatrace

See customer stories