
Collecting Performance Data
Chapter: Application Performance Concepts

The first step in performance management is to collect proper measurements. As there is a variety of different measurement approaches we will look at the most widely used ones to understand when to use them and how they are interpreted.
JMX
Java Management Extension (JMX) is a standard technology that has been part of the JVM since Java 5. It makes it possible to manage and monitor Java applications and system resources. Resources are represented as so-called MBeans (Managed Beans).
The JMX architecture consists of three layers.
- The instrumentation level consists of the actual MBeans. This is the only layer you normally get in touch with.
- The agent level or MBean server, which represents the interac-tion between the MBeans and the application.
- The distributed service level, which enables access to the MBeans via connectors and adapters.
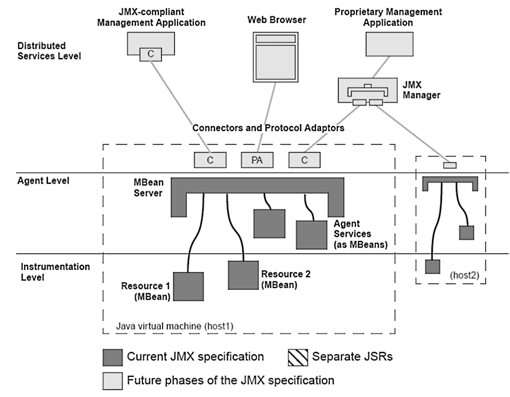
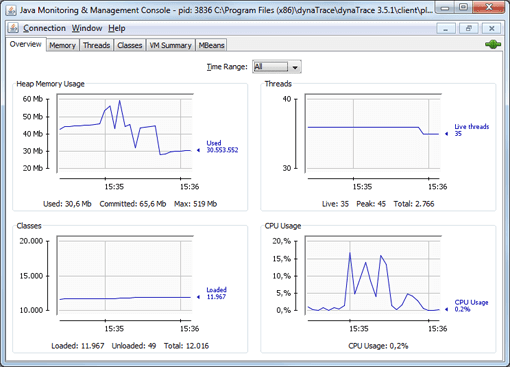
JMX management tools provide access to the MBeans—meaning the actual monitoring data—of a local or remote JVM. JConsole and VisualVM, parts of the JDK, provide a simple way to query a process's performance values, which are accessible via the MBeans.
Using JVMPI/JVMTI to Collect Performance Data
The Java Virtual Machine Tooling Interface (JVMTI) was introduced with Java 5 and replaces Java Virtual Machine Profiler Interface(JVMPI), which was available in previous JVM versions. . JVMTI is a native interface and allows C/C++ agents to access the internal JVM state, register for events, and modify bytecode. Tool providers use this interface for debugging, profiling and monitoring as it provides universal access to JVM internals. As the interface executes native code, the overhead for retrieving performance data can be kept very low depending on how data is retrieved.
When the JVM is started, the native JVMTI agent which is specified via a JVM command line option, is loaded into the Java process. The agent then registers for all events it is interested and then receives callbacks while the application is running.
There is also the option of implementing agents in Java. These can be used easily across platforms. Java agents however lack some of the features only available to the native interface. The most important function used by performance tools—bytecode instrumentation—is possible using both native and Java agents.
Bytecode Instrumentation
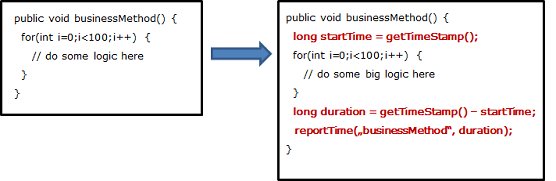
Bytecode instrumentation refers to changing the Java bytecode of a Java class before or while it is executed by the Java Runtime. This approach is widely used by profiling, diagnostic, and monitoring tools. To measure the execution time for a particular method, the method's bytecode is changed by adding Java code at both the start and the end of the method. The instrumented code is executed along with the method and the execution time recorded.
The bytecode of an application can be changed at different stages of the application lifecycle. Let us look at three approaches:
- We can statically change the bytecode as part of the build process. This is the least flexible approach. It also requires access to the sources which have to be rebuilt. Every change of the instrumentation also requires a redeployment of the application, which is often not easy to do and can be time consuming.
- The second approach is to modify the bytecode when the class is loaded by the JVM: JVMTI makes it possible to modify the bytecode before the class is actually used without having to change the actual class file. This approach is more convenient as there are no required changes to the build process and the required deployment artifacts like jar files. Nearly all modern tools follow this approach.
- The third approach is to dynamically instrument classes which have already been loaded and are currently in use by the JVM. This allows us to change the bytecode at runtime without having to restart the application, which is especially useful when an application must be debugged in production. And since debug-level diagnostic information can be turned on and off at runtime, application restarts become unnecessary.
Measurement from the End-User Perspective
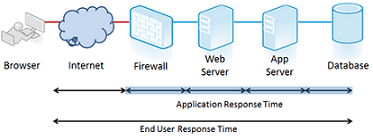
Modern application performance monitoring goes beyond measuring performance solely within the application by including measurements from the user's perspective . If we consider response time, the most important metric for performance from a user's perspective, we see only a fraction of the overall response if we measure only on the server side—typically something between 20 and 50 percent. For instance, we miss the network transmission time and resource load times.
Timing details, such as how long it takes the server to return an HTML document, are of no concern to end users. Instead, they're much more aware of the total time it takes to load a page, all the content, including all images and other dynamic content.
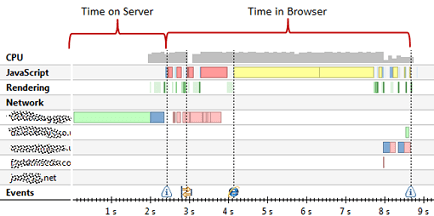
In the following figure, we see all activities associated with loading a page. This includes loading the document, images, as well as executing JavaScript, and rendering the content. In this example, server optimization will not prevent end users waiting a long time for the execution of the JavaScript before the page is completely loaded for them.
Technologies vary greatly, but are all grouped within the terms end user monitoring, "real user monitoring," or "user experience monitoring". In short, they are all used to measure performance closer to the end user. This can be accomplished by monitoring network traffic, capturing performance data in the users browsers, or by sampling data from a number of remote locations.
Before we look at the different methods in detail, we have to define which questions these tools must be able to answer:
- How long does it take to load a page?
- Were there any errors or problems in loading the page?
- How long has it taken to complete certain user interactions on the page?
This data can be collected in a number of different ways, and we need to look at the advantages and disadvantages of each, especially since they are complementary to a large extent.
Synthetic Monitoring
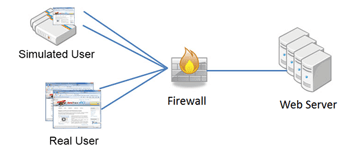
Synthetic monitoring involves executing scripts that mimic typical user transactions from locations around the globe. The performance of these transactions is measured and used to draw conclusions on how the sites behaves for real users. We can derive trends and make statements about the general performance and availability of the application.
The global distribution of points being measured also makes it possible to identify regional problems. So the quality of measurement strongly depends on the number of locations. The more and the closer to the end user the better.
The biggest shortcoming of synthetic monitoring is that it can only be used for a subset of user transactions. Transactions which have side effects like triggering an order cannot be monitored. It is obvious that you do not want your monitoring to trigger actual shipments in an e-commerce application.
The other downside of this approach is the effort required to maintain the scripts. Whenever the application logic is changed the corresponding scripts have to be modified as well. While a modular script definition approach will make this task easier, synthetic monitoring still requires constant maintenance.
Network-Centric Monitoring
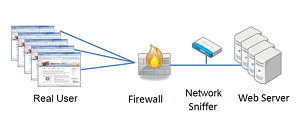
In contrast to synthetic monitoring, network-centric monitoring (illustrated in the following figure) measures actual response times for real users by analyzing the network traffic between browsers and backend servers. Monitoring the response times and network-related errors for each individual request enables us to measure network transmission times and detect application errors sent back as responses to user requests.
Imagine that a customer gets an error message when purchasing an item on a web site. If the user contacts customer support for the site, it is difficult to determine what happened for this specific user. With passive monitoring, the optimal case, the problem can be found automatically by looking at the actual network traffic.
Special appliances, hardware and virtual , are used for to collect performance data on the network level. These "network sniffers" log the network communication and thus reconstruct the click path for a user. Some solutions make it possible to combine this data with instrumentation in the browser, which is especially useful for single-page AJAX applications where user behavior either cannot be analyzed based on network communication, or only with difficulty.
The biggest shortcoming of network-centric monitoring is that response times are still measured within the datacenter. Performance problems coming from connectivity issues on the user's networks are hard to analyze. Another issues with this approach is the missing insight into the impact of Third-Party content—like ads or social widgets—on application performance.
Browser Instrumentation
This approach is becoming more popular, because it can collect performance data from directly inside the browser via HTML and JavaScript instrumentation. Either the requested pages already contain monitoring code or it is inserted into the HTML code during runtime. The advantage of this approach is that the exact response times can be collected for each user of the application. The W3C Navigation Timing specification defines a standardized approach for collecting this data. Currently the Web Timing specification is already implemented in most modern browsers, such as Chrome, Internet Explorer, and Firefox.
There is even a mobile implementation for IE on Windows Mango, and the Android implementation is in its early steps. Even if a browser has not implemented the standard, frameworks such as Boomerang or the information exposed by the Google Toolbar can be used to collect similar data.
The data is sent back to the server either through XHR or via a so-called beacon. A beacon represents a simple URL that is requested from a server. The measurement data is packaged as URL parameters. Browser Instrumentation is the only monitoring approach which collects real user performance data. Therefore it provides the most accurate measurement. It, however, cannot be used to monitor availability as measurements are only collected when pages are delivered to users. When the server however is not reachable, no pages will be requested.
Table of Contents
Application Performance Concepts
Memory Management
How Java Garbage Collection Works
The Impact of Garbage Collection on application performance
Reducing Garbage Collection Pause time
Making Garbage Collection faster
Not all JVMS are created equal
Analyzing the Performance impact of Memory Utilization and Garbage Collection
The different kinds of Java memory leaks and how to analyze them
High Memory utilization and their root causes
Classloader-releated Memory Issues
Performance Engineering
Virtualization and Cloud Performance
Try it free
