
The Impact of Garbage Collection on Application Performance
Chapter: Memory Management

As we've seen, the performance of the garbage collector is not determined by the number of dead objects, but rather by the number of live ones. The more objects die, the faster garbage collection is. If every object in the heap were to be garbage-collected, the GC cycle would be nearly instantaneous. Additionally, the garbage collector must suspend the execution of the application to ensure the integrity of the object trees. The more live objects are found, the longer the suspension, which has a direct impact on response time and throughput.
This fundamental tenet of garbage collection and the resulting effect on application execution is called the garbage-collection pause or GC pause time. In applications with multiple threads, this can quickly lead to scalability problems.
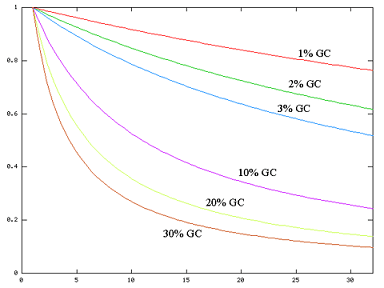
Figure 2.4 illustrates the impact that GC suspensions have on the throughput of multithreaded applications. An application that spends 1% of its execution time on garbage collection will loose more than 20% throughput on a 32-processor system. If we increase the GC time to 2%, the overall throughput will drop by another 20%. Such is the impact of suspending 32 executing threads simultaneously!
There are two commonly used methods to reduce GC pause time:
- Reducing suspension time by adjusting the mark-and-sweep algorithm.
- Limiting the number of objects that need to be marked.
But before we examine ways to improve garbage-collection performance, you should understand memory fragmentation, which impacts suspension time and application performance.
Get garbage collection metrics

About Fragmented Memory and Finding a Big Enough Hole
Whenever we create a new object in Java, the JVM automatically allocates a block of memory large enough to fit the new object on the heap. Repeated allocation and reclamation leads to memory fragmentation, which is similar to disk fragmentation. Memory fragmentation leads to two problems:
- Reduced allocation speed: The JVM tracks free memory in lists organized by block size. To create a new object, Java searches through the lists to select and allocate an optimally sized block. Fragmentation slows the allocation process, effectively slowing the application execution.
- Allocation Errors: Allocation errors happen when fragmentation becomes so great that the JVM is unable to allocate a sufficiently large block of memory for a new object.
Java does not rely on the operating system to solve these problems and must deal with these itself. Java avoids memory fragmentation by executing compaction (Figure 2.5) at the end of a successful GC cycle. The process is very similar to hard-disk defragmentation.
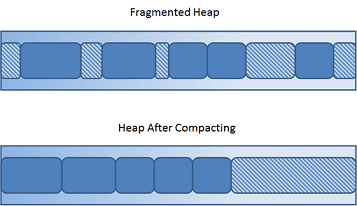
Compacting simply moves all live objects to one end of the heap, which effectively closes all holes. Objects can be allocated at full speed (no free lists are needed anymore), and problems creating large objects are avoided.
The downside is an even longer GC cycle, and since most JVMs suspend the application execution during compaction, the performance impact can be considerable.
Table of Contents
Application Performance Concepts
Memory Management
How Java Garbage Collection Works
The Impact of Garbage Collection on application performance
Reducing Garbage Collection Pause time
Making Garbage Collection faster
Not all JVMS are created equal
Analyzing the Performance impact of Memory Utilization and Garbage Collection
The different kinds of Java memory leaks and how to analyze them
High Memory utilization and their root causes
Classloader-releated Memory Issues
Performance Engineering
Virtualization and Cloud Performance
Try Java monitoring for free
