
To give your customers a top-quality digital experience, it’s important to make sure your applications are always working properly. Synthetic monitoring, also known as synthetic testing, can help to confirm your applications are performing as intended, and if they’re not, help you quickly figure out what’s going on. Although synthetic monitoring tools have become a crucial part of application performance monitoring, not all solutions cover all types or yield the best results.
As modern cloud architectures are evolving, so too are the ways users can interact with your applications. We’ll get into how the different types of monitoring work, but first, some background.
What is synthetic monitoring?
Synthetic monitoring is an application performance monitoring practice that emulates the paths users might take when engaging with an application. It uses scripts to generate simulated user behavior for different scenarios, geographic locations, device types, and other variables.
After collecting and analyzing this valuable performance data, a synthetic monitoring solution can:
- Give you crucial insight into how well your application is performing
- Automatically keep tabs on application uptime and tell you how your application responds to typical user behavior
- Zero in on specific business transactions — for example, by alerting you to issues users might experience while attempting to complete a purchase or fill out a web form
How does synthetic monitoring work?
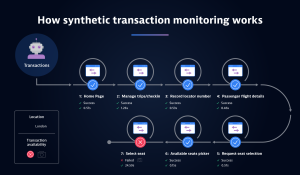
In synthetic monitoring, a robot client application that has been installed on a browser, device, or computer transmits a series of automated transactions to your application. These server calls and testing scripts simulate an end user’s clickstream as they navigate through key areas of your application. Typically, they run every 15 minutes, but you can configure them for different frequencies or to run immediately based on a specific action.
Once the robot client receives a response from your application, it reports the results back to the synthetic monitoring system. If the client detects an error during one of its regularly scheduled synthetic tests, the monitoring system will ask it to run that test again. If the follow-up test also results in an error, then the monitoring system will consider the error confirmed and escalate it within the organization as appropriate.
Teams can configure synthetic monitoring tools in various ways according to a company’s requirements. For example, you can set up a robot client on a machine that’s located behind your firewall to confirm that the internal environment is running as you expected, or you can deploy a robot client to a computer outside the firewall to get a sense of how well an application is performing. If you want a more comprehensive view of application availability and performance, you can configure several robot clients on browsers in multiple locations.
Synthetic monitoring vs. real user monitoring
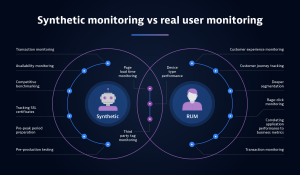
Synthetic monitoring is often compared with another application performance technique known as real user monitoring (RUM). As the name suggests, RUM tracks actions taken by actual users instead of emulating them. Organizations often implement RUM by injecting JavaScript code into a webpage and then collecting performance data in the background as actual users interact with that page.
So, what is synthetic monitoring typically used for, and when might a business decide to use RUM instead? Synthetic monitoring is often helpful to identify short-term performance issues that may impact the user experience while an application is still under development. Early detection helps businesses nip potential performance issues in the bud. This approach is handy for regression testing and production site monitoring, for example. Real user monitoring, by contrast, can help a business understand long-term trends in an application’s performance after it has been deployed.
Why use synthetic monitoring?
If your application doesn’t perform well when your customers try to use it, they will quickly leave in pursuit of a better customer experience. This could play out in a variety of ways. For example:
- High bounce rates. Your website might take too long to load, resulting in a high bounce rate. Or, you might be lagging behind your competitors when it comes to application performance without even knowing it. This will hurt your ability to acquire new customers and grow your market share.
- Difficulty troubleshooting. Even when your organization is aware something is amiss with an application, it may not know where to begin troubleshooting. When it comes to application performance, IT teams can’t always get to the bottom of what’s going on quickly — especially when they’re overextended and juggling several priorities. And while your people are in the dark and searching for answers, your organization could feel an immediate and significant impact on its bottom line.
Emulating user behavior paths in a test environment helps you avoid these issues so you can:
- Monitor system health. Synthetic monitoring can tell you if your website is available, how fast it’s running, if key transactions are functioning as expected, and where a potential slowdown or failure might lie.
- Improve performance. Over time, synthetic monitoring can give you performance benchmarks, highlighting areas for improvement and optimization.
- Prevent issues early. You can also use synthetic monitoring to find and fix potential errors before they affect your users, raising the bar on the user experience. This is particularly useful in continuous integration and continuous deployment (CI/CD) environments.
- Increase resiliency. Synthetic monitoring can also help you prepare for peak traffic periods or anticipate performance requirements in a new region or market.
Synthetic monitoring tools are also useful for making sure you’re honoring service level agreements (SLAs) with your end-users. If an issue comes up involving third-party providers, you will be better equipped to hold them accountable, as well.
Types of synthetic monitoring
Synthetic monitoring usually includes three types: availability monitoring, web performance monitoring, and transaction monitoring.
- Availability monitoring enables an organization to confirm that a site or application is available and responding to requests. Availability monitoring can also use a more granular approach — for example, by checking to make sure specific content is available or that a specific type of API call is successful.
- Web performance monitoring typically looks at specific web metrics such as page load speed and the performance of specific elements on a webpage. It checks web content, errors, and sluggish response times.
- Transaction monitoring attempts to complete specific transactions such as logging in, completing a form, and checkout.
Within the realm of synthetic monitoring, there are also two main categories of synthetic tests:
- Browser tests – a robot client simulates a transaction a user might attempt (such as making a purchase)
- API tests – an organization monitors specific endpoints across each layer of the network and application infrastructure
Within API tests, there are different types of tests, including HTTP, SSL, and DNS. For example, API tests often use HTTP tests to monitor application uptime and responsiveness. Meanwhile, SSL tests confirm if users can securely complete transactions on a site using valid SSL certificates, and DNS tests make sure the site’s DNS resolution and lookup times are within expected parameters. A company might use multiple API tests to monitor whether a specific workflow is working properly from end to end — this type of API monitoring is called a multistep API test.
Challenges of synthetic monitoring
Modern applications are inherently complex. Because users access them from a variety of locations and contexts, synthetic monitoring is often not comprehensive enough to account for all the potential errors or situations that might arise. DevOps teams are accounting for this problem by placing a higher priority on introducing application testing earlier in the software development life cycle. However, synthetic monitoring is still often difficult to properly set up without specialized technical knowledge, and it is time-consuming even for the team members that have the required skill set.
Synthetic tests aren’t very resilient, and they can easily fail when small UI changes are introduced, generating unnecessary alert noise. This means that whenever a minor application element such as a button is changed, the corresponding test must be, too. And lastly, many synthetic monitoring tools lack the context needed to explain why a specific failure happened or what the business implications might be, lengthening time to resolution and making it unnecessarily difficult to prioritize application performance issues.
Benefits of synthetic monitoring
Proactive Monitoring: Synthetic monitoring allows you to proactively spot performance issues and availability problems. By imitating user interactions, it identifies irregularities before they impact real users. This early detection helps prevent potential outages and ensures a smoother user experience.
Global Testing: You can assess your application’s performance in various locations. Synthetic tests run from multiple regions, providing insights into regional variations in performance.
Browser and Device-Specific Testing: Synthetic monitoring lets you evaluate your application’s behavior across different browsers and devices. This helps identify compatibility issues and ensures consistent performance for all users.
Works Inside and Outside the Firewall: Unlike Real User Monitoring (RUM), which relies on actual users, synthetic monitoring can be completely automated and run inside and outside your organization’s network. This flexibility ensures comprehensive coverage.
Automated with Regular Frequency: Synthetic monitoring can run at regular intervals, such as every minute or hour, 24/7. This continuous monitoring ensures timely detection of any performance degradation.
Synthetic monitoring tools
A good synthetic monitoring solution should give your organization complete, 24/7 visibility into your applications. To accomplish this, it should include the following kinds of synthetic monitors:
- Single-URL browser monitors. A single-URL browser monitor simulates the experience a user would have while visiting your application using an up-to-date web browser. When run frequently from public and private locations, a browser monitor can alert you when your application becomes inaccessible or when baseline performance degrades significantly.
- Browser click paths. Browser click paths also simulate a user’s visit, but they monitor specific workflows in your application. An advanced synthetic monitoring solution can let you record the exact sequence of clicks and user actions you want to monitor, then set the browser click path to automatically run at regular intervals.
- HTTP monitors. HTTP monitors are useful for monitoring whether specific API endpoints are available, and they can also perform straightforward HTTP checks to confirm single-resource availability. HTTP monitoring tools should allow you to set up performance thresholds for HTTP monitors, too.
Synthetic monitoring use cases
Financial Services
Online Banking Systems: Synthetic monitoring ensures that online banking platforms remain available and responsive for users.
Payment Gateways: Monitoring payment gateways helps prevent transaction failures and delays.
Trading Platforms: Synthetic tests verify the performance of trading systems, which are critical for financial institutions.
Healthcare Technology
Electronic Health Record (EHR) Systems: Synthetic monitoring ensures EHR systems are accessible and responsive for healthcare professionals.
Patient Portals: Monitoring patient portals helps maintain seamless communication between patients and healthcare providers.
Telehealth Platforms: Synthetic tests validate the reliability of telehealth services, especially during high-demand periods.
General Web Applications
Availability Testing: Proactively detect failures even when there is no user traffic (for example, off business hours).
API Endpoints: Monitor the availability and performance of third-party API endpoints.
How Dynatrace can power your synthetic monitoring
If you’re thinking about better understanding how your applications are performing, you might be wondering what synthetic monitoring tools you need to get started. You’ll want to pick a solution that simulates business-critical journeys through your most important applications across your mobile and web channels. This can give you immediate answers to questions about application availability and the impact it’s having on the user experience. Your synthetic monitoring solution should also be able to help you quickly identify the root cause of any application performance issue so you can resolve it as soon as possible.
Dynatrace Synthetic Monitoring provides all the information you need to know the moment an application’s performance falters. By using all major desktop and mobile browsers to simulate user activity, Dynatrace helps ensure that web, mobile, cloud, and streaming transactions go smoothly for customers around the globe.
This is key for evaluating whether applications meet your SLA requirements, and it can determine whether business outcomes have been impacted. It can also eliminate troubleshooting through AI-driven automation, as well as rank problems in order of importance to the business — significantly reducing the time required for your IT team to identify and address root causes.
To catch those longer-term trends, Dynatrace RUM uniquely captures the full visibility of the customer experience to eliminate user experience blind spots, and Session Replay provides indisputable video evidence of the complete digital experience, so business, development and operations stakeholders can collaborate and agree where to make improvements.
These advanced digital experience monitoring capabilities help you proactively identify and address application performance issues from anywhere in the world. With the right synthetic monitoring solutions in place, your business can go a long way toward ensuring a consistent, satisfying customer experience.


Looking for answers?
Start a new discussion or ask for help in our Q&A forum.
Go to forum