Observability as a topic is becoming more important as applications are using microservice architectures and are deployed in Kubernetes environments. In a recent real-world use case, a team of application developers were relying on metrics and log data alone to diagnose memory issues and they had a hard time identifying the root-cause of the issue. This example shows how relying on metrics and log data alone is insufficient. In contrast, what customers really need is a platform that extends their observability beyond metrics, traces, and logs, to include automatic topology mapping, code-level data, and an AI engine that reliably pinpoints the problem root-cause.
The setup
In order to replicate the issue that I observed at the customer site, I used the app “k8s-fleetman” which is an angular web application that shows the locations of different trucks that are part of a fleet. As was true in the customer’s application, it also uses Springboot. Even though some of the libraries are different, the overall architecture and the design pattern are very similar to what I saw at the customer site; it also uses a microservices architecture and is deployed in Kubernetes environment.
The service flow
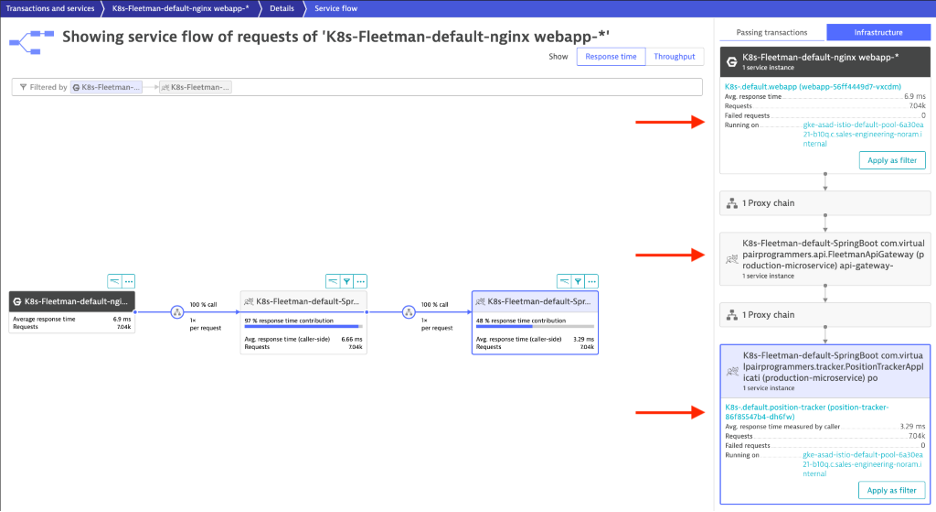
With nginx as the web server, the sample application makes a call to api-gateway service which in turn makes a call to position-tracker service as visible in the service flow.
As observed in the customer’s instance, the application worked fine when there was a small to medium amount of load in the environment. But when the customer ran a heavy load test, they started to see long garbage collection time in the middle tier. In order to reproduce the same problem, I ran JMeter test and put a heavy load on this sample app. As expected, I saw the same garbage collection problem and slow down.
Problem Analysis
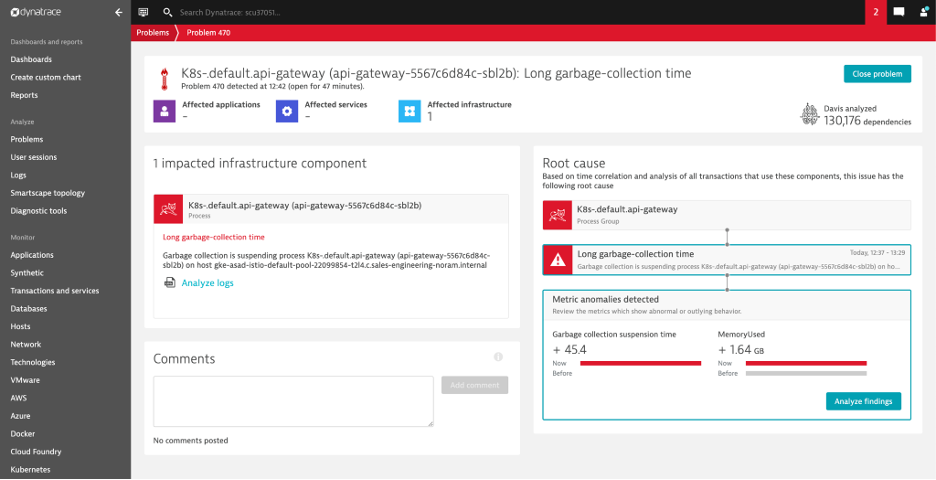
In order to figure out what was really going on, I “cheated” and deployed Dynatrace. The OneAgent automatically mapped the entire environment and provided me with the service flow (that is connected traces) and performance baselines in the screenshot above. Shortly after applying the heavy load, Davis®, the Dynatrace AI engine, notified me of a problem. Davis not only identified the garbage collection as the root-cause, but pointed me to the specific process causing the trouble. In my sample all, the long garbage collection time was experienced by the api-gateway tier. The metrics data in Dynatrace also showed detailed information about the memory utilization and garbage collection time for the api-gateway process.
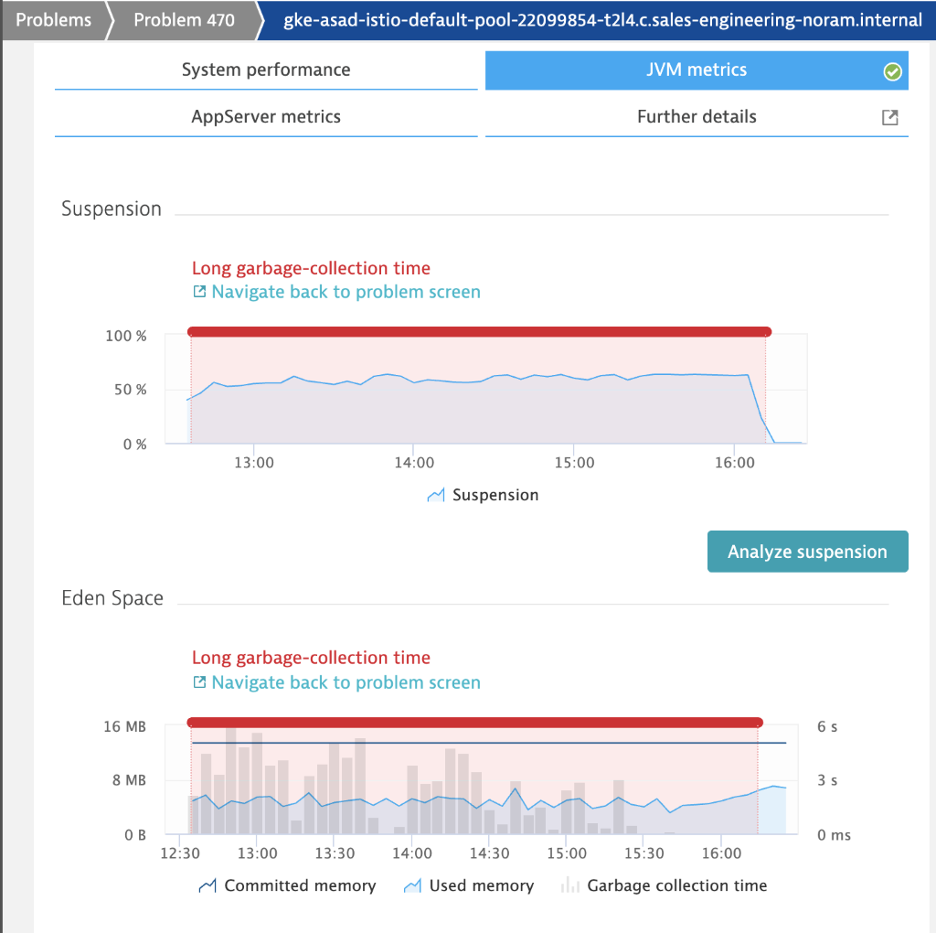
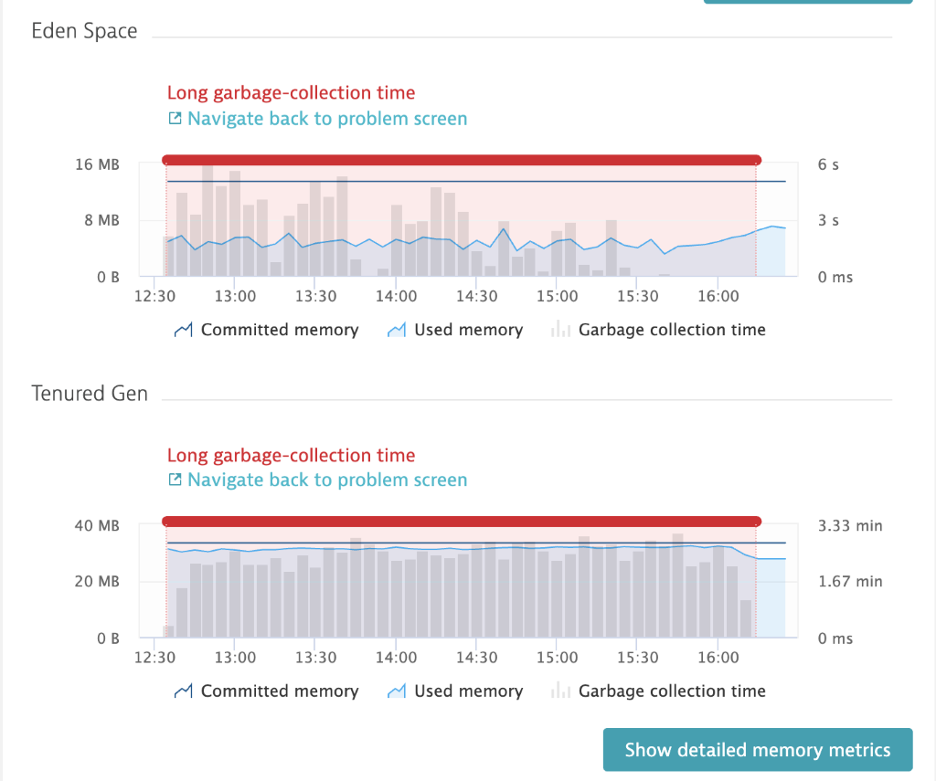
If I was using only metrics to diagnose application performance, my investigation would have stopped at the long garbage collection time at the api-gateway tier. What it would have failed to answer is what is causing long garbage collection. The same was true for this customer’s approach.
In cases like these, users resorted to using multiple tools to analyze memory issues like these. Since I was using the OneAgent of Dynatrace, I used the continuous memory profiling feature to identify the objects that were causing long garbage collection. By selecting “Analyze Suspension” in the metrics overview, I got insight into the root-cause of the objects that were causing the garbage collection issues.
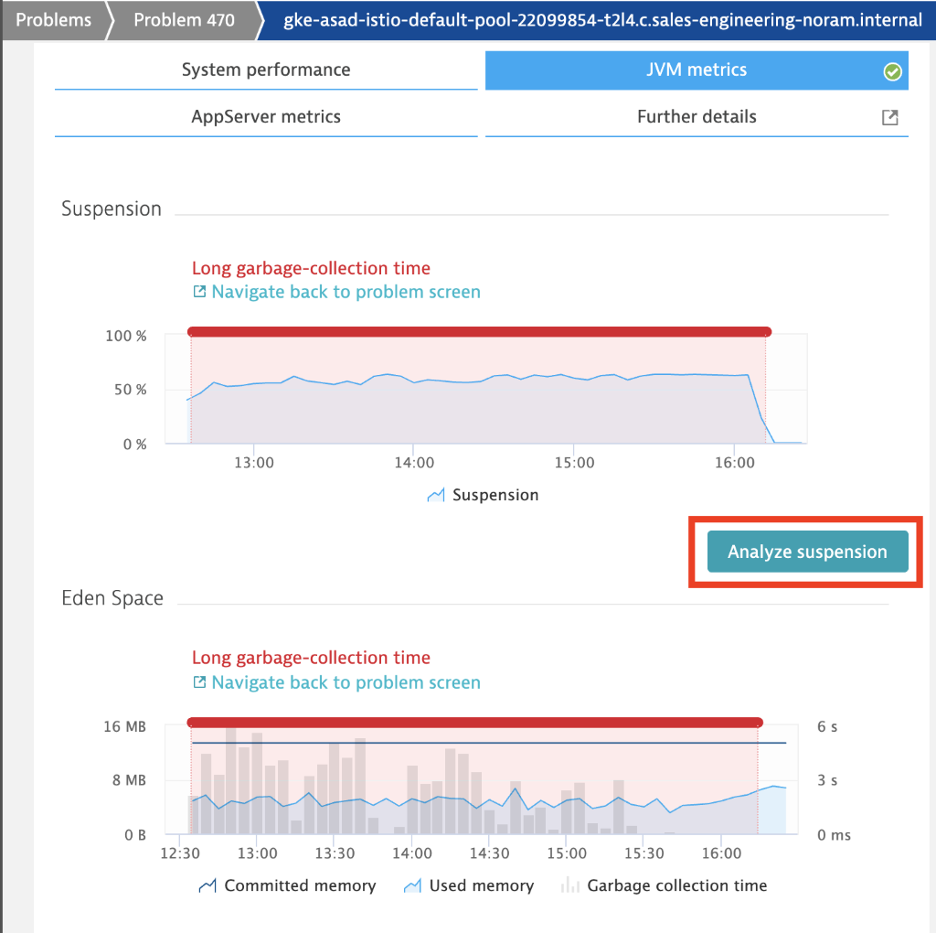
My Springboot sample app was using Feign Client library to make outbound calls from api-gateway to position-tracker. These outbound calls to position-tracker service returned the current position of a given truck in the fleet. As I increased the transaction load using JMeter, the api-gateway created a large number of Feign Client objects which in turn caused memory issues on that tier.
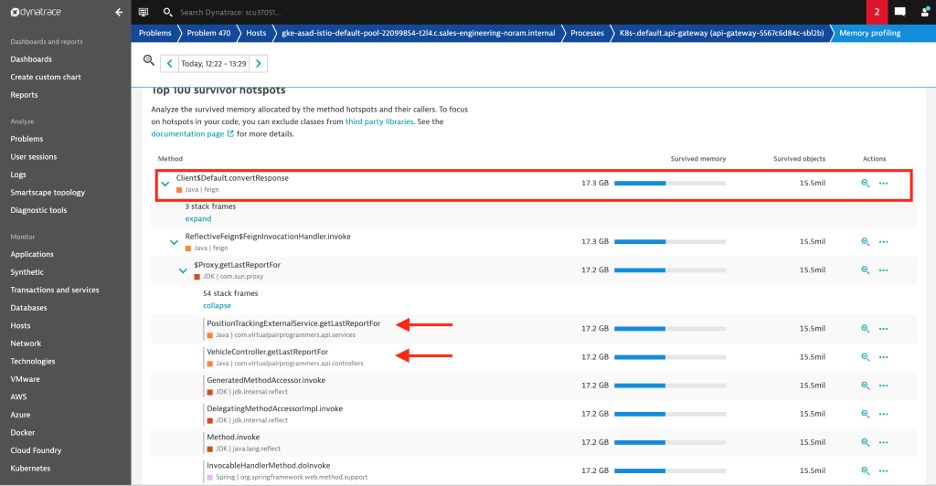
As shown in the screenshot above, the top method that was creating the greatest number of objects in memory was convertResponse – part of the Feign Client library. Upon further analysis, it is clearly visible that VehicleController class within the api-gateway process is calling the feign client library that in turn is the biggest creator of objects in memory.
The author of this sample app clearly indicated that the fleet tracking app is built for demonstration purposes and not used in any production environment. Knowing this I chose this application to reproduce the problem that the customer was experiencing because it mimicked their problem very well despite the fact the customer was using different libraries than used in my sample app. Both the customer application and my sample app exhibited similar problem pattern.
Next step
Armed with the information about the class and library that’s causing the long garbage collection, I’m planning to use the connection pool for the Feign Client library in the api-gateway process.
My intention of this tweak to the application is that the api-gateway process would create a pre-determined number of objects to call an external service and that in turn would eliminate the creation of a large number of objects. Also, by using the connection pool, I’ll be able to use the existing connection to make outbound calls that in turn would improve my application performance.
Conclusion
For applications that are using microservices architecture, and are deployed in Kubernetes environment, there are a lot of moving parts. Relying solely on metrics data in such an environment limits the ability to find the root cause of any application performance in a timely fashion. It also forces the customers to rely on multiple tools to pinpoint the issue.
In contrast, advanced observability, automation, and AI-assistance are specifically built for complex Kubernetes and cloud-native environments. It helps you to find and correct performance issues in a timely manner and ultimately deliver better customer experiences.
Enhance your Kubernetes monitoring experience today. Check out the Dynatrace Free Trial!





Looking for answers?
Start a new discussion or ask for help in our Q&A forum.
Go to forum