Welcome back to the blog series where we provide you with deeper dives into the latest observability awesomeness from Dynatrace, demonstrating how we bring scale, zero configuration, automatic AI driven alerting, and root cause analysis to all your custom metrics, including open-source observability frameworks like StatsD, Telegraf, and Prometheus.
- In Part 1 we explored how you can use the Davis AI to analyze your StatsD metrics.
- In Part 2 we showed how you can run multidimensional analysis for external metrics that are ingested via the OneAgent Metric API.
- In Part 3 we discussed how the Davis® AI can analyze your metrics from scripting languages like Bash or PowerShell.
Here, in Part 4 of this series, we show you how to leverage the power of Dynatrace Davis for your Prometheus metrics in Kubernetes.
Analyzing Prometheus metrics in Kubernetes is challenging
Prometheus has become the dominant metric provider and sink in the Kubernetes space. Many technologies already expose their metrics in the Prometheus data format. Others provide exporters to transform the metrics of their monitoring interface into a Prometheus compliant format. However, the vast number of technologies and metrics makes it difficult to get the most value out of them. The two main pain points that users struggle with are:
- Maintaining the run of the Prometheus infrastructure and keeping alerting configurations up to date for all the metrics at enterprise scale
- Bringing the analyzed metrics into context with other pillars of observability, for instance, traces of microservices within the pod that exposes the metrics
Dynatrace now provides support for Prometheus metrics of Kubernetes pods, bringing these metrics into the larger context of the microservices and pods, and allowing for enhanced alerting with auto-adaptive baselining of these metrics.
Unlocking the power of Prometheus metrics
Dynatrace makes it easy for you to pull Prometheus metrics from Kubernetes pods into your environment and making them available for further analytics. Dynatrace leverages K8s pod annotations for integrating metrics into Dynatrace and enriching them with K8s topology information. You only need to define a couple of annotations in the pods template of your workloads to have Dynatrace pick up the metrics.
The Dynatrace annotations in the following sample pod template control if and at which port the metrics are to be captured:
apiVersion: apps/v1
kind: Deployment
metadata:
  name: redis-cart
spec:
  template:
    metadata:
      annotations:
        metrics.dynatrace.com/port: "9121"
        metrics.dynatrace.com/scrape: "true"
      labels:
        app.kubernetes.io/name: redis-cart
    spec:
      containers:
      - name: redis
        image: docker.io/redis:alpine
        ports:
        - containerPort: 6379
# skipped some yaml
      - name: redis-exporter
        image: oliver006/redis_exporter:v1.14.0
        ports:
        - containerPort: 9121
# skipped some yaml
Visualize the most important metrics on your dashboards
The metrics from Prometheus endpoints are available in the Metrics overview (to access, select Metrics from the navigation menu) and can be used in the new Data explorer for charting and creating your own dashboards.
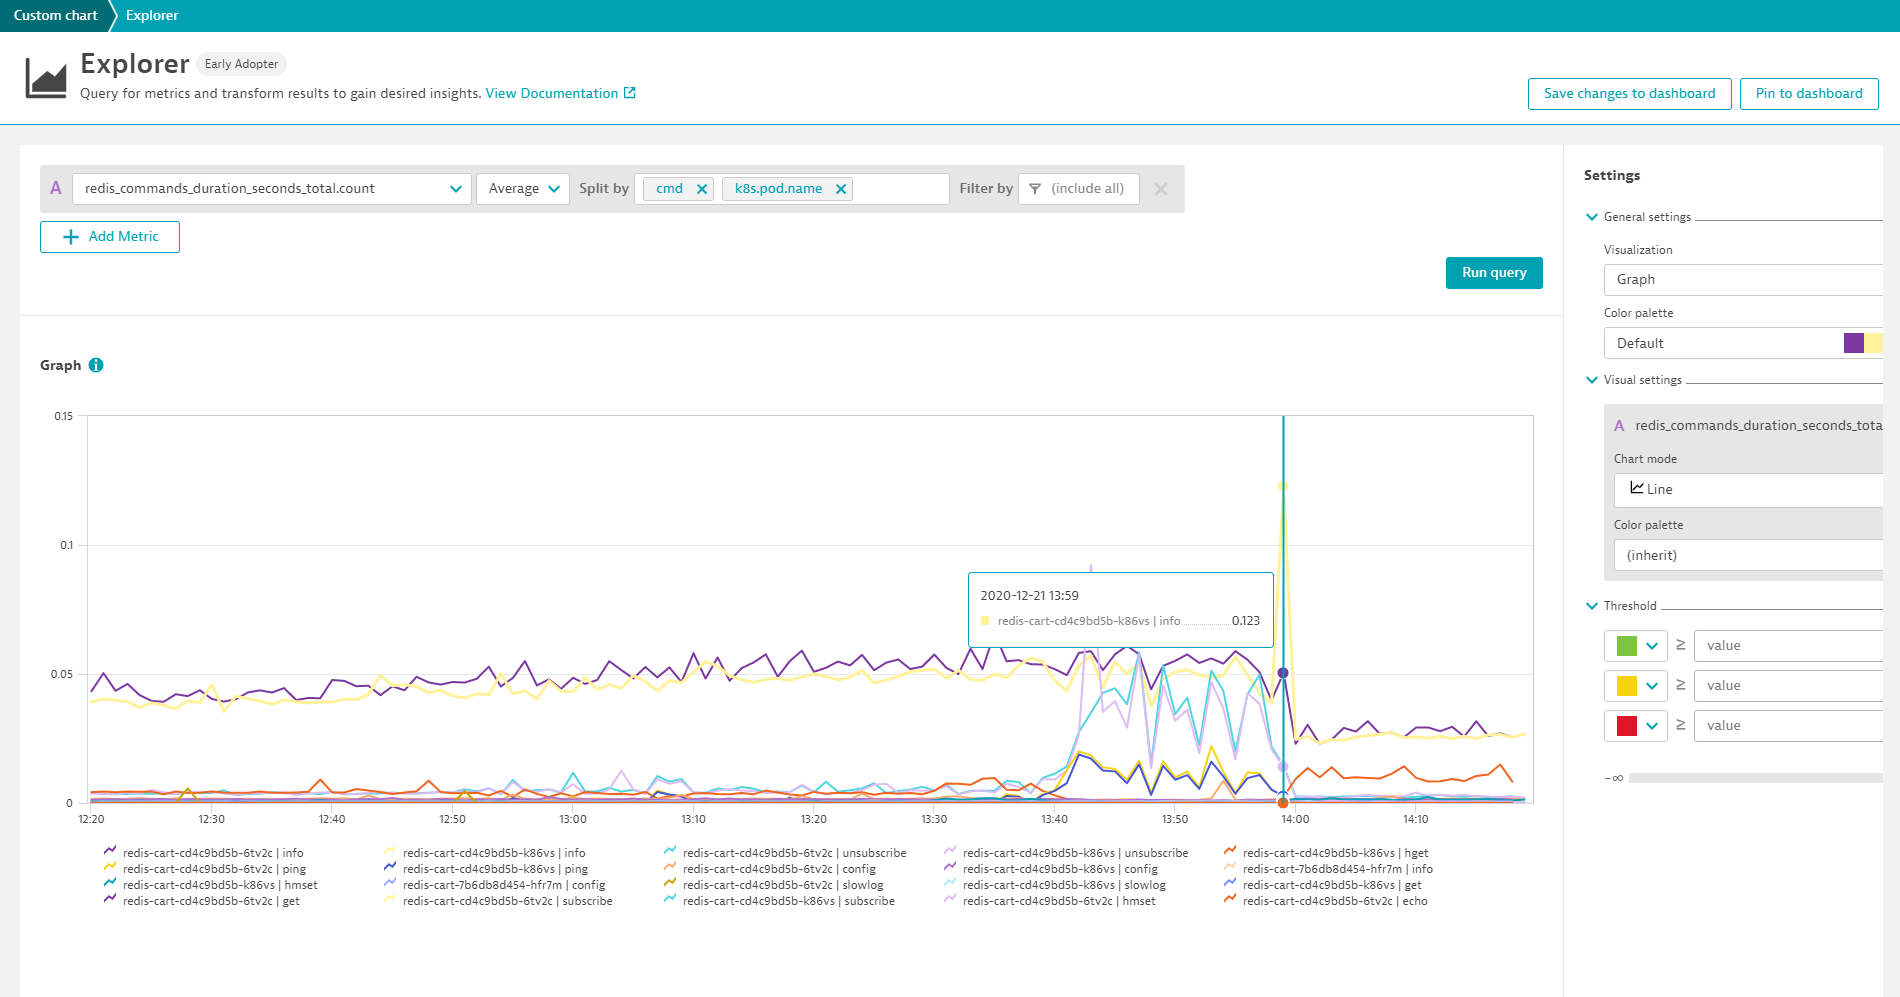
In the following example we chart the redis_commands_duration_seconds_total metric for all Redis pods and split the metric by the dimension cmd.

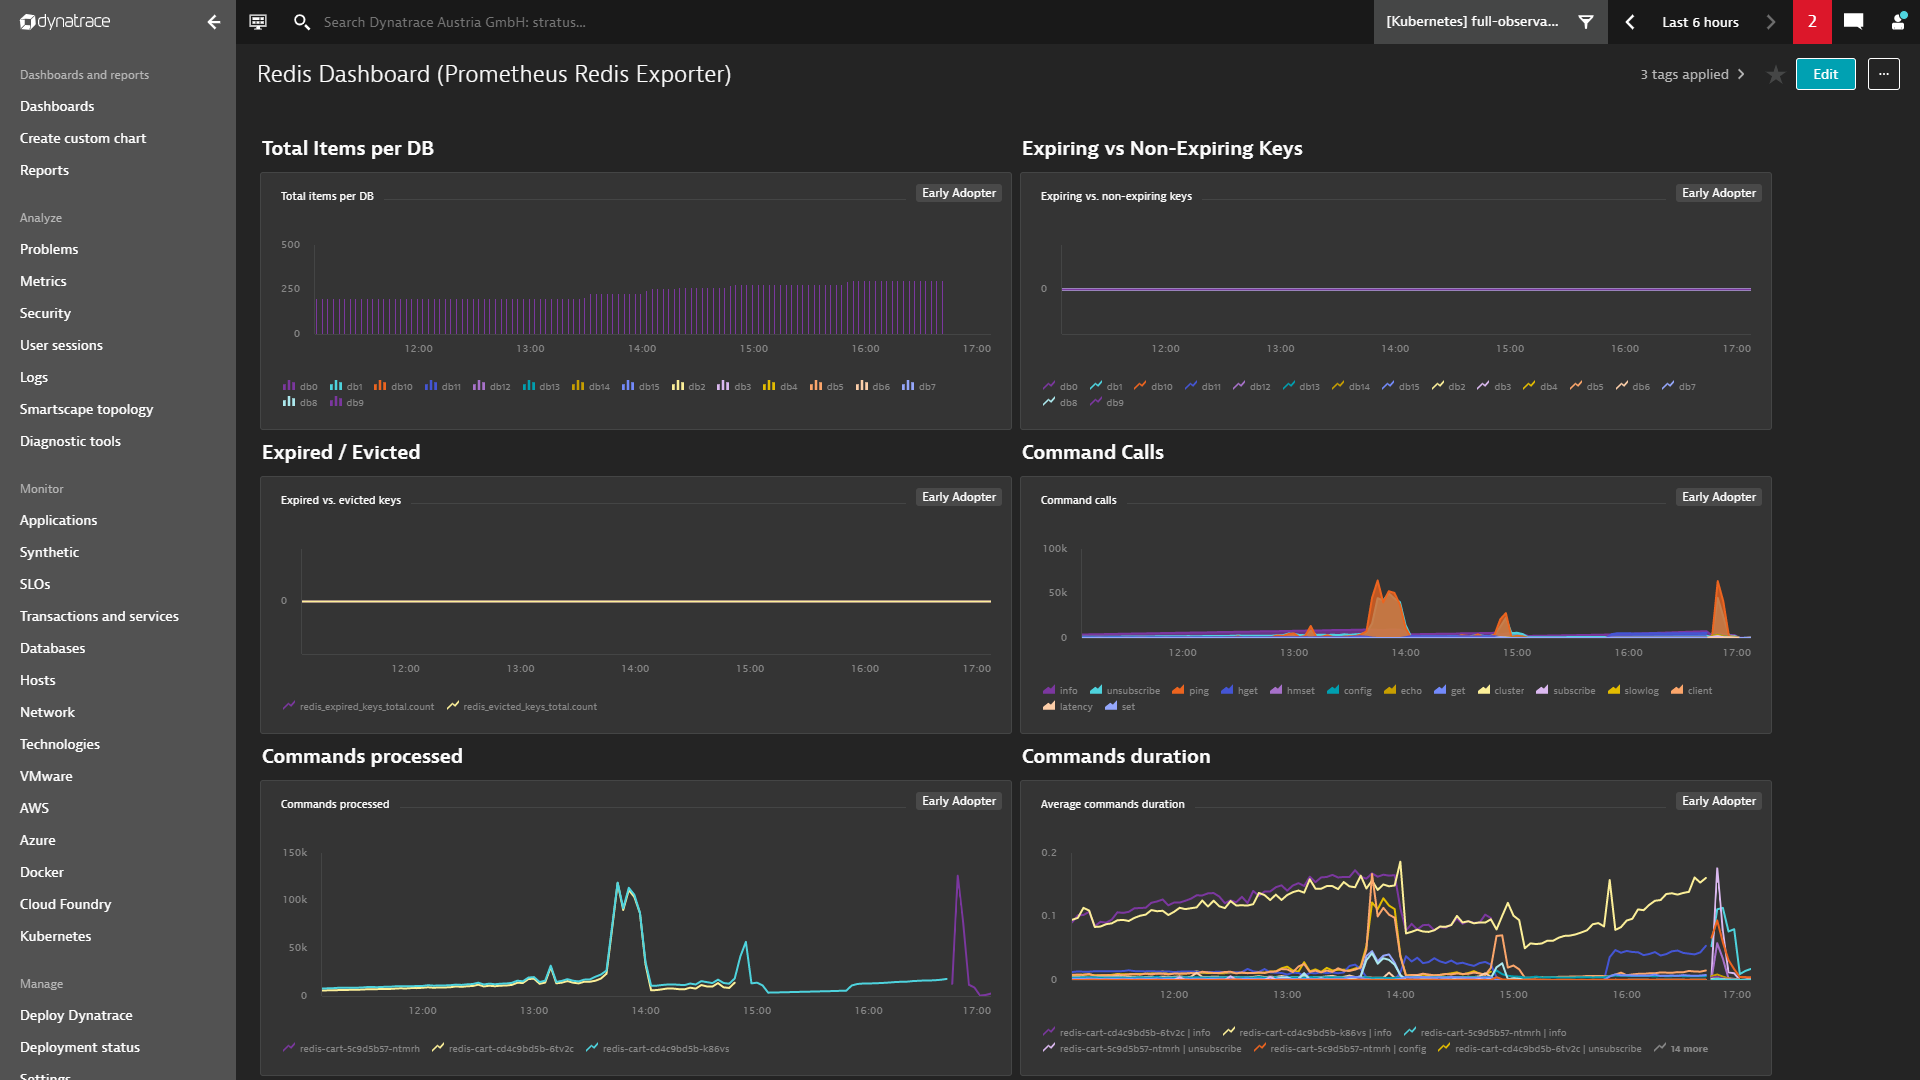
Charts can easily be pinned to dashboards and thus provide an instant overview of all important metrics. When metrics are displayed on dashboards, management zone filtering is applied automatically so that team members only have visibility into those metrics that they are authorized to view.

Leverage auto-baselining for Prometheus metrics
When it comes to alerting, the typical approach is to define static thresholds that can’t be exceeded during a defined timeframe. This approach works well for availability-related metrics.
There are also however performance related metrics for which it makes sense to follow a baseline, and alert on anomalies when the reference value changes over time. The key advantage of such an auto-adaptive baselining approach is that you don’t need to manually adapt the thresholds of your alerting configurations when system behavior changes slightly.
Get started with just a few steps
Dynatrace integrates Gauge and Counter metrics from Prometheus exporters in Kubernetes environments. For this you need to enable the Monitor Prometheus exporters toggle in the settings for your Kubernetes environments and monitor the Kubernetes environments with an ActiveGate version 1.201+. Once you’ve enabled the toggle and annotated the pods, the respective metrics will automatically show up in your environment for charting, alerting, and analysis.
What’s next for Prometheus metrics support
We’ve already received valuable feedback from early customers and are enhancing our support for Prometheus. Topics that are high on our list are:
- Support for scraping metrics from K8s service endpoints
- Integrating Prometheus scrape configurations and targets
- Dedicated support and dashboards for K8s control plane, Istio, and OpenShift components
- Running Kubernetes and Prometheus monitoring in K8s pods
Start a free trial!
Dynatrace is free to use for 15 days! The trial stops automatically, no credit card is required. Just enter your email address, choose your cloud location, and install our agent.


Looking for answers?
Start a new discussion or ask for help in our Q&A forum.
Go to forum