
Welcome back to the blog series where we provide you with deeper dives into the latest observability awesomeness from Dynatrace, demonstrating how we bring scale, zero configuration, automatic AI-driven alerting, and root cause analysis to all your custom metrics, including open source observability frameworks like StatsD, Telegraf, and Prometheus.
- In Part 1 we explored how you can use the Davis® AI to analyze your StatsD metrics.
- In Part 2 we showed how you can run multidimensional analysis for external metrics that are ingested via the OneAgent Metric API.
StatsD and the REST API are both well suited for integrations into applications or existing back-end services. However, site reliability engineers and operations teams are often interested in metrics that are readily available via command-line tools, and they want to monitor these metrics via Bash or other scripting languages like PowerShell or Cronjob.
Let the Davis AI analyze your metrics from scripting languages like Bash or PowerShell
You can now use our new scripting integration to ingest and analyze metrics from these other scripting languages. The integration uses the same mechanisms that are used for the REST API and StatsD. You can therefore chart metrics in the same way, but now you’ll see the extra dimensions. The integration uses the same simple line protocol as the REST API and is thus fully multidimensional and Smartscape topology aware. And, just as before, you can apply our auto-adaptive baseline alerts to receive the full power of Davis AI on top of your integration.
Having this functionality at your fingertips allows site reliability engineers and operation teams to leverage their existing knowledge and tool sets in combination with Dynatrace. These teams know exactly what they need to run their applications and services, but they need to be able to do more with less. Dynatrace automates the crucial step of observing and analyzing the incoming data points, allowing them to analyze ever more data with less effort than before.
Example use case: Get various CPU metrics per processor
Say that you have customers who want to get various CPU metrics per processor. There is a nice tool for getting this information on Linux this called mpstat. The output looks like this:
12:36:58     CPU    %usr   %nice    %sys %iowait    %irq   %soft  %steal  %guest  %gnice   %idle
12:36:58     all    0.05    0.00    0.26    0.02    0.00    0.03    0.00    0.00    0.00   99.64
12:36:58       0    0.02    0.00    0.10    0.02    0.00    0.23    0.00    0.00    0.00   99.63
12:36:58       1    0.00    0.00    0.03    0.01    0.00    0.00    0.00    0.00    0.00   99.96
12:36:58       2    0.24    0.00    1.20    0.01    0.00    0.00    0.00    0.00    0.00   98.55
12:36:58       3    0.05    0.00    0.41    0.01    0.00    0.00    0.00    0.00    0.00   99.54
12:36:58       4    0.01    0.00    0.07    0.00    0.00    0.00    0.00    0.00    0.00   99.91
12:36:58       5    0.04    0.00    0.09    0.01    0.00    0.00    0.00    0.00    0.00   99.85
12:36:58       6    0.01    0.00    0.18    0.07    0.00    0.00    0.00    0.00    0.00   99.74
12:36:58       7    0.01    0.00    0.02    0.02    0.00    0.00    0.00    0.00    0.00   99.9
If you want to send the user CPU time into Dynatrace, now you can use a simple line protocol that looks like this:
host.cpu.usr,core=core0 0.01The notation here is exactly the same as in our REST API, which is described in Part 2 of this blog series:
<metric name>,<Dimension1>=<value>,<Dimension2>=<value> <metric value>So, all you need to do is convert the output of mpstat to the Dynatrace metric format, which can be done using a command like this:
mpstat -P ALL | tail -n +5 | awk {'print "host.cpu.usr,core="$2" "$3;'}
host.cpu.usr,core=0 0.01
host.cpu.usr,core=1 0.01
host.cpu.usr,core=2 0.08
host.cpu.usr,core=3 0.03
host.cpu.usr,core=4 0.00
host.cpu.usr,core=5 0.01
host.cpu.usr,core=6 0.02
host.cpu.usr,core=7 0.01
This simply removes the first five lines of the output (which is header information) and then takes the second and third column from the output to the output string. You can extend this easily to include other values, like idle time:
mpstat -P ALL | tail -n +5 | awk {'print "host.cpu.usr,core="$2" "$3"\nhost.cpu.idle,core="$2" "$12;'}
host.cpu.usr,core=0 0.01
host.cpu.idle,core=0 99.87
host.cpu.usr,core=1 0.01
host.cpu.idle,core=1 99.98
host.cpu.usr,core=2 0.07
host.cpu.idle,core=2 99.61
host.cpu.usr,core=3 0.02
host.cpu.idle,core=3 99.59
host.cpu.usr,core=4 0.00
host.cpu.idle,core=4 99.97
host.cpu.usr,core=5 0.01
host.cpu.idle,core=5 99.95
host.cpu.usr,core=6 0.02
host.cpu.idle,core=6 99.91
host.cpu.usr,core=7 0.01
host.cpu.idle,core=7 99.98
If you now want to send this into Dynatrace, all you have to do is ensure that OneAgent is installed on your machine and pipe it into the command called dynatrace_ingest.
mpstat -P ALL | tail -n +5 | awk {'print "host.cpu.usr,core="$2" "$3"\nhost.cpu.idle,core="$2" "$12;'} | dynatrace_ingestTo execute this once per minute, add it to your cron_tab. This gives you an easy way to enrich Dynatrace with the metrics you need. Dynatrace OneAgent takes care of everything else.
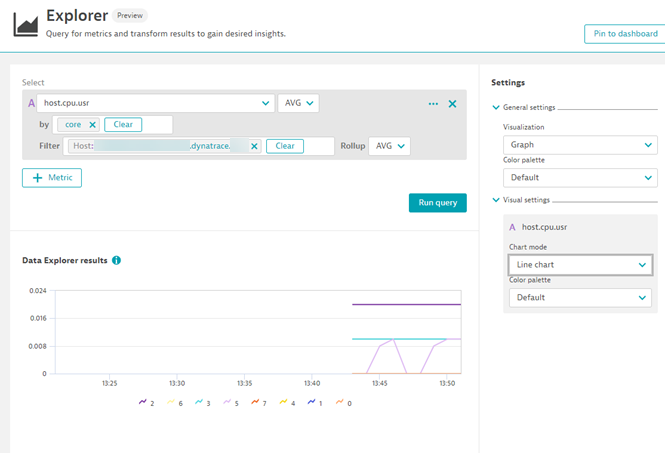
Under the hood, the same mechanisms that are used for StatsD are used here. You can therefore chart these metrics in the same way, but now you’ll see the extra dimensions.
While the example here is Linux based, this of course also works for Windows as well.
How to get started
Make sure that OneAgent version 1.201+ is installed on the VM or host that you want to monitor. Enable the OneAgent metric API at the environment or host level and, if necessary, modify the default metric ingestion port. For details, see Metric scripting integration in Dynatrace Help.
New to Dynatrace? Try it out by starting your free trial today.


Looking for answers?
Start a new discussion or ask for help in our Q&A forum.
Go to forum