
Welcome to the blog series where we give you a deeper dive into the latest awesomeness around Dynatrace: how we bring scale, zero configuration, automatic AI driven alerting, and root cause analysis to all your custom metrics, including open source observability frameworks like StatsD, Telegraf, and Prometheus. In this post we’ll explore how you can use the Davis® AI to analyze your StatsD metrics.
Making sense of StatsD metrics is challenging
As an application owner, you’ve likely asked yourself questions such as, “How often is method X called?”, “How long does it take to process request Y?”, or “How frequently is this page accessed?” StatsD is a standard that helps you collect, aggregate, and send such developer-defined application metrics to a defined backend for further analysis.
But what’s the point of having millions of data points if you can’t make sense of them? And what’s the point of having a cool data-collection tool if you need to maintain configurations for it locally? Especially in large enterprise environments, with hundreds of thousands of instances and containers, the local maintenance of StatsD configurations is definitely not a dream job. But now you have help from Dynatrace!
Dynatrace brings AIOps to your StatsD metrics
We’re proud to announce that Dynatrace OneAgent now speaks StatsD, giving you a new, vendor neutral way of bringing your existing metric sources into the Dynatrace platform and receiving the full benefits of both Dynatrace OneAgent and the Davis AI. We now fully integrate your StatsD metrics into Smartscape and give you auto adaptive baselining and Davis automated root-cause analysis from Day 1.
We’ve done this by embedding a fully compatible StatsD daemon into Dynatrace OneAgent. The StatsD daemon implements the StatsD protocol but extends it to allow for multiple metric dimensions, which the original StatsD protocol doesn’t support. This is done in a compatible way, so it works perfectly with the original protocol.
For example, where StatsD only allows you to send a gauge metric value:
<metric name>:<value>|g
DynatraceStatsD allows you to send dimensions as well:
<metric name>:<value>|g|#<Dimension1>:<value>,<Dimension2>:<value>
What’s your use case?
- You might be using any of the 60+ StatsD compliant client libraries to send metrics from various programming languages directly to Dynatrace.
- DynatraceStatsD also understands the
dogstatsdprotocol extension, so you might use anydogstatsdlibrary as well to immediately gain more value from your existing integrations. - You might use a metric framework like Dropwizard or Spring Micrometer, which have StatsD built-in for sending metrics.
- Or you might be using open source solutions that have StatsD built-in, for example Apache Airflow, which can send health and performance metrics to any StatsD compliant backend.
No matter which use case you have, you can now easily make sense of your StatsD metrics with Dynatrace by turning on a simple configuration switch. For the sake of this blog post, we’ll look into the Apache Airflow example.
Automatic observability into Apache Airflow apps by sending StatsD metrics to Dynatrace
As the owner of an Apache Airflow application, you want to ensure that your application is healthy and performing well. Apache Airflow allows you to activate the StatsD monitoring feature. When doing this, you need to add the following lines to airflow.cfg:
[scheduler]

statsd_on = True

statsd_host = localhost

statsd_port = 18125

statsd_prefix = airflow
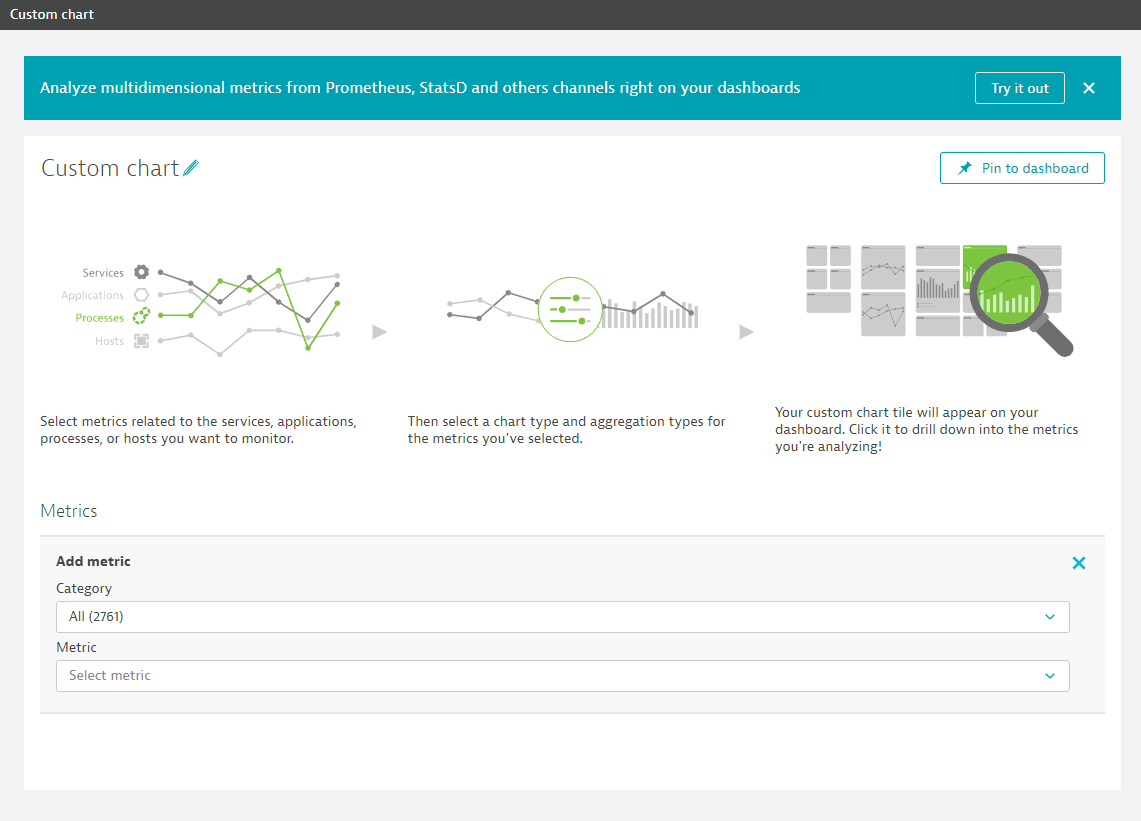
To send StatsD metrics to Dynatrace, ensure that you have a OneAgent running on the same machine where your StatsD metrics are hosted. Apache Airflow can then immediately be monitored by Dynatrace and the result will be visible in your Dynatrace environment. You'll find this option on the Custom chart page (Select Create custom chart from the navigation menu). Select Try it out on the banner shown below to get to the new Data explorer.
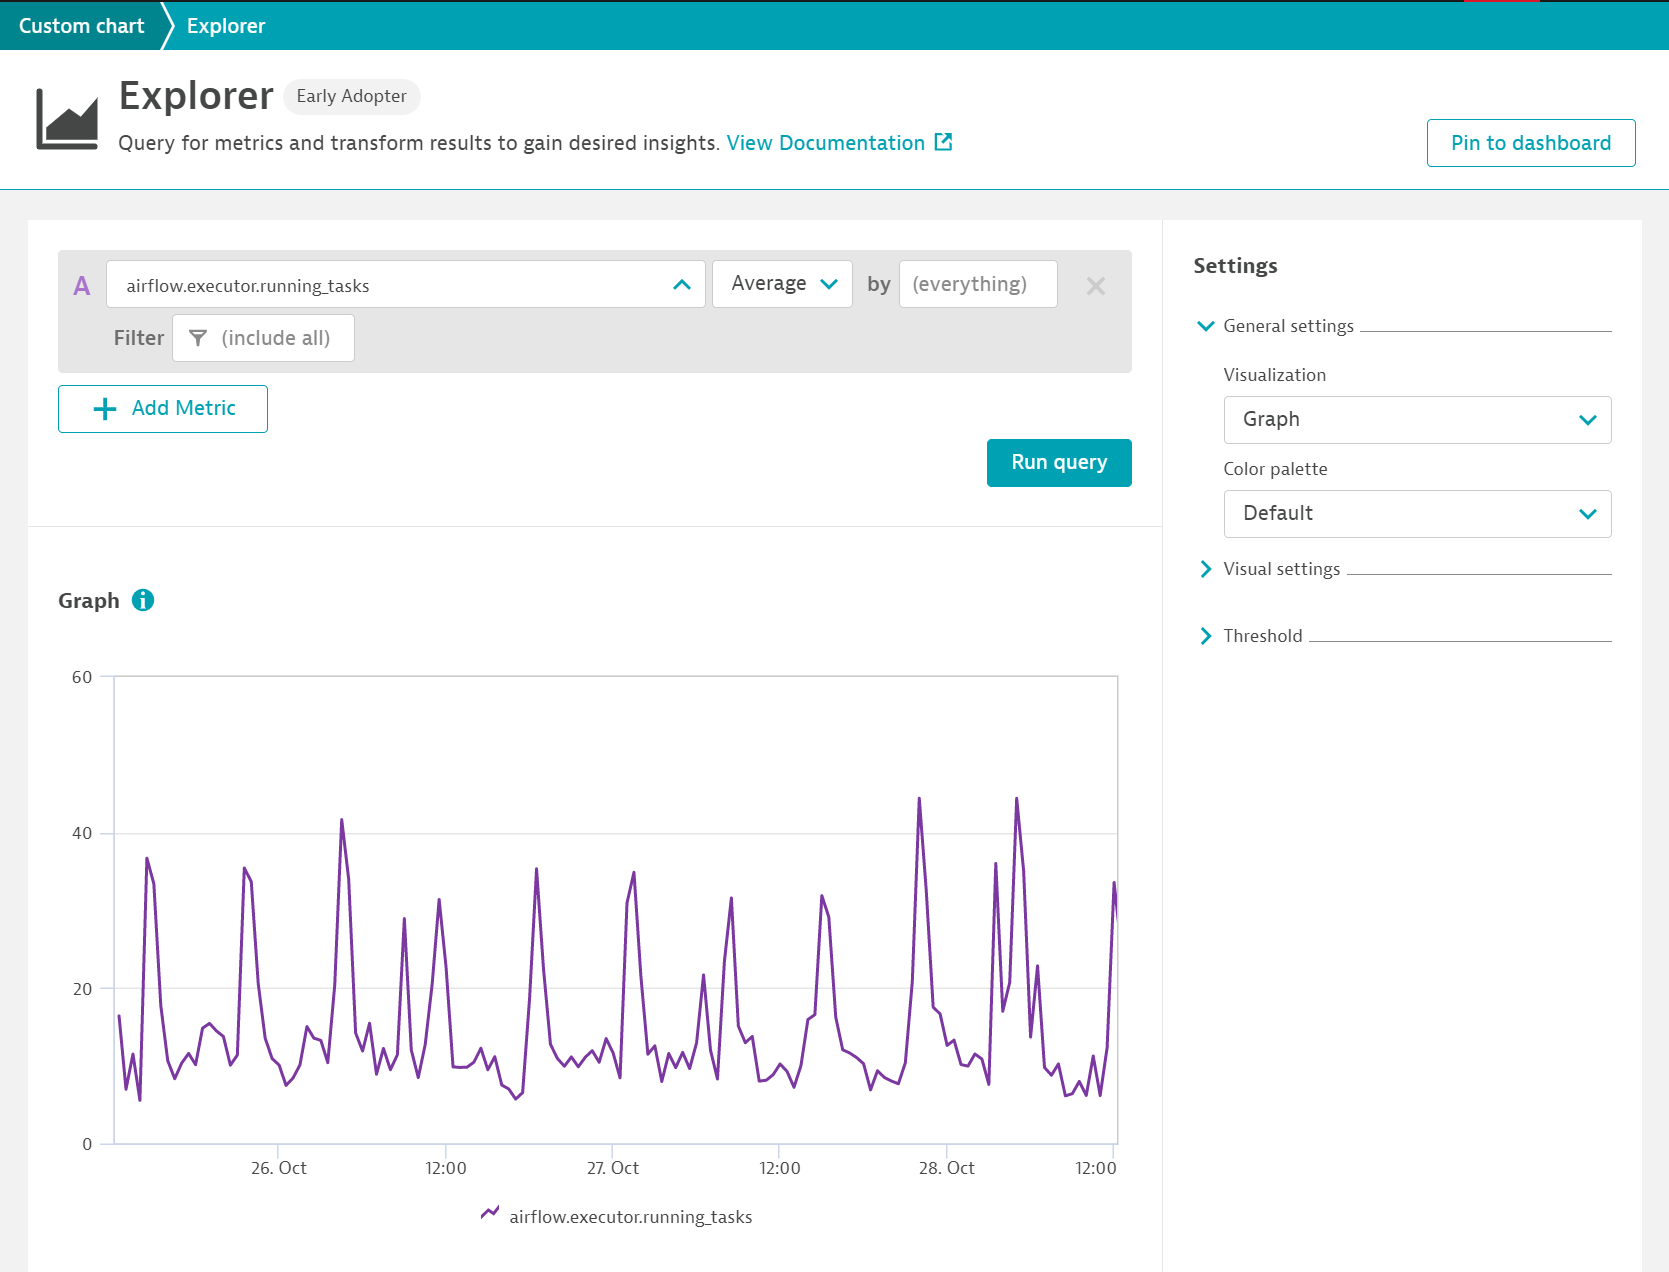
In case of Apache Airflow one of the most important metrics is the amount of currently executed and queued tasks (airflow.executor.running_tasks).
For alerting purposes you might want to create an auto-adaptive baseline metric for queued tasks. If this metric exceeds the normal bounds, this is an indicator of a load spike that your system can't handle or a slowdown in the processing of your tasks that has led to a queue backup.
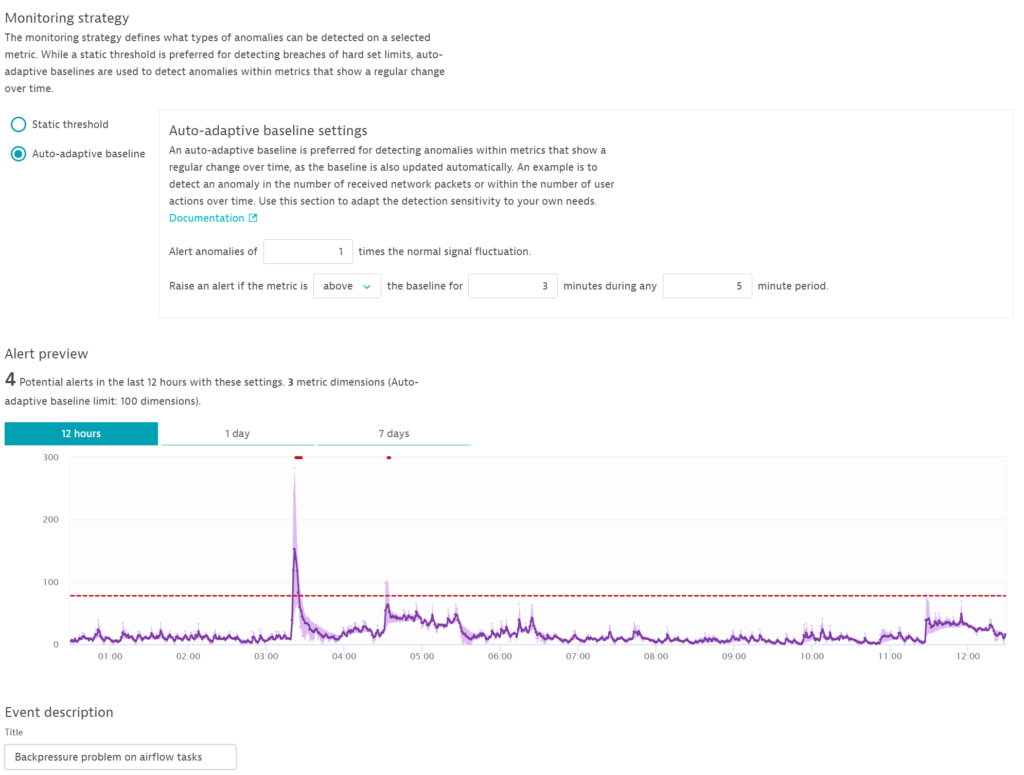
The advantage of auto-adaptive baselining for custom metrics is that you don't have to define thresholds, which might vary for each Apache Airflow instance that you have and they can change over time. Dynatrace brings the necessary intelligence to alerting on Airflow metrics so that you don't have to worry about maintaining numerous metric thresholds.
Couple this with Davis automated root cause analysis and you gain the power of the Dynatrace AI for every StatsD integration.
How to get started
First, ensure that OneAgent version 1.201+ is installed on the VM or host that you want to monitor.
StatsD usually listens on port 8125. In order not to break existing StatsD setups or other systems that use this port, DynatraceStatsD listens on 18125 by default, but you can change this to the default StatsD port. DynatraceStatsD automatically aggregates the incoming data and sends it to Dynatrace once per minute, where it's immediately available for charting, alerting, and AI-driven root cause analysis.
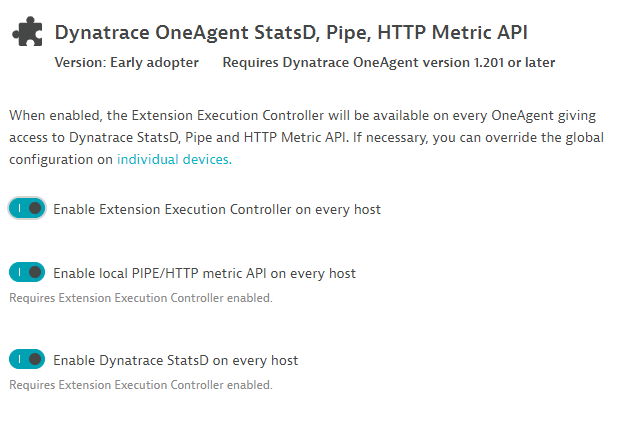
To activate the integration, go to Settings > Monitored technologies and look for Dynatrace OneAgent StatsD, Pipe, HTTP Metric API.

Click the Edit button and turn on Enable the Extension Execution Controller on every host.
Next, use any compatible StatsD client and configure it to send its data to localhost:18125 either via UDP or TCP. Note that DynatraceStatsD only accepts local traffic and rejects any data that comes from non-localhost clients. Thus, the port isn't open to the outside, which increases the security of the StatsD data.
Seeing is believing
If you're new to Dynatrace, be sure to sign up for the Dynatrace free trial. If you're already a Dynatrace customer, sign in to your account and experience how you can get the most value out of your StatsD investment.
What’s next
StatsD is great, whether or not you already use it or if you want to leverage one of its 60+ libraries to get metrics into Dynatrace from your backing service or your applications. There are cases however where you either can’t or don’t want to use the StatsD library. One reason might be that StatsD doesn't support dimensions or tagging. To solve this, we've added a new line protocol-based HTTP API to Dynatrace OneAgent that supports multidimensional metrics. We'll explore this functionality in Part 2 of this blog series, so be sure to check back soon.


Looking for answers?
Start a new discussion or ask for help in our Q&A forum.
Go to forum