
Welcome back to the blog series where we provide you with deep dives into the latest observability awesomeness from Dynatrace, demonstrating how we bring scale, zero configuration, automatic AI driven alerting, and root cause analysis to all your custom metrics, including open source observability frameworks like StatsD, Telegraf, and Prometheus. In Part 1 we explored how you can use the Davis® AI to analyze your StatsD metrics.
In part 2, we’ll show you how you can run multidimensional analysis from external metrics that are ingested via the OneAgent metric API.
Metrics ingestion in large environments can be challenging
As an application owner, you might want to ingest performance or business metrics into Dynatrace from various sources and take advantage of the full power of Davis AI topology-aware anomaly detection and alerting. For example, you might want to define metrics that show the number of shopping carts, their dollar value, the number of items in those carts and a dimension that indicates whether the cart is active, abandoned, or purchased. This will allow you to monitor your application based on business metrics and trigger an alert if those metrics deviate from what’s normal for you app.
The Dynatrace Metric API endpoint has long enabled you to ingest individual metrics for the implementation of external use-cases. To achieve this, you can either use pre-existing metric frameworks and exporters created by Dynatrace, like our OpenTelemetry metric exporters, or your can write your own metric integration with our Metric API.
In large environments however, such configurations can be challenging. You might have hundreds of applications on hundreds of hosts behind firewalls—all of them need to be able to talk to the metric endpoint. Additionally, you might need to take care of tokens. This is where our new OneAgent metric API comes into play.
Multidimensional analysis for external metrics ingested via the OneAgent metric API
To solve this, we’ve made the same Metric API available for OneAgent. The OneAgent metric API is the same line protocol-based REST interface, made available on OneAgent to support multidimensional metrics that additionally take full advantage of Dynatrace Smartscape.
When you send metrics via the OneAgent metric API, the relevant host is automatically added to the metrics as a dimension. As this is HTTPS based you can use it from anywhere and everywhere on that host. Having this as a component of OneAgent means that you don’t need to worry about scale, encryption, firewalls, tokens, or indeed even where metrics should be sent—OneAgent takes care of all of this. To ensure security, this API only accepts local requests, ensuring that only authorized applications have access.
This makes this API great for use in metric frameworks such as Spring Micrometer, Dropwizard, OpenTelemetry metrics, or other monitoring solutions, like Telegraf. In the spirit of “drinking our own champagne” we’re doing this ourselves. Our recently published OpenTelemetry metric exporters use this exact interface.
Let’s explore how this works.
Ingest your external metrics via a local secure HTTPS-based REST API
The Dynatrace OneAgent metric API listens on default port 14499 and can be reached atlocalhost:14499/ingest/metric. The protocol is a simple line protocol, the exact same protocol that we used in the dynatrace_ingest example.
<metric name>,<Dimension1>=<value>,<Dimension2>=<value> <metric value>
If you send metrics via the OneAgent HTTPS API, an additional dimension dt.entity.host representing the Host-ID is automatically added along with any custom defined dimensions.
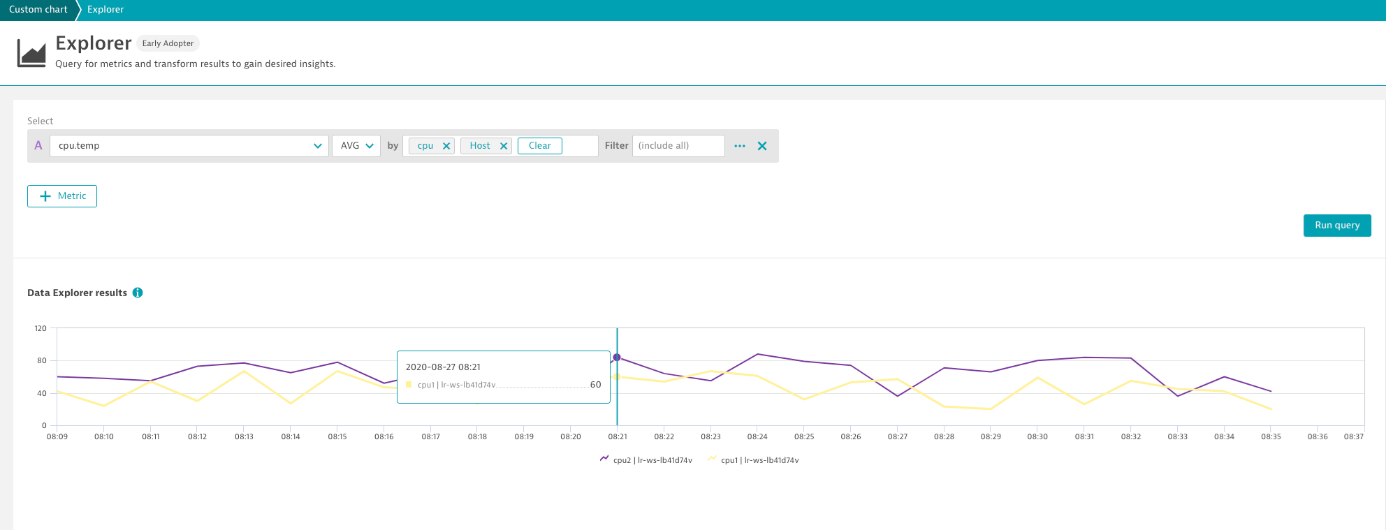
Example use case: Report CPU temperature per CPU and add CPU type information
In the example below we’ll report CPU temperature per CPU and add information about the CPU type. The line protocol supports multiple ingest lines per HTTPS request, so we can pack multiple sensors into the HTTPS payload:
cpu.temp,cpu=cpu1,cpu_type=INTEL <value>
cpu.temp,cpu=cpu2,cpu_type=INTEL <value>
Because we send the metrics via the OneAgent metric API, the host is automatically added as a metric dimension (for example, to split chart metrics by host and CPU).
Once you have OneAgent installed, this interface is only reachable on localhost under its designated port. The interface rejects any traffic that doesn’t originate from localhost. Like StatsD, this can be used from any language and, in many cases, HTTPS is better suited than UDP itself.
We’ll use this in the future to build integrations for Micrometer, Dropwizard, and others. We hope that others will follow our lead in adding Dynatrace support to popular and valuable open-source solutions.
How to get started
Ensure that OneAgent version 1.201+ is installed on the VM or host that you want to monitor. Enable the OneAgent metric API at the environment or host level and, if necessary, modify the default metric ingestion port. For details, see OneAgent metric API in Dynatrace Help.
New to Dynatrace? Try it out by starting your free trial today.
What’s next
StatsD and HTTPS are both well suited for integrations into applications or existing backend services. But what if you want to send metrics from a bash script, a Cronjob, or Powershell? You can of course use HTTPS, but we have a much easier way for you to do this. Stay tuned for Part 3 where we’ll show you how.


Looking for answers?
Start a new discussion or ask for help in our Q&A forum.
Go to forum