
Dynatrace debuts unified services with automatic OpenTelemetry endpoint detection and OpenTelemetry services analysis on the path to expanding observability and analytics capabilities.
Great news: OpenTelemetry endpoint detection, analyzing OpenTelemetry services, and visualizing Istio service mesh metrics just got easier. With the launch of unified services for OpenTelemetry, Dynatrace enables teams to analyze multiple aspects of OpenTelemetry services in a single view.
Here’s more about unified services and how the capability enhances OpenTelemetry observability.
Why Dynatrace is the best way to analyze OpenTelemetry services
OpenTelemetry is growing in popularity as a way for organizations to standardize observability instrumentation for all their services, languages, and frameworks. As a CNCF open source incubating project, OpenTelemetry provides a standardized set of APIs, libraries, agents, instrumentation, and specifications for logging, metrics, and tracing.
With more than 1,106 companies and 9,168 individuals contributing to OpenTelemetry since the project’s inception in 2019 and with adoption growing worldwide, OpenTelemetry is a good solution for bridging gaps with business-specific instrumentation. OpenTelemetry is also useful for getting a handle on all the third-party libraries and services an organization uses.
But while OpenTelemetry solves the problem of standardizing data instrumentation, the complexity and scale of cloud-native tools and environments mean that organizations still struggle with OpenTelemetry service observability.
Specifically, teams must jump from tool to tool and page to page to extract the benefits of all the signals OpenTelemetry collects. This context switching makes it hard for teams to effectively connect the dots when it comes to integrating the service-specific insights with surrounding architecture components such as service-mesh data. Moreover, the number of services in an enterprise’s portfolio makes it impractical to manually configure and adapt alerting for the tens of thousands of service endpoints teams need to monitor.
The new unified services type for OpenTelemetry solves these issues and more by auto-baselining and detecting all of a service’s endpoints, then bringing all logs, metrics, traces, and service-mesh data into a single unified, contextualized view.
A unified platform approach also makes OpenTelemetry data available to more teams across the organization for more diversified analysis.
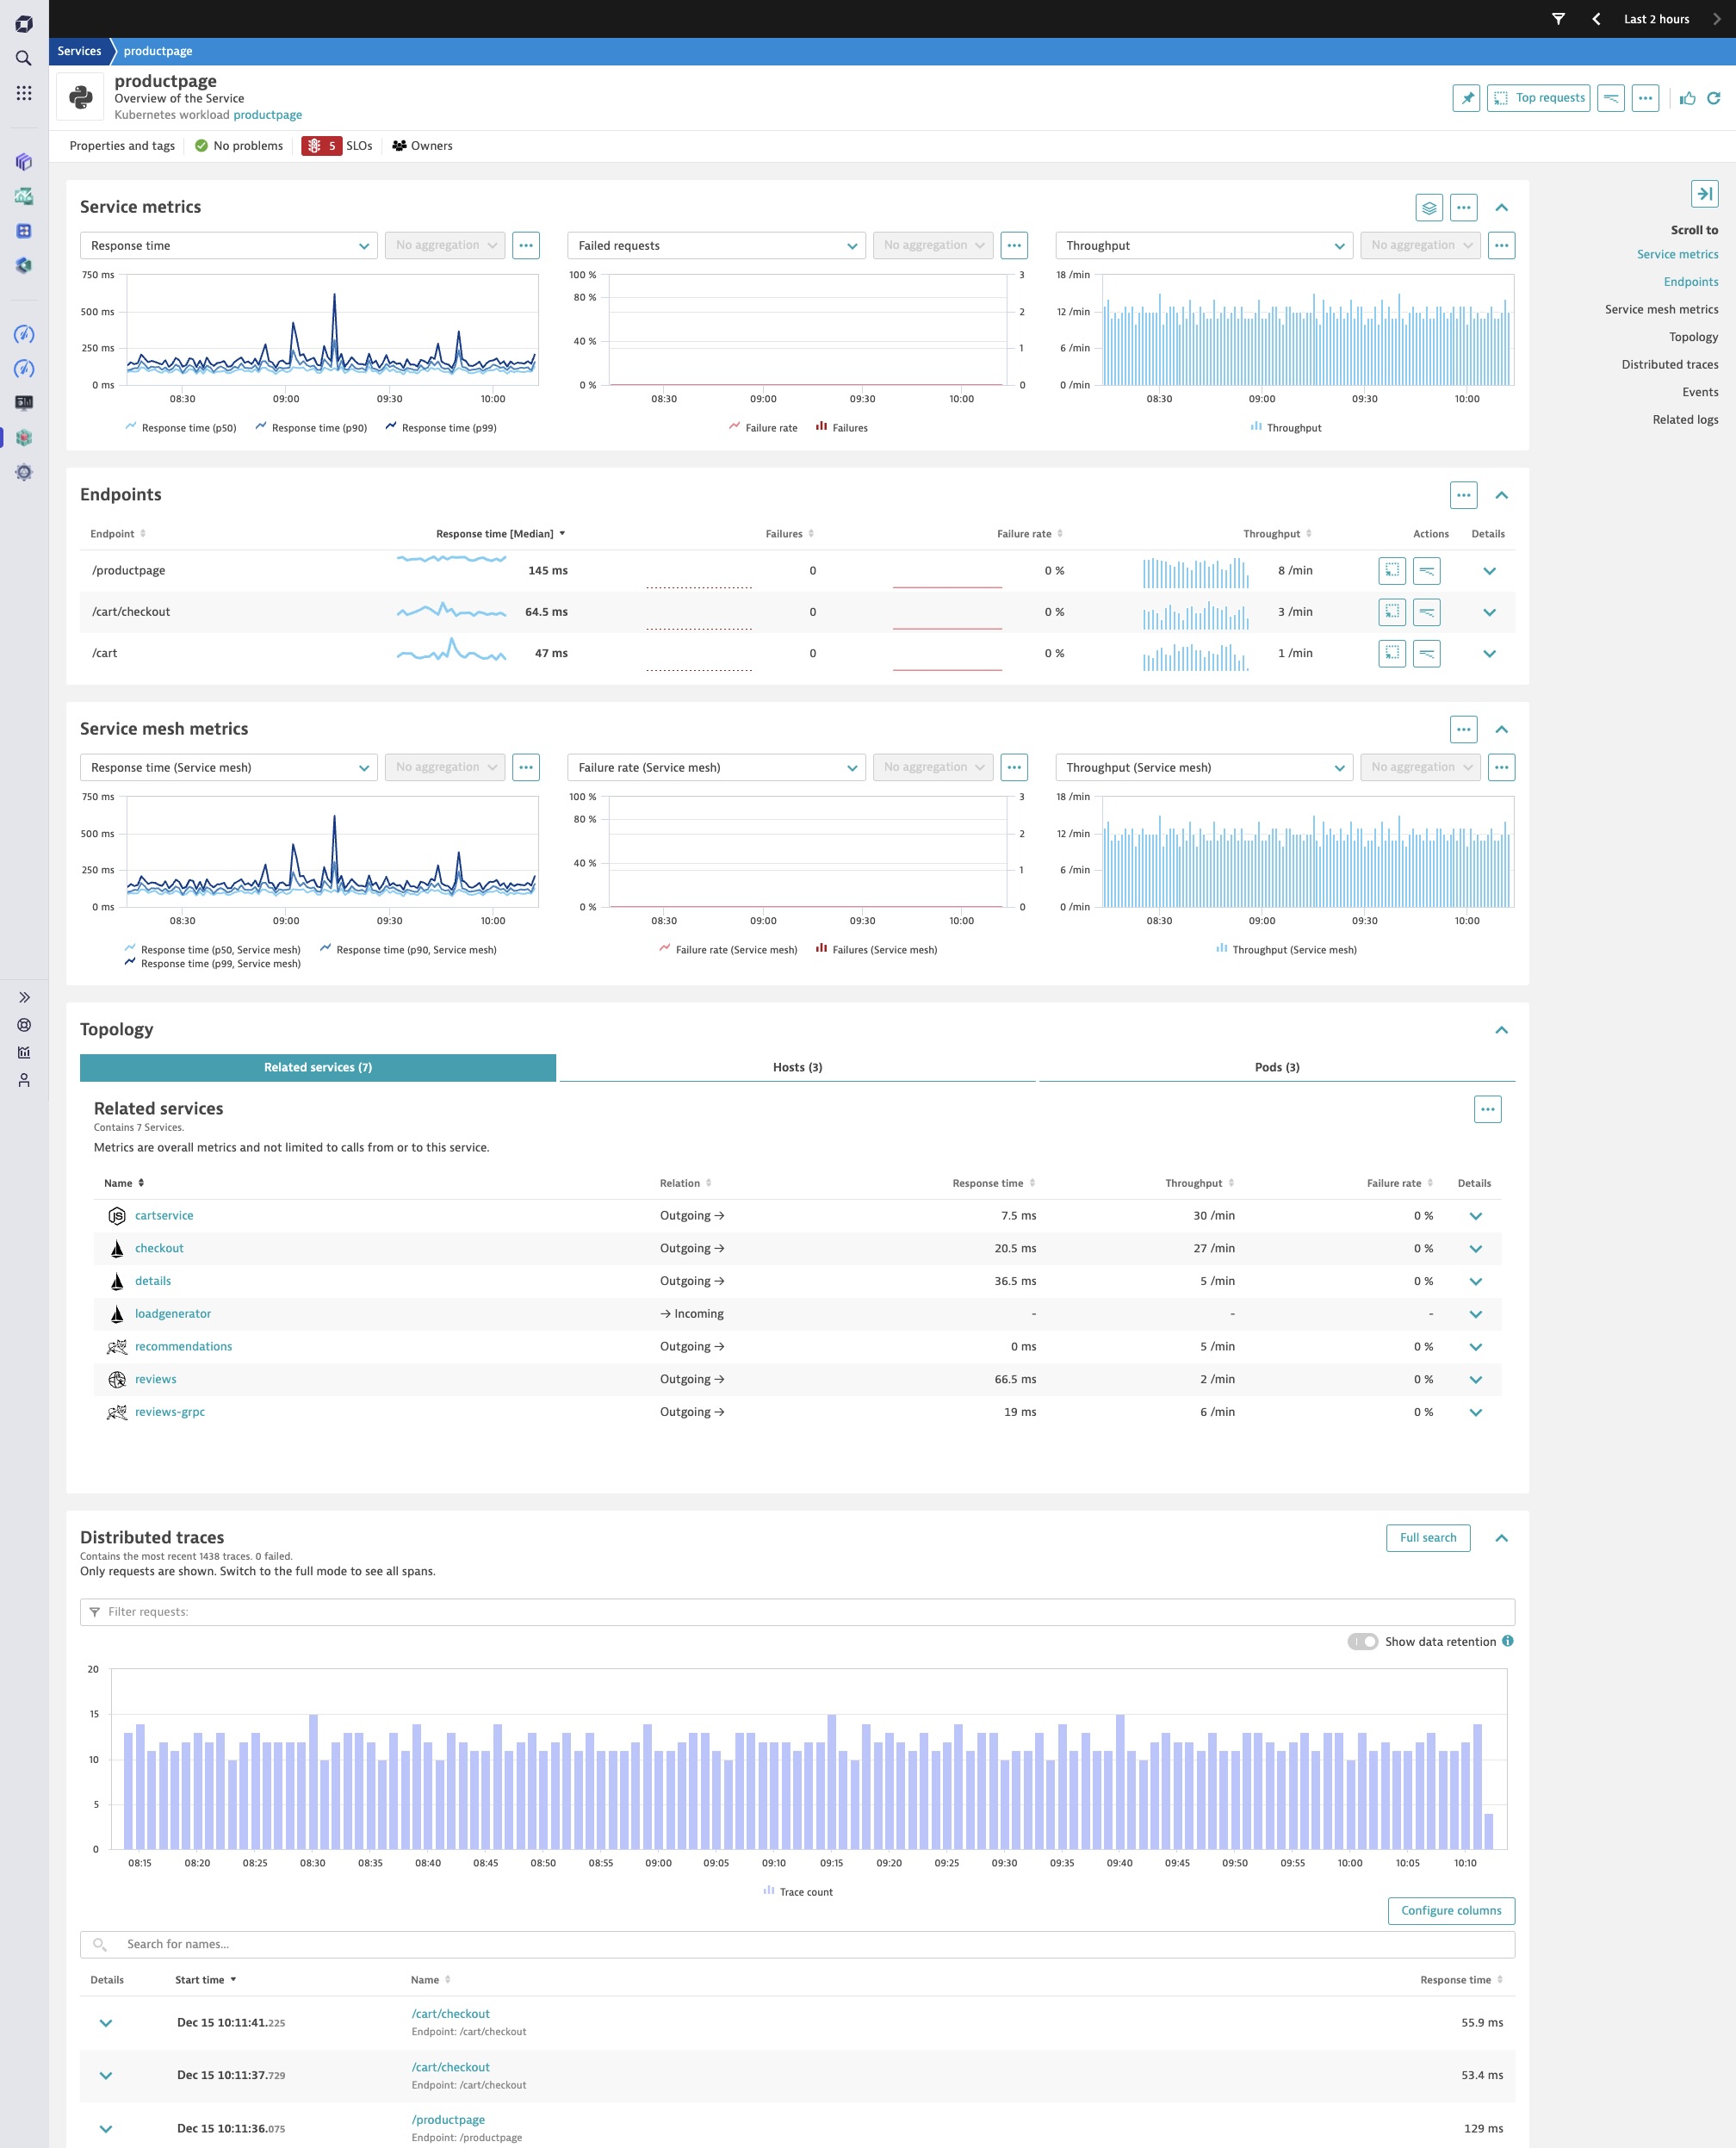
Let’s highlight two major improvements provided by the Dynatrace Opentelemetry unified services view: Endpoint detection and in-context Istio service mesh metrics.
Unified services enable automatic OpenTelemetry endpoint detection
With unified services, Dynatrace detects the different endpoints of a service and automatically baselines and triggers Davis AI anomaly detection for the detected endpoints.
“This is important because different endpoints expose different functionality of a service,” says Arlindo Lima, product manager at Dynatrace. “[The endpoints] might have different SLAs (service level agreements) or completely different performance characteristics.”
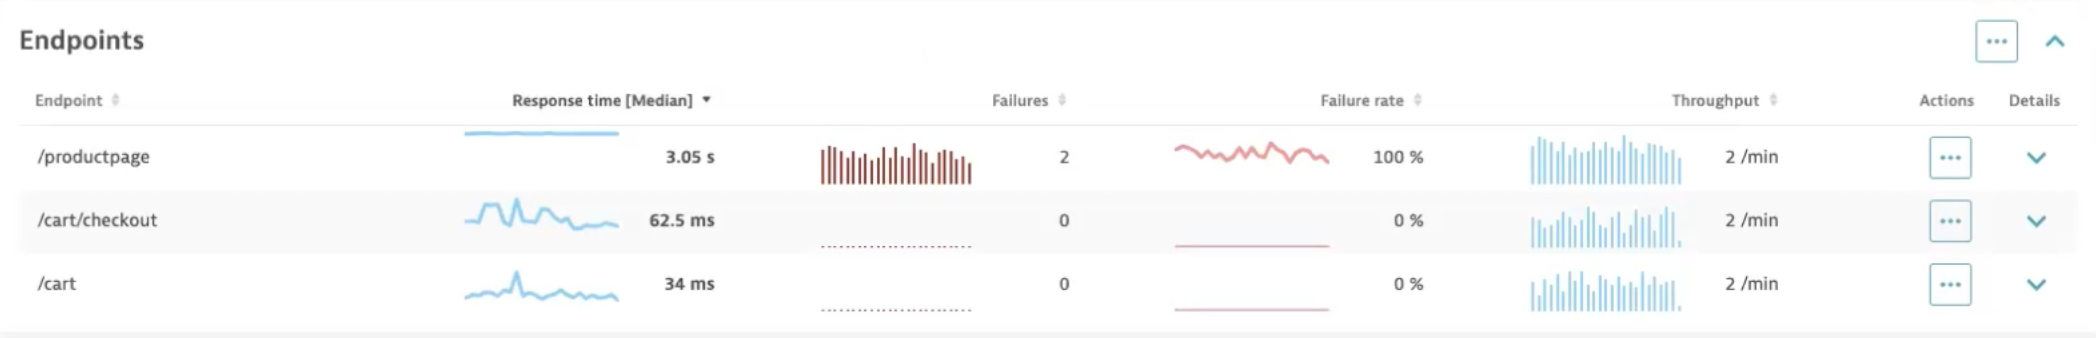
For example, one endpoint might be more heavily used than others, and therefore more likely to experience failure. “Not monitoring endpoints separately can mask issues and make it more difficult to identify the root cause of problems,” Lima says. By automatically detecting these OpenTelemetry endpoints, Davis AI adds the endpoints to its service list for analysis and alerting with no additional setup or configuration required.
“The automated Davis AI baselining capabilities can now alert teams when their endpoints degrade, which accelerates resolution time,” Lima continues. “With one click, Davis analyzes thousands of signals, taking into consideration the domain and topology knowledge, and surfaces all the anomalies detected from the selected endpoint.”
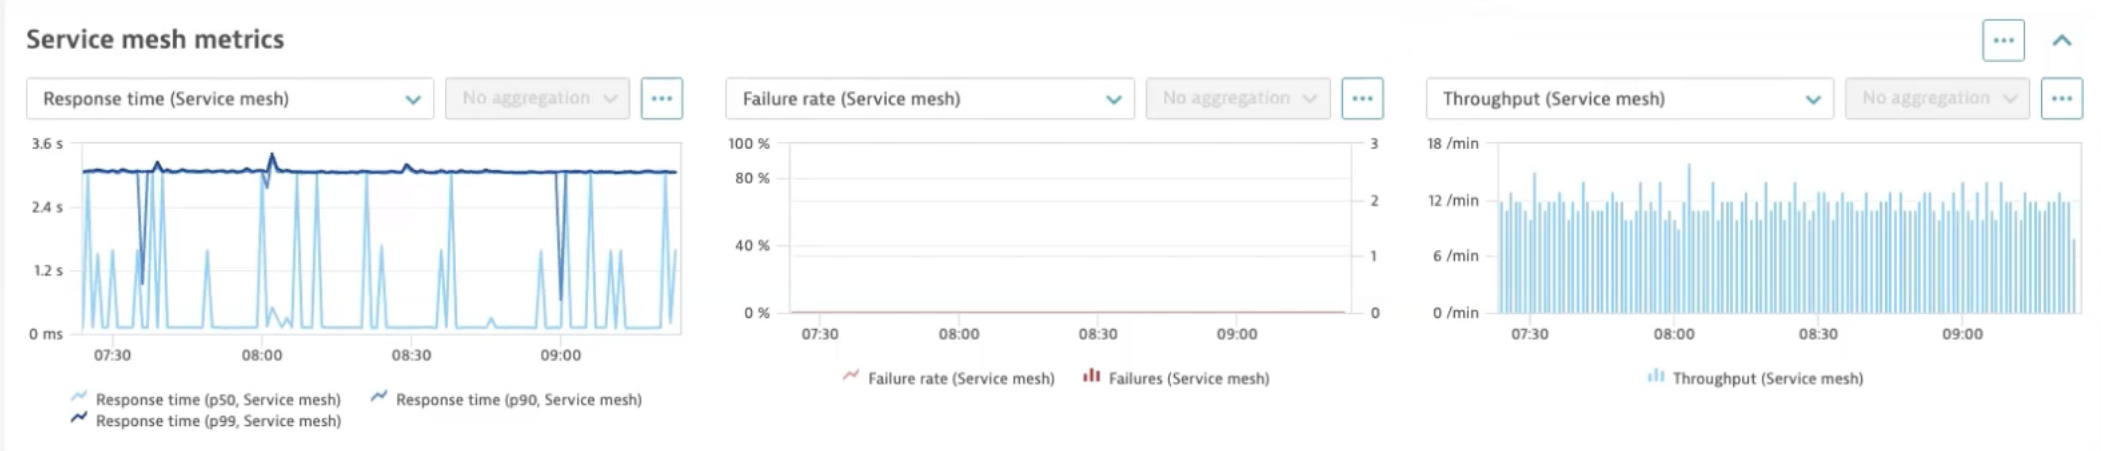
Unified services include Istio service mesh metrics ingested from OpenTelemetry spans
With unified services, keeping track of service mesh metrics from Istio Envoy proxies just got easier, too.
Service meshes are a dedicated infrastructure layer added on top of an application that abstracts service-to-service communication using a proxy, often deployed as a sidecar, which runs alongside each service.
“When Dynatrace receives OpenTelemetry line protocol spans from Istio’s Envoy proxies, Dynatrace now automatically shows the performance of the proxy directly on the service screen,” Lima says. This detail from Istio service mesh is available using APIs now and will soon be available directly from OneAgent.
Having instant access to these granular performance metrics of Istio Envoy proxies provides teams with the following advantages:
- Immediately see if the proxy is causing any significant performance overhead
- Understand if requests are being blocked or not proxied to the actual microservice
- Identify any deviating failure rates that indicate problems
- Better understand how the service mesh layer is affecting overall service performance
Benefits of unified services and how to get them
With automatic OpenTelemetry endpoint detection and baselining, Davis causal AI can now operate on OpenTelemetry endpoints to give teams immediate, granular visibility into endpoint performance. The unified services view makes it easier for teams to track service calls, traces, logging, and events in context.
What’s more, the new service type simplifies the service and endpoint detection rules Dynatrace uses to detect new services and services endpoints, and makes them more transparent.
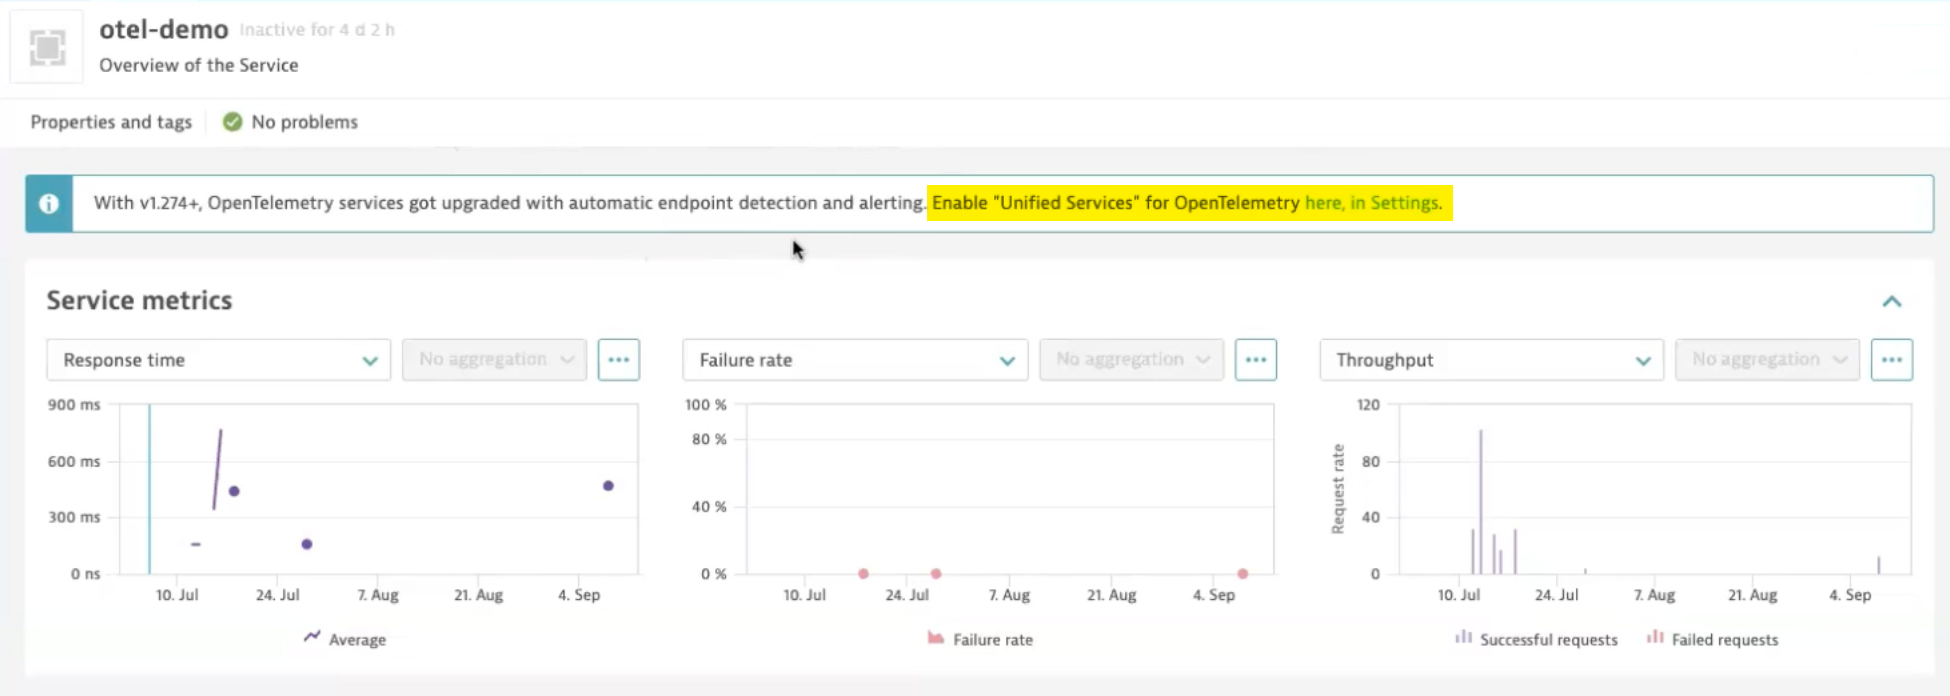
New Dynatrace customers already have these features enabled by default. Existing customers can activate the unified services view by following the link in the banner to Dynatrace settings.
Dynatrace OneAgent + OpenTelemetry: Bringing all your telemetry data under one roof
Once you start enjoying the benefits of using the Dynatrace unified service for OpenTelemetry analysis, it makes sense to get all your telemetry data under one roof.
Dynatrace OneAgent, the Dynatrace platform’s native telemetry data collector, can auto-instrument applications and infrastructure that are not already defined by OpenTelemetry. This means you can use OpenTelemetry to define traces for custom or specialty apps and let Dynatrace auto-instrument the rest of your cloud-native environment. OneAgent works out of the box with OpenTelemetry and automatically detects application traces and metrics, bringing data from the entire technology stack into a single analytics platform.
Put simply, Dynatrace extends OpenTelemetry observability, and OpenTelemetry extends Dynatrace observability.
Stay tuned for more improvements of OpenTelemetry and OneAgent analysis with the Grail data lakehouse.
________________________________
Many thanks to Arlindo Lima and Matthew Reider for contributing to this article.


Looking for answers?
Start a new discussion or ask for help in our Q&A forum.
Go to forum