
Complex information systems fail in unexpected ways. That’s why IT teams need both observability tools and an observability platform. To understand the distinction between observability tools and an observability platform, let’s start with some definitions.
What is observability?
Observability gives developers and system operators real-time awareness of a highly distributed system’s current state based on the data it generates. With observability, teams can understand what part of a system is performing poorly and how to correct the problem.
Observability is made up of three key pillars: metrics, logs, and traces.
- Metrics are measures of critical system values, such as CPU utilization or average write latency to persistent storage.
- Logs are files that record events in a system, such as the start of a subprocess or the trapping of an error.
- Traces provide performance data about tasks that are performed by invoking a series of services. They’re particularly important in distributed systems, such as microservices architectures.
Each is useful alone, but integrating all three in context gives you a more comprehensive view of a system’s state. This real-time visibility creates situational awareness and opens the door for IT use cases ranging from DevSecOps to digital experience management.
Teams gain observability from telemetry data sent by endpoints across the environment using instrumentation from a wide variety of tools.
Observability platform vs observability tools: What’s the difference?
Observability tools, such as metrics monitoring, log viewers, and tracing applications, are relatively small in scope. Teams can use them independently to gain insights into single components of larger systems. Unfortunately, they often don’t communicate with each other or offer a single source of truth. This means the teams relying on these tools—teams that should be working together—must make decisions with incomplete data. With limited visibility, teams have a narrow understanding of how those decisions impact other software components and vice-versa.
A platform approach, on the other hand, presents a more effective option for understanding observability as a whole.
What is an observability platform?
An observability platform is a comprehensive toolset designed to provide IT professionals with deep visibility into the performance, health, and behavior of complex systems and applications. Unlike traditional monitoring tools that only track predefined metrics, an observability platform enables you to explore and diagnose unexpected issues across your entire system.
Key features of an observability platform
Log management: Aggregates, processes, and analyzes system logs to identify anomalies and patterns.
Metrics monitoring: Tracks system-wide metrics, such as CPU usage or memory consumption, providing a quantitative view of performance.
Distributed tracing: Captures end-to-end visibility of user requests across services to pinpoint bottlenecks and latency issues.
Dashboards and visualizations: Presents system data in easily digestible charts, graphs, and heatmaps, allowing for quick assessments.
Anomaly detection powered by AI/ML: Utilizes advanced algorithms to identify irregularities in real time and predict potential issues.
By correlating logs, metrics, and traces, observability platforms empower teams to efficiently identify the root causes of issues, reduce downtime, and maintain optimal application performance.
Ultimately, an observability platform isn’t just about monitoring; it’s about gaining actionable insights that help IT professionals make informed decisions to ensure system reliability and scalability. An observability platform that also integrates user experience data and business context into these capabilities provides a real-time advantage that helps teams respond faster and get more done.
The case for an integrated observability platform
As applications have become more complex, observability tools have adapted to meet the needs of developers and DevOps teams. For example, in 2005, Dynatrace introduced a distributed tracing tool that allowed developers to implement local tracing and debugging. This was sufficient for monolithic applications, which were common at the time. But by 2015, it was more common to split up monolithic applications into distributed systems. The key driver behind this change in architecture was the need to release better software faster.
The shift to multicloud microservice-based architectures introduced an unintended but inevitable consequence: operational complexity. Today, developers face the challenge of understanding what happens within a system comprising hundreds or thousands of interdependent services. Observability tools that provide local tracing and debugging are no longer sufficient for either operations or development teams.
Observability platforms provide root-cause analysis
Operations teams need broad, system-wide views and focused, drill-down views into services. This visibility ensures systems function as expected and helps teams understand the conditions that cause a system failure. For example, if the average response time for a service is increasing, the operations team needs to understand the cause. It could be due to a spike in load on the service, which increases system response time.
Adding more compute resources to an application cluster could address the problem, but load spikes are only one possible cause. A database could start executing a storage management process that consumes database server resources. In this case, the best option may be to stop the process and execute it when the system load is low. The key is knowing what is the root cause of the performance issue. This is where an observability platform approach becomes a real advantage.
Observability platforms provide context
The shift to multicloud has increased complexity further, driving the need for an observability platform that can provide visibility into the operational details of distributed systems.
A microscopic view of systems is also particularly valuable to developers. Debugging can require access to low-level details about how an operation works and how it may be causing problems for a downstream service.
For example, an operation may fail 2% of the time it is performed. Developers need to know what distinguished those 2% instances from the 98% that succeed. It could be differences in inputs, such as malformed inputs from another service. It could also be a bug on an infrequently executed logic path in the service.
OpenTelemetry and modern observability tools
Collecting data from observability tools is an important part of what an observability platform does. With the spread of DevOps and microservices, the vast array of possible data formats can be a nightmare for developers and SREs who are just trying to understand the health of an application.
The open-source observability framework, OpenTelemetry, provides a standard for adding observable instrumentation to cloud-native applications. OpenTelemetry provides a standardized method to instrument, generate, collect, and export telemetry data for analysts to understand software performance and behavior.
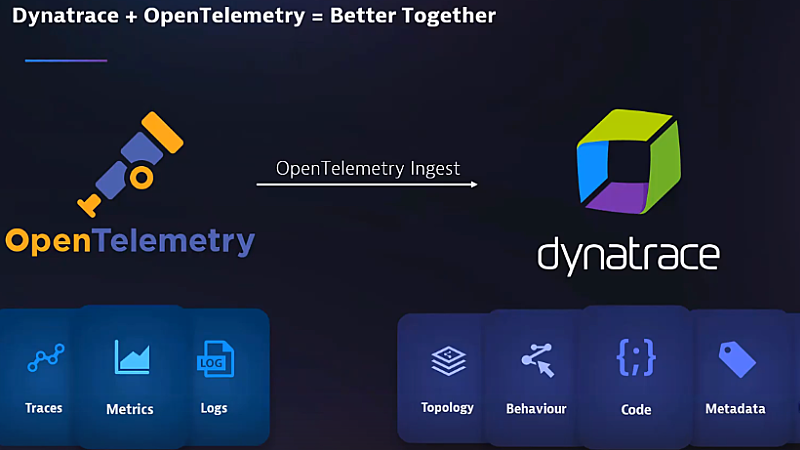
With unified data collection formats, libraries, and utility tooling, OpenTelemetry makes data more interchangeable and integrable. This streamlining simplifies how teams gather telemetry data, but to make sense of it, teams need a modern observability platform to store the data and to help generate actionable insights from the information.
Such a modern observability platform must also scale to ingest, analyze, and store the increasing volumes of metrics, logs, and trace data. It must provide analysis tools and artificial intelligence to sift through data to identify and integrate what’s most important. This approach helps developers and operations teams understand and act on the state of a complex system.
Observability tools and an observability platform: better together
For observability that scales with cloud-native technologies, organizations need an AI-driven observability platform like Dynatrace. Our distributed tracing technology powered by PurePath 4 automatically captures and analyzes transactions at every tier of an application stack. With no code changes, Dynatrace extends distributed tracing and code-level analysis to OpenTelemetry data, service mesh, and all data from your serverless computing services.
Capturing every process from start to finish and automatically providing insights enables fully integrated, no-silo collaboration across development, operations, and applications teams. PurePath end-to-end tracing contrasts tools that require manual instrumentation and user expertise to understand performance issues.
For development, operations, security, and SRE teams alike, Dynatrace brings automation and answers rather than just raw data in dashboards. To drive better business outcomes with automatic and intelligent analysis, integrate observability tools with an observability platform.
To learn more about how Dynatrace leverages OpenTelemetry to advance the state of the art in observability, join us today for the on-demand Power Demo, Leverage OpenTelemetry with Dynatrace for opensource tracing.


Looking for answers?
Start a new discussion or ask for help in our Q&A forum.
Go to forum