
UPDATE on June 20, 2022: Dynatrace supports IBM App Connect Enterprise. More details on our technology support for IBM App Connect Enterprise and IBM Integration Bus are on this help page.
As one of the most widely used enterprise integration solutions, IBM Integration Bus (IIB—formerly known as WebSphere Message Broker) allows easy connections between different kinds of enterprise applications and services. As it’s usually used to integrate different types of services, it’s important to have visibility into how the connections between these services perform. Especially when something goes wrong in such a complex system, it can be difficult to identify the root cause of the problem—is the issue an erroneous service, or a design error in the message flow between services? It’s important to have a unified perspective over all parts of the systems to be able to make the right decisions.
Automatic monitoring of your message flows running on IBM Integration Bus
With our newly added support for IIB, Dynatrace gives you an end-to-end perspective of all message flows that are triggered through a web request, web service, or an IBM MQ message—all simply by deploying OneAgent on your IIB nodes. When you restart the integration server instances, OneAgent begins monitoring them. But Dynatrace doesn’t just trace messages through your IIB instance to connect the dots between connected services. Davis®, Dynatrace’s built-in AI engine, uses these detected connections to make sense of your specific IIB landscape based on the service topology.
Make sense of your deployment topology
Dynatrace initially detects deployed IIB integration servers as dedicated processes. If they’re part of the same execution group, they’re considered a cluster setup with each IIB broker as its own instance. This allows Davis to understand your deployment topology not only at the service level but also at the infrastructure level.
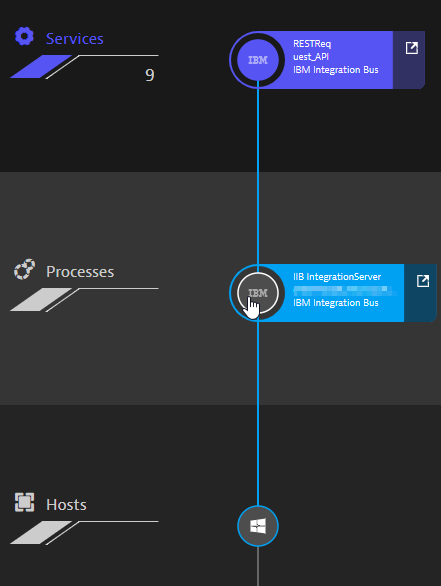
Dynatrace also detects and connects each IIB application as a dedicated service in Smartscape. And each message flow within these applications is recognized as a dedicated service method that is also analyzed by Davis out-of-the-box. In the screenshot below, you can see that the IIB application RESTRequest_API is running on the IIB integration server IntegrationServer.
Get AI-powered insights out-of-the-box
The auto-discovery of dependencies and connected services allows Davis to learn the behavior of the system. If Davis recognizes an anomaly, it uses the discovered topology to identify the root cause. This may be resource congestion in the underlying hardware, a slow or faulty connected service, or even suddenly occurring errors inside a message flow.
Understand the nitty-gritty details
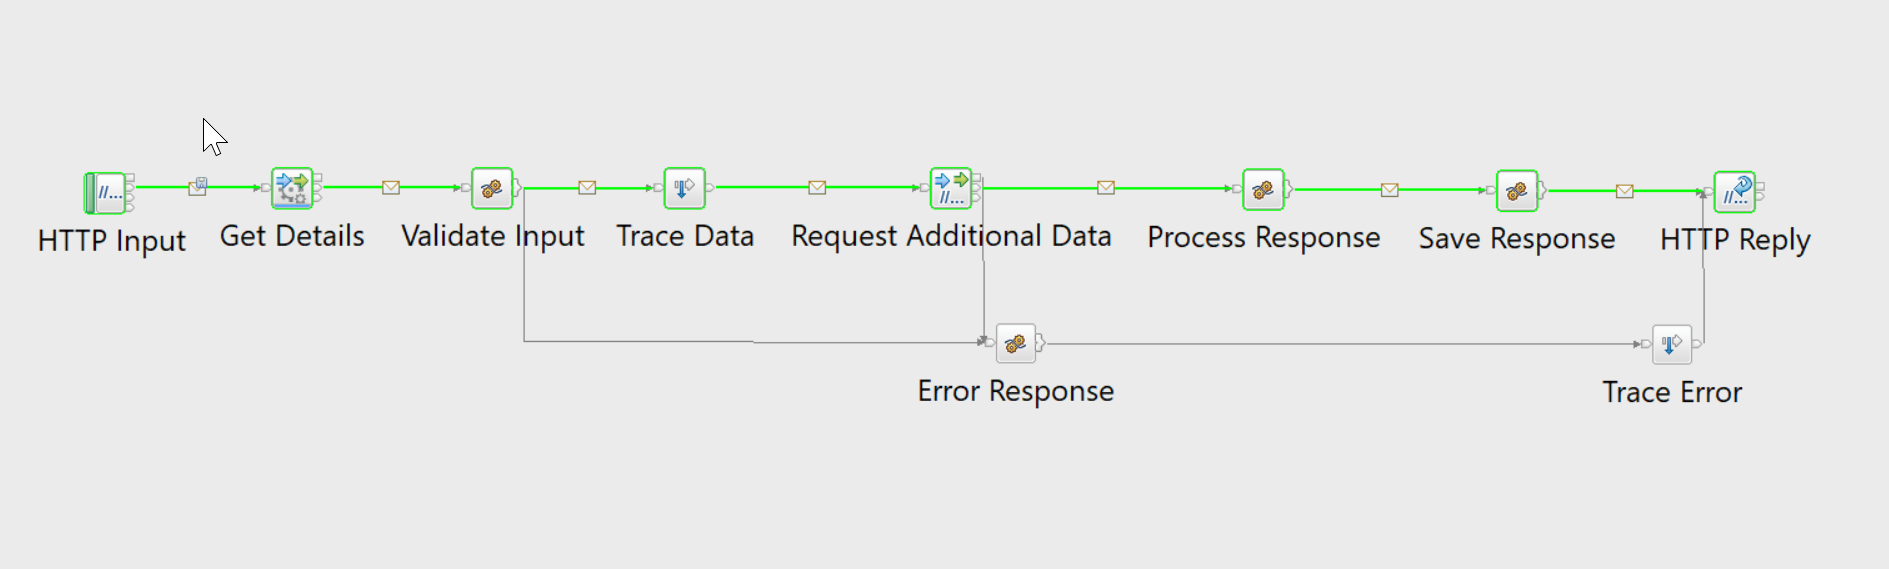
Dynatrace doesn’t just detect deployment topology out-of-the-box, it also monitors the message flows that are triggered by HTTP Requests, web services, or IBM MQ messages through the IIB message flows. The diagram below shows an example message flow, that originates with a WS Input (HTTP Input) and is connected with another message flow in the Get Details node. HTTP requests are made to an external Node.js application in the Request Additional Data node before a response is sent. Through all of this, the IIB performs internal computation and logging within some compute and trace nodes.
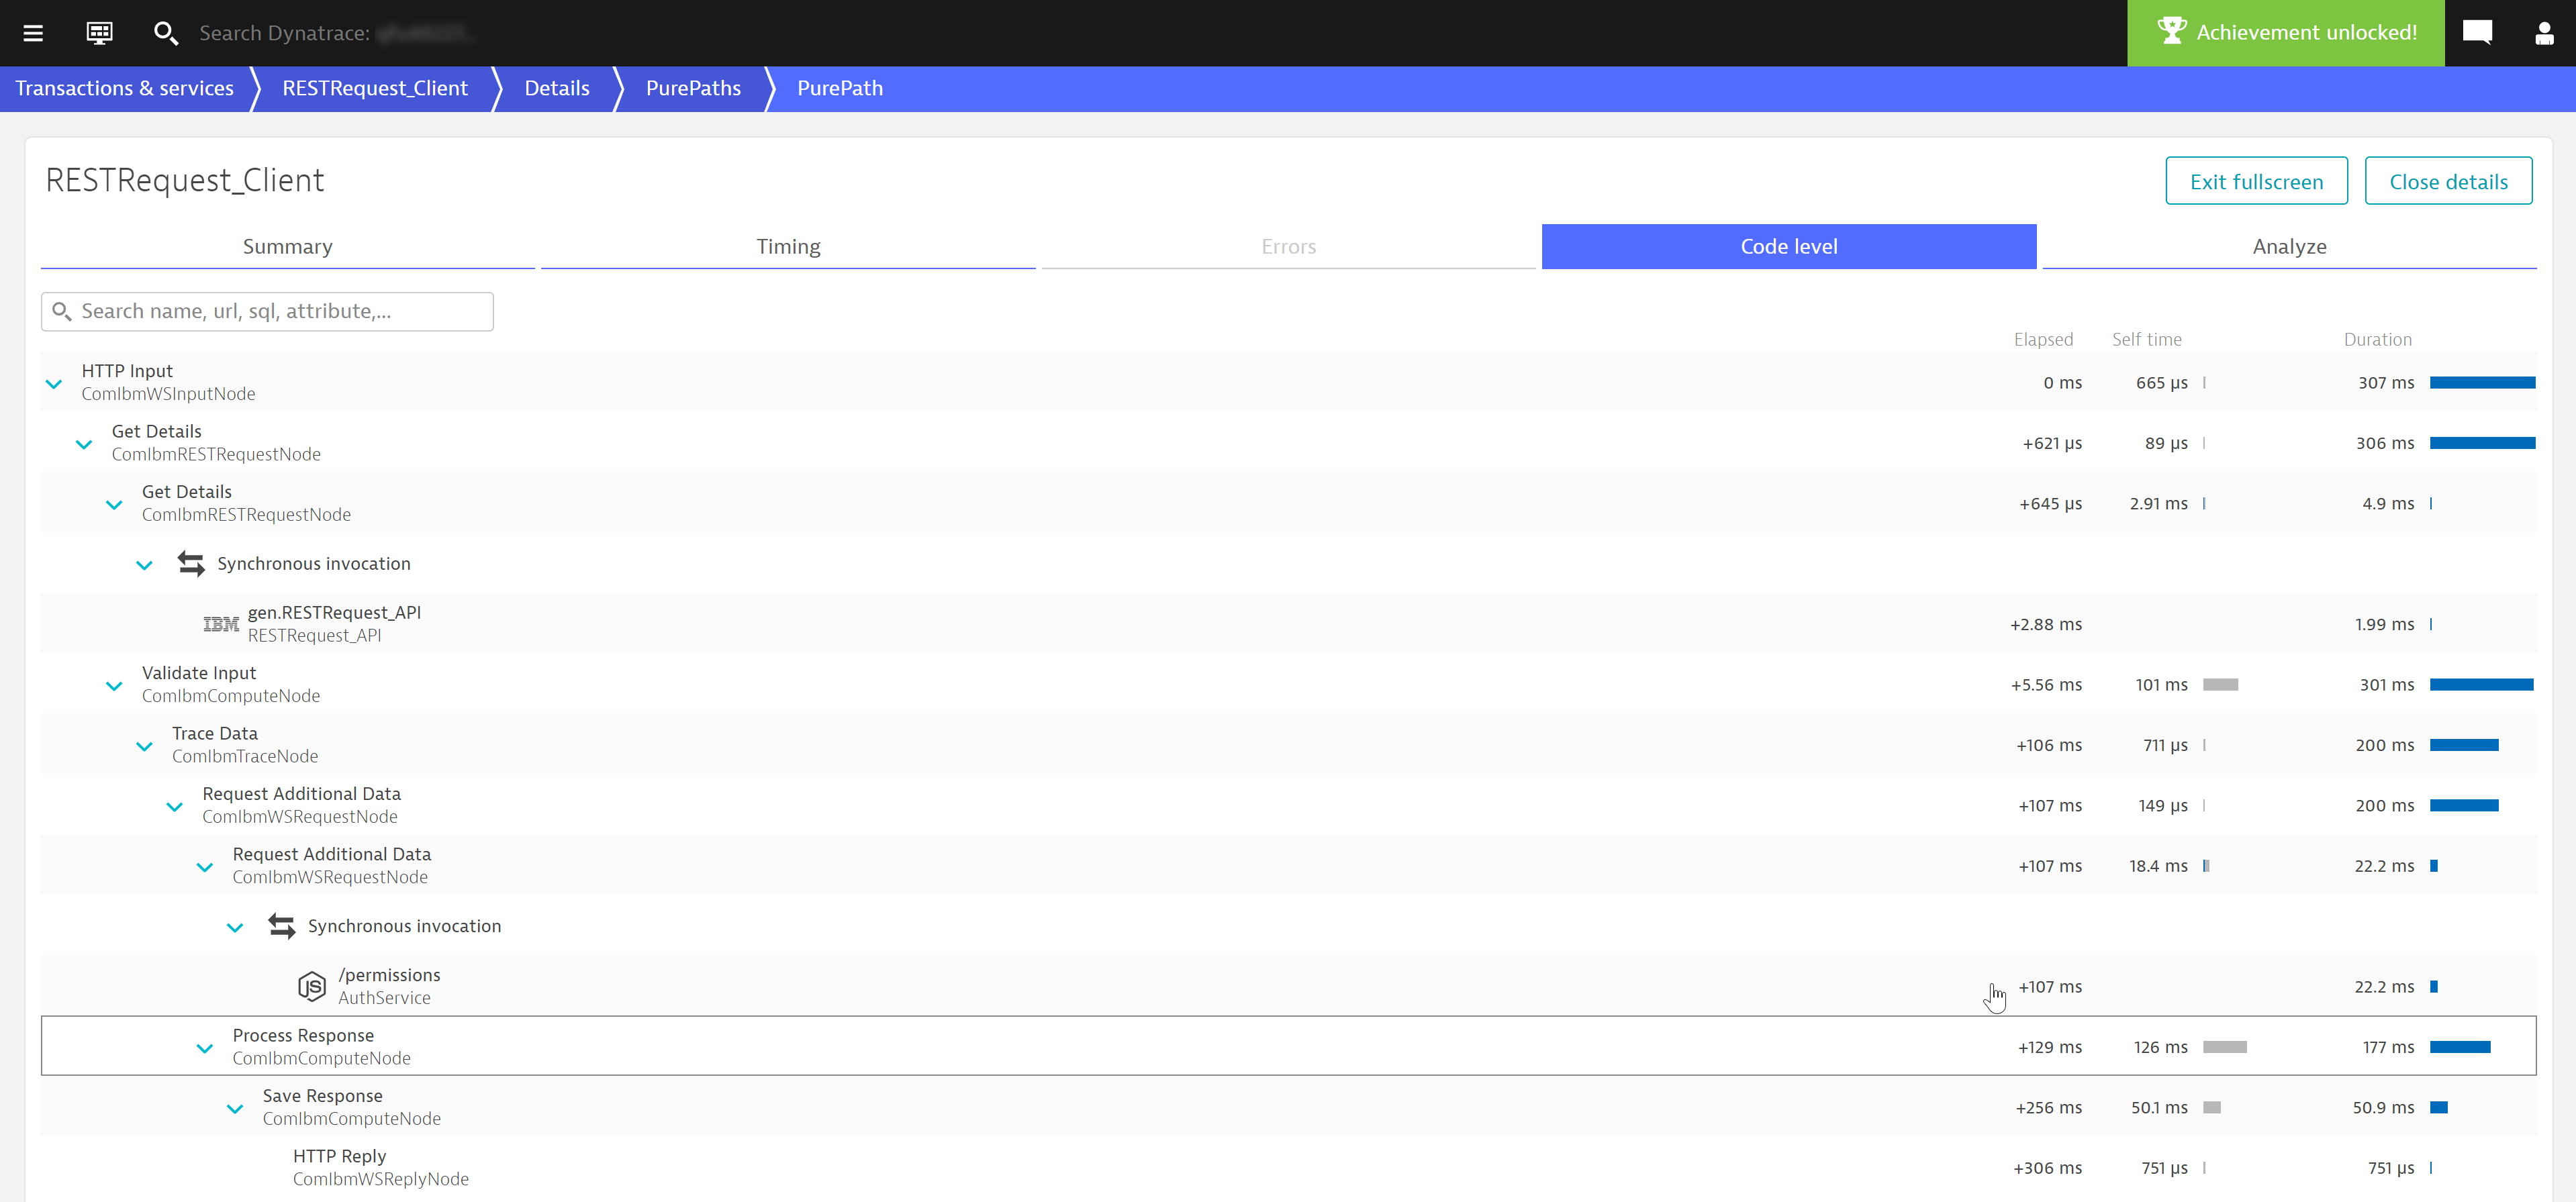
Dynatrace OneAgent follows the execution of your message flow instances as a PurePath so that it can be analyzed in detail. Calls to other services, like the call to RESTRequest_API or AuthService in Request Additional Data are also visible (see example below). In the PurePath, you can view the sequence and execution time of each node to find any bottlenecks and points of possible improvement. The calls to other services are automatically detected as dedicated service calls and are therefore also visible in the Smartscape and the Service flow views.
How to get started
To take advantage of this new feature:
- Ensure that OneAgent version 1.163+ is installed on all systems running IIB.
In case your IIB runs on AIX hosts, please follow the instructions in this Help page on how to install OneAgent. To activate deep monitoring please follow the “Monitoring a single application” setup in step 6. - Activate IIB Early Adopter Release support in the Dynatrace web UI (go to Settings > Monitoring > Monitored technologies).

- Restart all IIB integration server instances (DataFlowEngines).
- Trigger some message flows and watch the magic of Dynatrace in action!
Supported versions
- IBM Integration Bus support is available as an Early Adopter Release feature in Dynatrace SaaS or Dynatrace Managed versions 1.164.
- Support is currently available on Windows, Linux, and AIX.
- Dynatrace OneAgent version 1.163 or newer must be installed on the monitored systems.
- Dynatrace supports IBM Integration Bus versions 9 and 10.
- This feature relies on the previously announced end-to-end tracing for IBM MQ.
Start a free trial!
Dynatrace is free to use for 15 days! The trial stops automatically, no credit card is required. Just enter your email address, choose your cloud location and install our agent.


Looking for answers?
Start a new discussion or ask for help in our Q&A forum.
Go to forum