

Akka performance monitoring
Quickly find errors in your Akka applications
What is Akka?
Take a deep dive into your Akka application
In under five minutes the Dynatrace OneAgent automatically discovers your entire Akka application. Dynatrace monitors and analyzes the database activities of your Akka applications, providing you with visibility all the way down to individual SQL and NoSQL statements. Just a few of the performance metrics you will see on your Dynatrace dashboard:
- JVM metrics
- Custom JMX metrics
- Garbage collection metrics
- All database statements
- All requests
- Suspension rate
- All dependencies
Start monitoring your Akka apps in under 5 minutes!
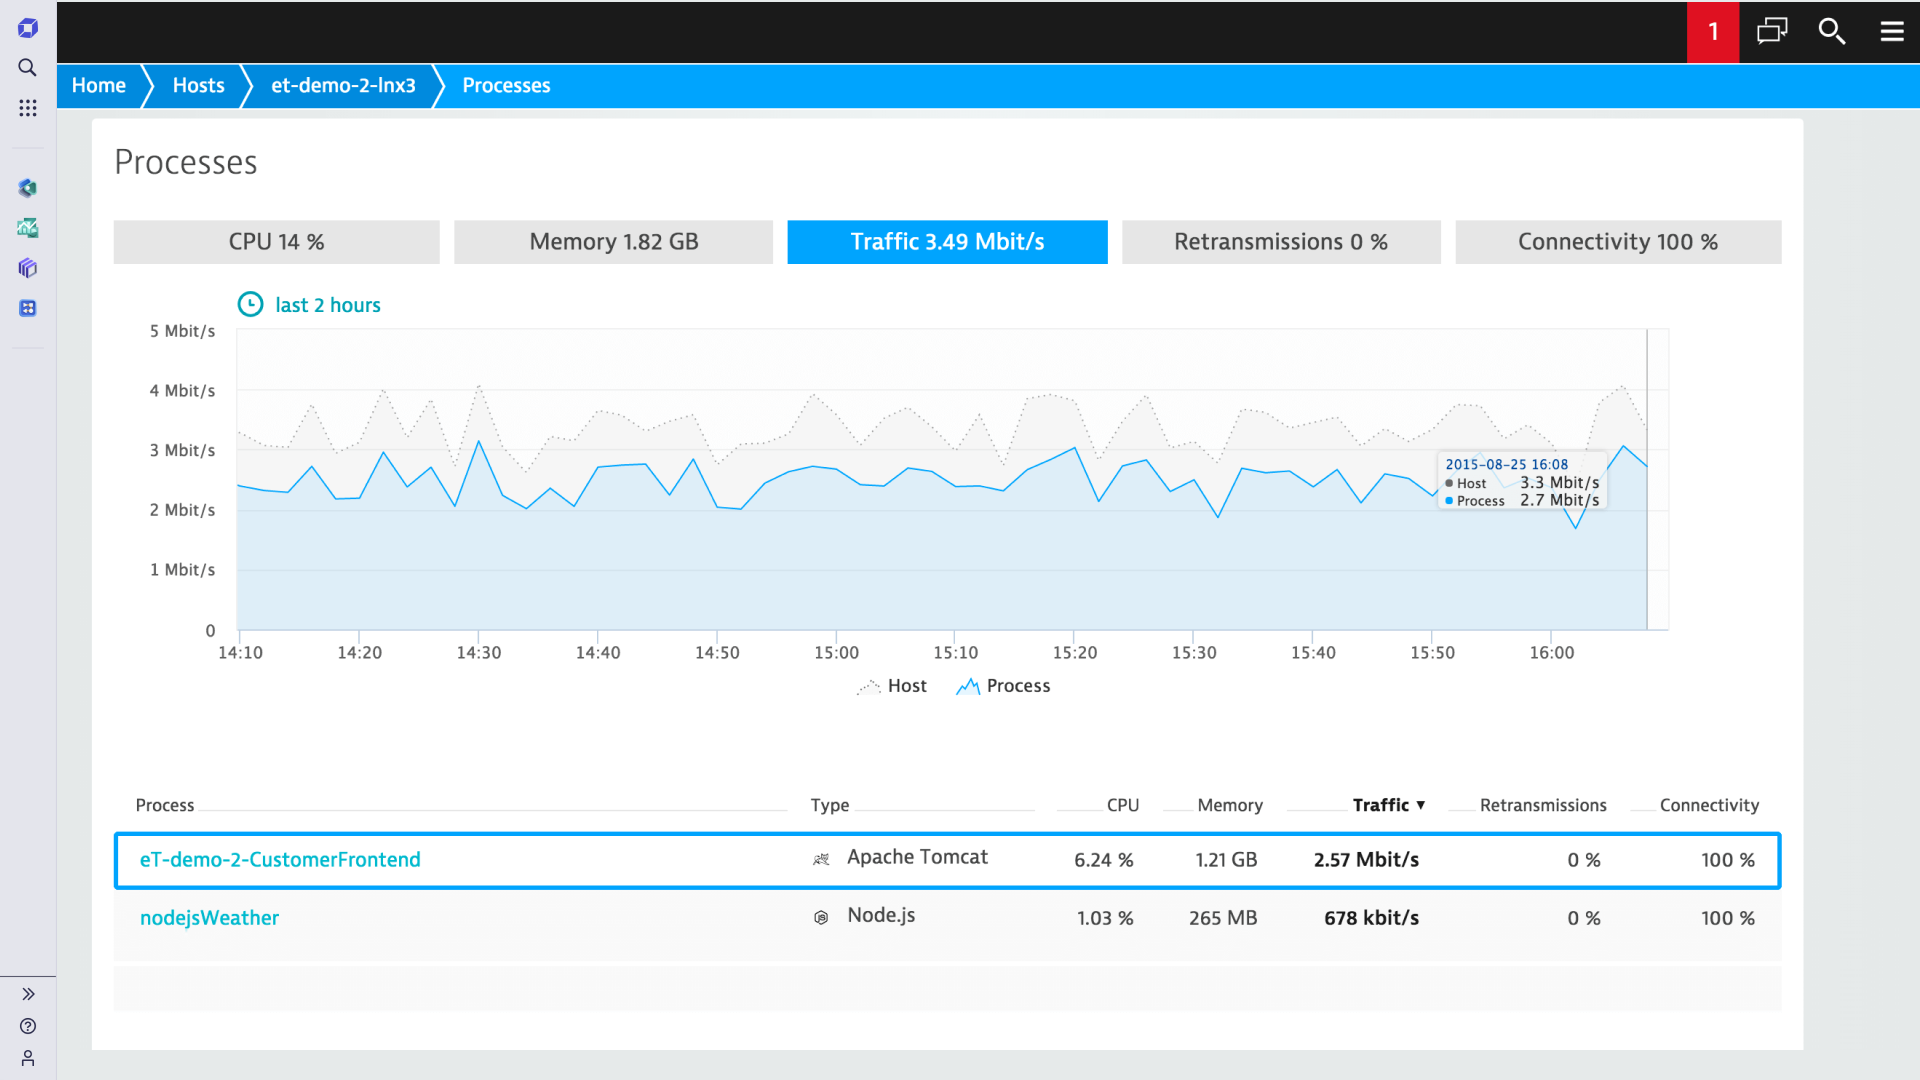
In under five minutes, Dynatrace shows you CPU, memory, and network health metrics all the way down to the process level.
- Manual configuration of your monitoring setup is no longer necessary.
- Auto-detection starts monitoring new virtual machines as they are deployed.
- Dynatrace is the only solution that shows you process-specific network metrics.
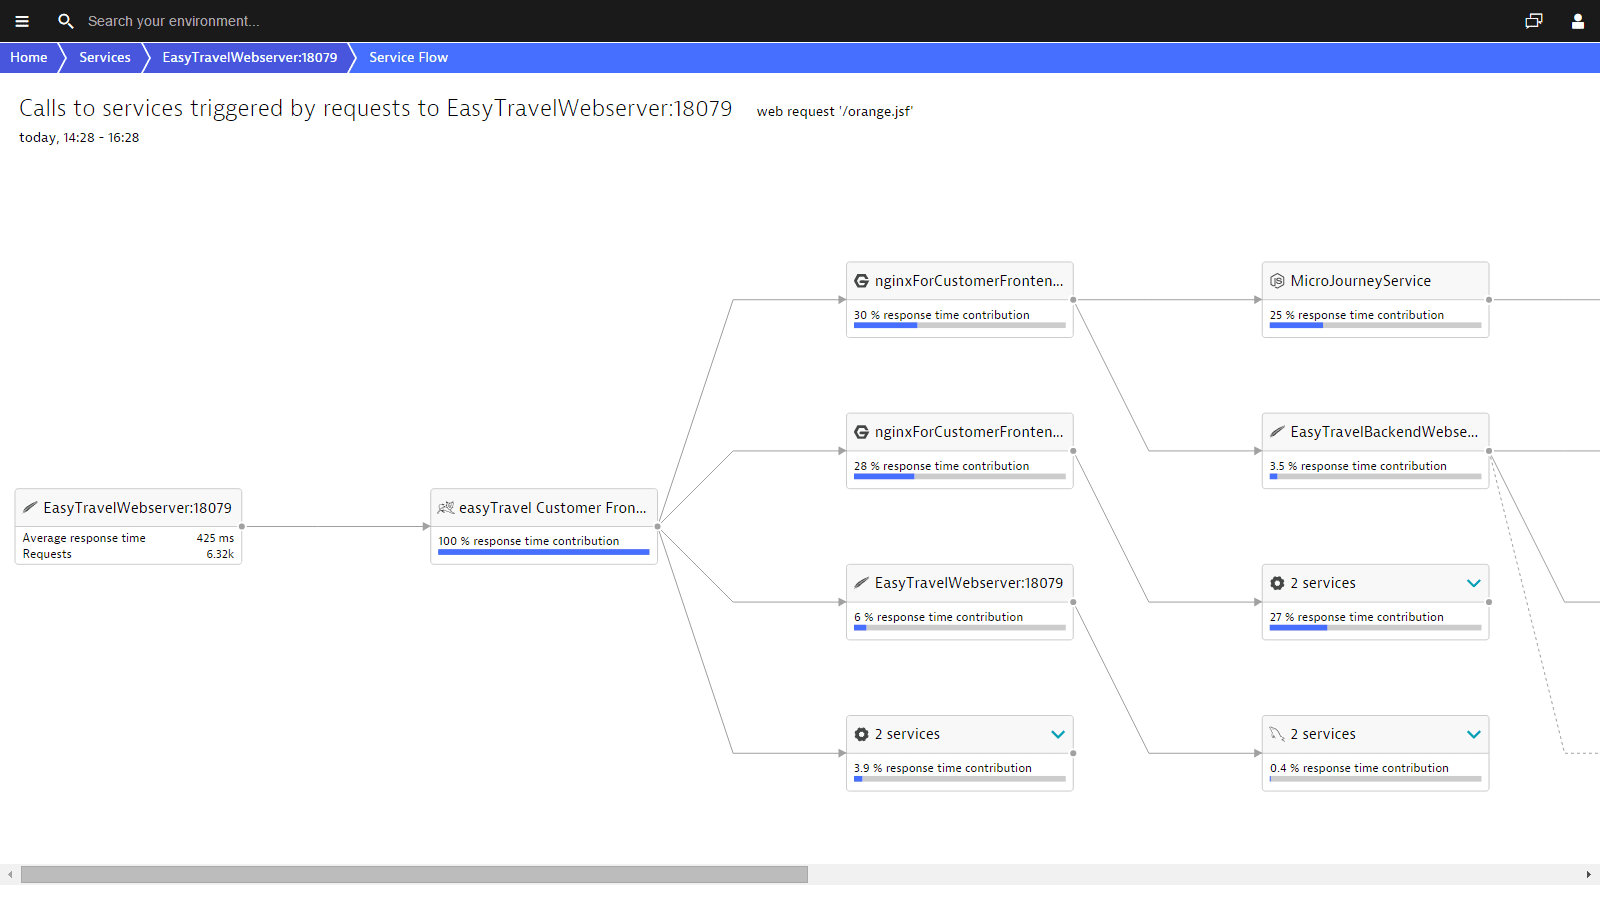
Visualize all service requests end-to-end in your Akka apps
Dynatrace understands your applications’ transactions from end-to-end. Service flow shows the actual execution of each individual service and service-request type. While Smartscape shows you your overall environment topology, Service flow provides you with the view point of a single service or service-request type.
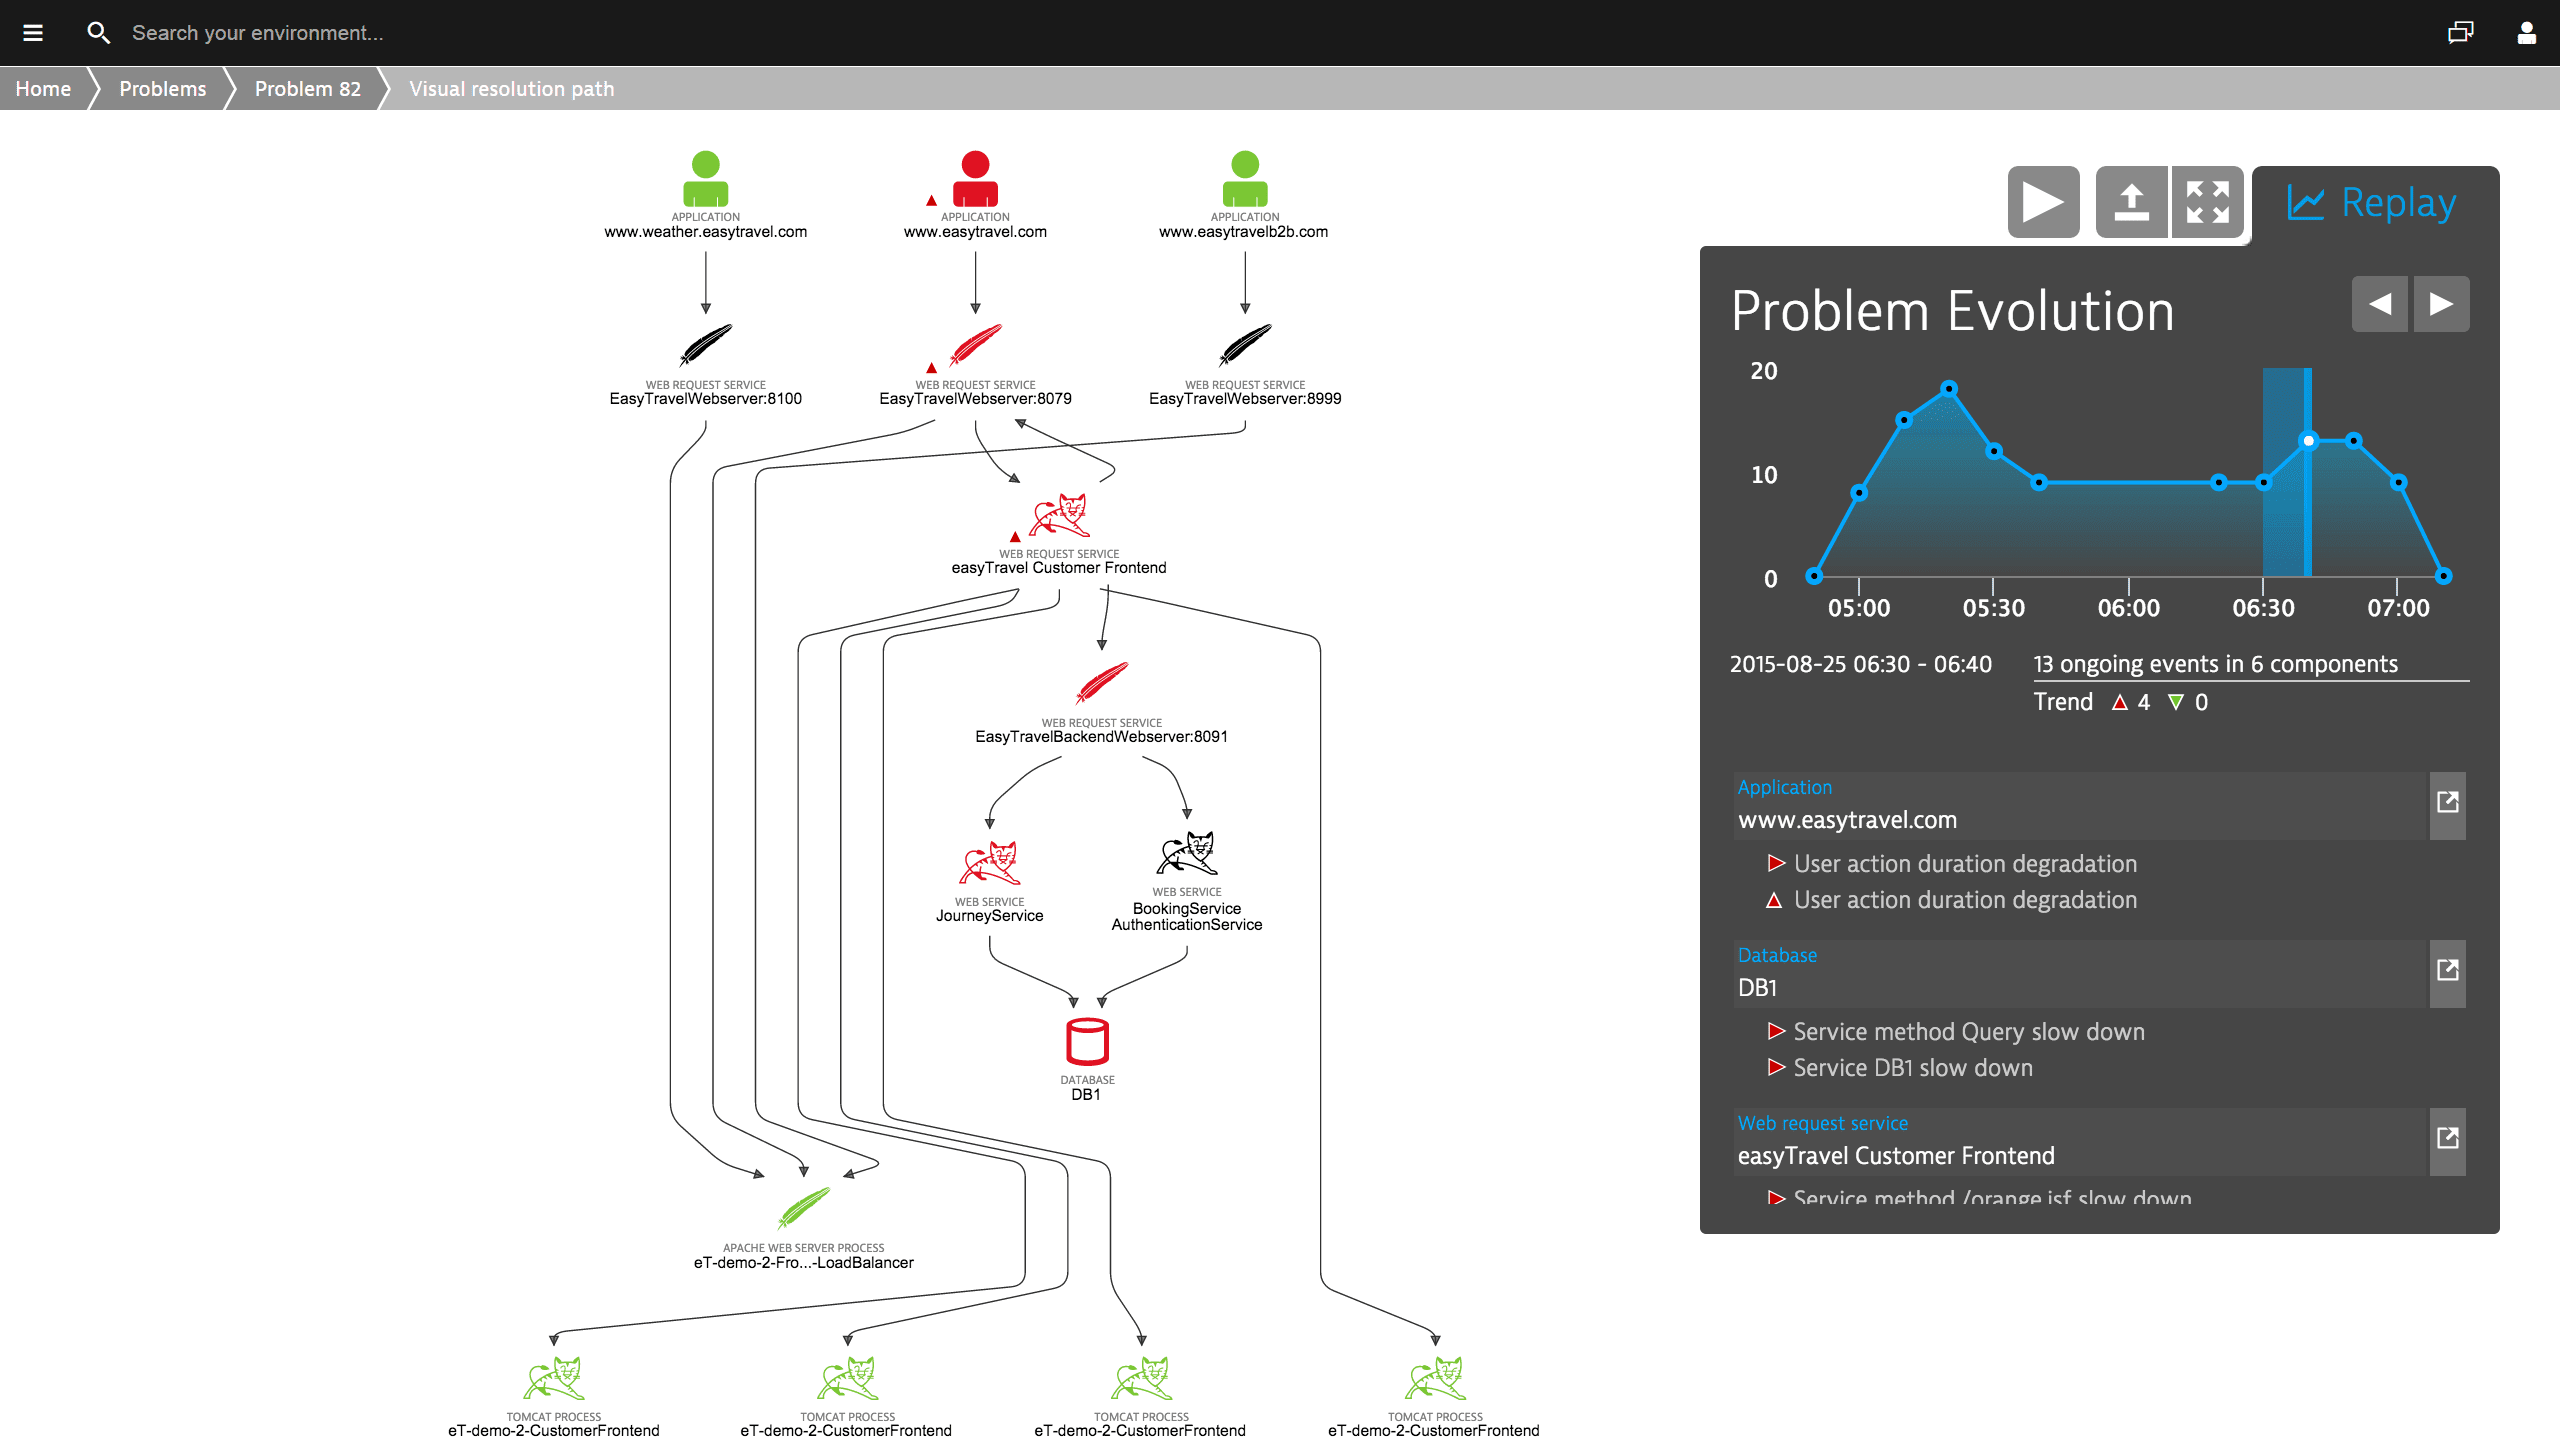
Understand the impact of issues on customer experience
While monitoring your Akka-based applications, Dynatrace learns the details of your entire application architecture automatically.
- Artificial intelligence automatically identifies the dependencies within your environment.
- Dynatrace detects and analyzes availability and performance problems across your entire technology stack.
- Visualize how problems evolve and how they impact the user experience.

Dynatrace was installed within a day and we immediately saw value with issues identified that needed to be addressed, including one in a high value channel that was impacting performance for customers.

Start monitoring your Akka apps with Dynatrace!
Sign up, deploy our agent and get unmatched insights out-of-the-box.


